Long-Term Evolution of the Electrical Stimulation Levels for Cochlear Implant Patients
- Affiliations
-
- 1ENT Service, San Cecilio University Hospital, Granada, Spain.
- 2Department of Surgery and Its Specialities, University of Granada, Granada, Spain.
- 3Department of Signal Theory, Networking and Communications, CITIC, University of Granada, Granada, Spain. isamaru@ugr.es
- KMID: 1489078
- DOI: http://doi.org/10.3342/ceo.2012.5.4.194
Abstract
OBJECTIVES
The stimulation levels programmed in cochlear implant systems are affected by an evolution since the first switch-on of the processor. This study was designed to evaluate the changes in stimulation levels over time and the relationship between post-implantation physiological changes and with the hearing experience provided by the continuous use of the cochlear implant.
METHODS
Sixty-two patients, ranging in age from 4 to 68 years at the moment of implantation participated in this study. All subjects were implanted with the 12 channels COMBI 40+ cochlear implant at San Cecilio University Hospital, Granada, Spain. Hearing loss etiology and progression characteristics varied across subjects.
RESULTS
The analyzed programming maps show that the stimulation levels suffer a fast evolution during the first weeks after the first switch-on of the processor. Then, the evolution becomes slower and the programming parameters tend to be stable at about 6 months after the first switch-on. The evolution of the stimulation levels implies an increment of the electrical dynamic range, which is increased from 15.4 to 20.7 dB and improves the intensity resolution. A significant increment of the sensitivity to acoustic stimuli is also observed. For some patients, we have also observed transitory changes in the electrode impedances associated to secretory otitis media, which cause important changes in the programming maps.
CONCLUSION
We have studied the long-term evolution of the stimulation levels in cochlear implant patients. Our results show the importance of systematic measurements of the electrode impedances before the revision of the programming map. This report also highlights that the evolution of the programming maps is an important factor to be considered in order to determine an adequate calendar fitting of the cochlear implant processor.
MeSH Terms
Figure
-
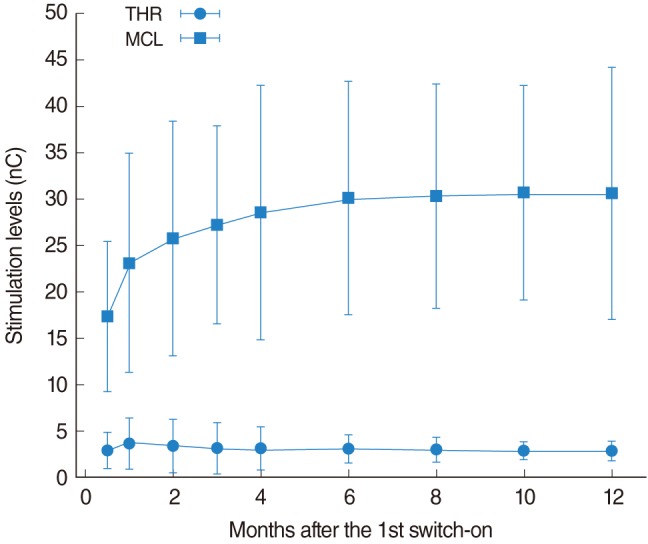
Fig. 1 Evolution of the averaged stimulation levels after the first switch-on of the processor. The vertical bars represent the mean±standard deviation. Stabilization occurred after 6 months of implant use. THR, threshold; MCL, maximum comfortable level; nC, nano-Coulombs.
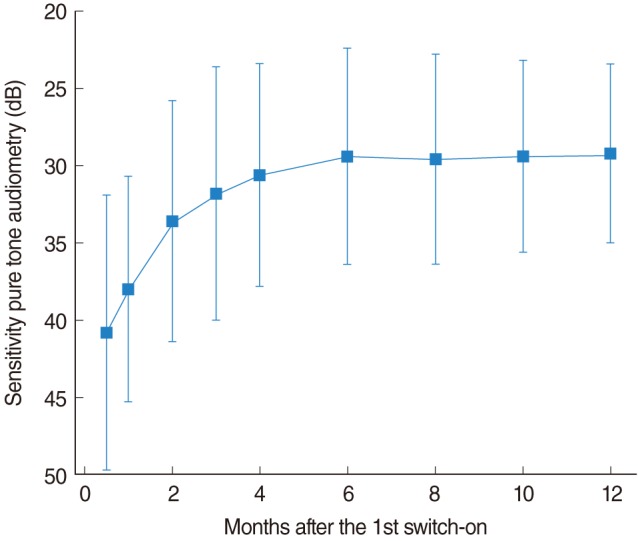
Fig. 2 Evolution of the hearing sensitivity obtained from aided open-field pure tone audiometry. The error bars represent averaged hearing sensitivity±standard deviation. Hearing sensitivity increased during the first 6 months of implant use, thereafter stabilization occurred.
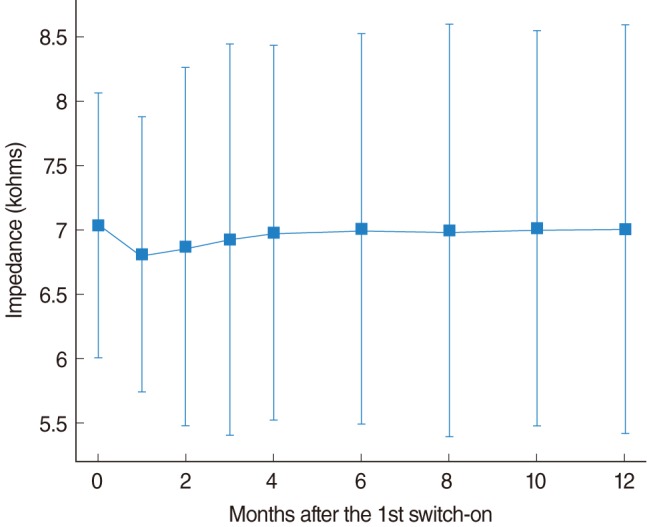
Fig. 3 Evolution of the average electrode impedance. The vertical bars represent the mean±standard deviation. A reduction in the averaged impedances was observed during the first weeks. Although impedances tended to increase with the use of the cochlear implant, no statistically significant differences were found between months.
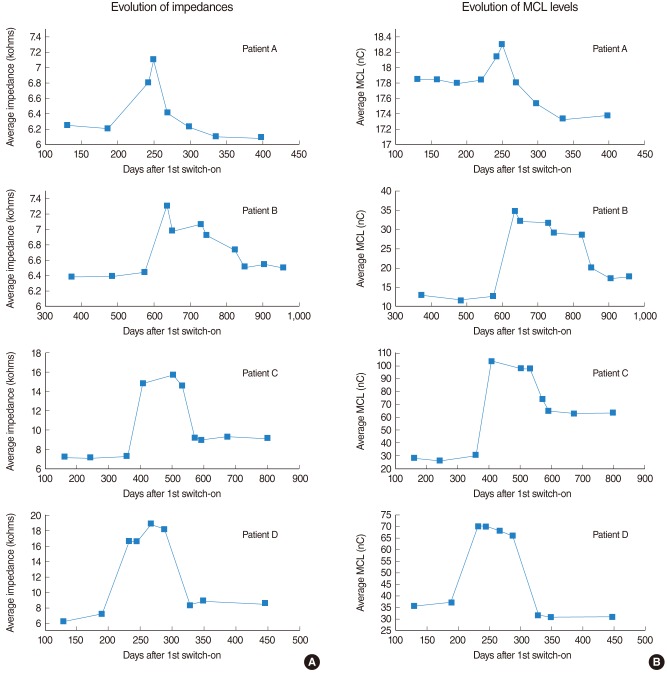
Fig. 4 Transitory alterations of the impedances (A) and the maximum comfortable level (MCL) levels (B) for the 4 patients affected by secretory otitis media. A high relationship between changes in the impedances and changes in the MCL levels can be observed. nC, nano-Coulombs.
Reference
-
1. Wilson BS, Finley CC, Lawson DT, Wolford RD, Eddington DK, Rabinowitz WM. Better speech recognition with cochlear implants. Nature. 1991; 7. 352(6332):236–238. PMID: 1857418.
Article2. Loizou PC. Mimicking the human ear. IEEE Signal Process Mag. 1998; 9. 15(5):101–130.
Article3. Dawson PW, Skok M, Clark GM. The effect of loudness imbalance between electrodes in cochlear implant users. Ear Hear. 1997; 4. 18(2):156–165. PMID: 9099565.
Article4. Battmer RD. Fitting in the real world: all the practical questions and problems. In : The 5th European Symposium on Paediatric Cochlear Implantation; 2000 Jun 4-7; Antwerp, Belgium.5. Hodges AV, Balkany TJ, Ruth RA, Lambert PR, Dolan-Ash S, Schloffman JJ. Electrical middle ear muscle reflex: use in cochlear implant programming. Otolaryngol Head Neck Surg. 1997; 9. 117(3 Pt 1):255–261. PMID: 9334774.
Article6. Brown CJ, Hughes ML, Lopez SM, Abbas PJ. Relationship between EABR thresholds and levels used to program the CLARION speech processor. Ann Otol Rhinol Laryngol Suppl. 1999; 4. 177:50–57. PMID: 10214802.
Article7. Stephan K, Welzl-Muller K. Post-operative stapedius reflex tests with simultaneous loudness scaling in patients supplied with cochlear implants. Audiology. 2000; Jan-Feb. 39(1):13–18. PMID: 10749066.
Article8. Han DM, Chen XQ, Zhao XT, Kong Y, Li YX, Liu S, et al. Comparisons between neural response imaging thresholds, electrically evoked auditory reflex thresholds and most comfortable loudness levels in CII bionic ear users with HiResolution sound processing strategies. Acta Otolaryngol. 2005; 7. 125(7):732–735. PMID: 16012035.
Article9. King JE, Polak M, Hodges AV, Payne S, Telischi FF. Use of neural response telemetry measures to objectively set the comfort levels in the Nucleus 24 cochlear implant. J Am Acad Audiol. 2006; 6. 17(6):413–431. PMID: 16866005.
Article10. Holstad BA, Sonneveldt VG, Fears BT, Davidson LS, Aaron RJ, Richter M, et al. Relation of electrically evoked compound action potential thresholds to behavioral T- and C-levels in children with cochlear implants. Ear Hear. 2009; 2. 30(1):115–127. PMID: 19125034.
Article11. Alvarez I, de la Torre A, Sainz M, Roldan C, Schoesser H, Spitzer P. Using evoked compound action potentials to assess activation of electrodes and predict C-levels in the Tempo+ cochlear implant speech processor. Ear Hear. 2010; 2. 31(1):134–145. PMID: 19838116.
Article12. Shallop JK, Ash KR. Relationships among comfort levels determined by cochlear implant patient's self-programming, audiologist's programming, and electrical stapedius reflex thresholds. Ann Otol Rhinol Laryngol Suppl. 1995; 9. 166:175–176. PMID: 7668623.13. Madell J, Ozdamar S, Sislian N, Hoffman R. Using speech perception errors to modify programming. In : The 8th Symposium on Cochlear Implants in Children; 2001 Feb 28-Mar 3; Los Angeles, CA, USA.14. Sainz M, de la Torre A. Perceptual thresholds of the electrical impulses in cochlear implanted patients. In : The 8th Symposium on Cochlear Implants in Children; 2001 Feb 28-Mar 3; Los Angeles, CA, USA.15. Schmidt M, Griesser A. Long-term stability of fitting parameters with the COMBI 40. Am J Otol. 1997; 11. 18(6 Suppl):S109–S110. PMID: 9391621.16. Hughes ML, Vander Werff KR, Brown CJ, Abbas PJ, Kelsay DM, Teagle HF, et al. A longitudinal study of electrode impedance, the electrically evoked compound action potential, and behavioral measures in nucleus 24 cochlear implant users. Ear Hear. 2001; 12. 22(6):471–486. PMID: 11770670.
Article17. Henkin Y, Kaplan-Neeman R, Muchnik C, Kronenberg J, Hildesheimer M. Changes over time in electrical stimulation levels and electrode impedance values in children using the Nucleus 24M cochlear implant. Int J Pediatr Otorhinolaryngol. 2003; 8. 67(8):873–880. PMID: 12880667.
Article18. Brown CJ, Hughes ML, Luk B, Abbas PJ, Wolaver A, Gervais J. The relationship between EAP and EABR thresholds and levels used to program the nucleus 24 speech processor: data from adults. Ear Hear. 2000; 4. 21(2):151–163. PMID: 10777022.
Article19. Franck KH, Norton SJ. Estimation of psychophysical levels using the electrically evoked compound action potential measured with the neural response telemetry capabilities of Cochlear Corporation's CI24M device. Ear Hear. 2001; 8. 22(4):289–299. PMID: 11527036.
Article20. Welch BL. The significance of the difference between two means when the population variances are unequal. Biometrika. 1938; 2. 29(3-4):350–362.
Article
- Full Text Links
-
- Actions
-
Cited
- CITED
-
- Close
- Share
-
- Similar articles
-
- Long Term Changes of Electrical Stimulation Levels in Children with Cochlear Implant
- A Longitudinal Study of Frequency Specific Electrical Stimulation Levels in Cochlear Implant Users
- Electrically Evoked Stapedial Reflex in Cochlear Implantation
- A Case of Electric Acoustic Stimulation Cochlear Implantation in Partial Deafness with Residual Low-Frequency Hearing
- Cochlear Implant Failure due to Cochlear Nerve Deficiency in a Child with Normal Internal Auditory Canal
