Study of Blue and Red Flash in Dark-Adapted Electroretinogram
- Affiliations
-
- 1Department of Ophthalmology, Soonchunhyang University College of Medicine, Bucheon, Korea. eyedrlim@paran.com
- KMID: 754406
- DOI: http://doi.org/10.3341/kjo.2005.19.2.106
Abstract
- PURPOSE
To investigate the characteristics of the waveform generated by blue and red light stimulations in a dark-adapted electroretinogram (ERG) and those of cone responses in the dark-adapted condition. METHODS: The study subjects were 52 persons (88 eyes) with no previous medical history. The author recorded b-waves (rod response) with red light stimulation and the x-waves (dark-adapted cone response) that appeared before the b-waves. The author also recorded b-waves with blue light stimulation, which had the same amplitude as the b-waves from the red light stimulation. The differences with respect to age and gender were studied. Waveforms of the dark-adapted cone ERGs were recorded by using a digital subtraction technique. RESULTS: The x-wave always appeared before the b-wave with 0 dB (2.4 cd.s/m2) red stimulation. With blue stimulation, a b-wave equivalent to the b-wave stimulated with the red light of 0 dB intensity appeared at an average of -14.57 dB. The implicit time for the b-wave was delayed significantly for the male group. There were no significant differences between different age groups. The dark-adapted cone ERG demonstrated the waveform of a negative response followed by a series of oscillatory potentials (OPs) and a positive response. CONCLUSIONS: The cone responses were followed by the rod responses with red light stimulation of 0 dB in the dark-adapted ERG. The waveforms of the cone ERGs were obtained in dark adaptation with red and blue light stimulation.
Keyword
MeSH Terms
Figure
-
Fig. 1 Insertion of blue filter
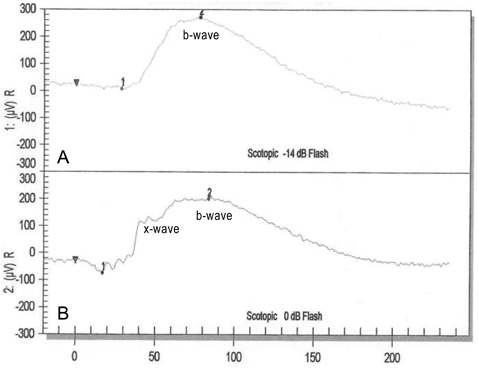
Fig. 2 Dark-adapted electroretinogram in a 23-year-old girl. (A) -14dB blue flash; (B) 0 dB red flash. Scotopic balance was made between red and blue light. A long wavelength (red) light (605 nm) elicits a characteristic biphasic positive response (see B). The early portion of the response, referred to in the literature as the x-wave, is ascribed to cone activity.
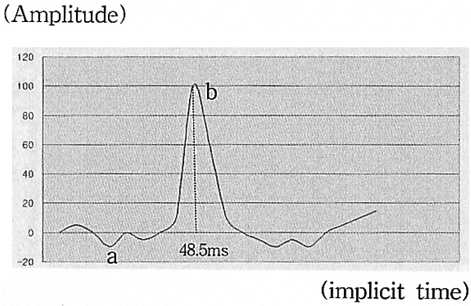
Fig. 3 The dark-adapted cone electroretinogram, determined by digital subtraction technique, demonstrates the waveform of a negative response, a series of oscillatory potentials and a positive response.
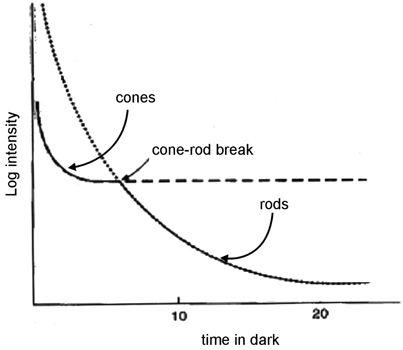
Fig. 4 Dark adaptation curve
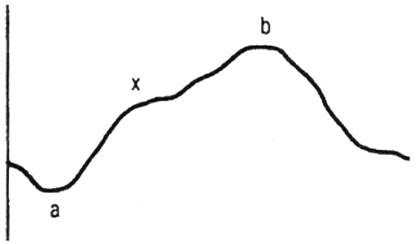
Fig. 5 Both cone (x-wave) and rod (b-wave) functions can be determined with use of single-flash long-wavelength (red) stimulus after dark adaptation.
Reference
-
1. Fishman GA. Fishman GA, editor. The electroretinogram. Electrophysiologic Testing. 2001. 2nd ed. San Francisco: The Foundation of The American Academy of Ophthalmology;1–2.2. Dewar J. The physiologic action of light. Nature. 1877. 15:433–435.3. Riggs LA. Continuous and reproducible records of the electrical activity of the human retina. Proc Soc Exp Biol Med. 1941. 48:204–207.4. International Standards Committee. Standard for clinical electrophysiology. Arch Ophthalmol. 1989. 107:816–819.5. Marmor MF. An updated standard for clinical electroretinography. Arch Ophthalmol. 1995. 113:1375–1376.6. Marmor MF, Zrenner E. Standard for clinical electroretinography (1999 update). ISCEV. Doc Ophthalmol. 1998-99. 97:143–156.7. Lee YI, Ohn YH, Shin HH. Normal Values of Standard Electroretinography, and Change with Age and Sex (I). J Korean Ophthalmol Soc. 1996. 37:1813–1821.8. Choi SH, Ohn YH, Shin HH. Normal Values of Standard Electroretinography, and Change with Age and Sex (II) -Results Using Burian-Allen Electrode and Comparison with Results Using ERG-jet Electrode-. J Korean Ophthalmol Soc. 1999. 40:128–139.9. Motokawa K, Mita T. Electrical light responses of the human retina: (Ed- confirm punctuation here) properties and an improved technique. Tohoku J Clin Exp Med. 1942. 42:114–133.10. Francois J, Verriest G, de Rouck A. Pathology of the x-wave of the human electroretinogram. Br J Ophthalmol. 1956. 40:439–443.11. Verdon WA, Schneck ME. A comparison of three techniques to estimate the human dark-adapted cone electroretinogram. Vision Research. 2003. 43:2089–2099.12. Joo MJ, Lee HK, Yoo JH. Changes in Electroretinogram during Dark Adaptation. J Korean Ophthalmol Soc. 1994. 35:1388–1394.13. Iijima H, Yamaguchi S. Adaptational changes in cone electro-retinograms in man. Nippon Ganka Gakkai Zasshi. 1990. 94:987–992.14. Heckenlively JR. Heckenlively JR, Arden GB, editors. Cone dystrophies and dysfunction. Principle and Practice of Clinical Electrophysiology of Vision. 1991. St. Louis: C.V. Mosby;537–543.15. David G, Jane L, Anderson MS. Standard full field electroretinography. Normal values and their variation with age. Arch Ophthalmol. 1992. 110:1571–1576.16. Mattila V. The clinical electroretinogram II. The difference between the electroretinogram in men and women. Acta Ophthalmol. 1951. 29:25–32.17. Zeidler I. The clinical electroretinogram IX. The normal electroretinogram. Value of the b-potential in different age groups and its difference in men and women. Acta Ophthalmol. 1959. 37:294–301.18. Britton RJ, Drance SM. The area of the neuroretinal rim of the optic nerve in normal eyes. Am J Ophthalmol. 1987. 103:497–504.19. Peterson H. The normal B-potential in the single-flash clinical electroretinogram. Acta Ophthalmol. 1968. 99:S1–S60.20. Weleber RG, Esiner A. Newsome DA, editor. Retinal function and physiological studies. Retinal Dystrophies and Degenerations. 1988. New York: Raven Press;21–69.21. Heynen H, Wachtmeister L, Van Norren D. Origin of the oscillatory potentials in the primate retina. Vision Research. 1985. 25:1365–1373.22. Kellner U, Foerster MH. Color electroretinography. A method for separation of dysfunction of cones. Doc Ophthalmol. 1992. 80:13–23.23. Norren D. Contribution of electroretinography to diagnosis of color vision deficiencies. Jpn J Ophthalmol. 1987. 31:41–49.24. Uji Y. Spectral characteristics of electroretinography in congenital red-green color blindness. Jpn J Ophthalmol. 1987. 31:61–80.25. Reichel E, Bruce AM, Sandberg MA, Berson EL. An electroretinographic and molecular genetic study of X-linked cone degeneration. Am J Ophthalmol. 1989. 108:540–547.
- Full Text Links
-
- Actions
-
Cited
- CITED
-
- Close
- Share
-
- Similar articles
-
- The luminance-response function of the dark-adapted rabbit electroretinogram
- Photopic Negative Response (PhNR) in Normal Subjects
- A Study of Pattern Reversal Visual Evoked Potential and Flash Electroretinogram in Patients with Optic Atrophy
- Congenital Stationary Night Blindness with Myopia
- Relative Afferent Pupillary Defect and Electroretinogram in Patients with Asymmetric Cataracts
