Socio-economic disparity in food consumption among young children in eight South Asian and Southeast Asian countries
- Affiliations
-
- 1International Health Department, Johns Hopkins School of Public Health, Baltimore, MD 21205, USA
- 2Department of Food and Nutrition, College of Human Ecology, Seoul National University, Seoul 08826, Korea
- 3Department of Public Health and Recreation, San José State University, San Jose, CA 95192, USA
- 4Johns Hopkins University School of Medicine, Baltimore, MD 21205, USA
- 5Department of Medical Nutrition, Graduate School of East-West Medical Science, Kyung Hee University, Yongin 17104, Korea
- KMID: 2532098
- DOI: http://doi.org/10.4162/nrp.2022.16.4.489
Abstract
- BACKGROUND/OBJECTIVES
This study examined socio-economic differences in diverse food consumption among children 6–23 months of age in South Asia and Southeast Asian countries.
SUBJECTS/METHODS
Data from Demographic and Health Surveys in four countries in South Asia (n = 15,749) and four countries in Southeast Asia (n = 10,789) were used. Survey-design adjusted proportions were estimated for the following 10 food items: grains, legumes, dark green leafy vegetables (DGLV), vitamin A-rich fruits, vitamin A-rich vegetables, other fruits and vegetables (OFV), fish, meat, dairy, and eggs. An equity gap was defined as an arithmetic difference in the proportion of each food item consumed in the past 24-hours between the wealthiest and lowest quintiles and between rural and urban areas, denoted by percentage points (pp).
RESULTS
The consumption of most of the 10 food items was higher in the wealthiest quintiles and urban areas across eight countries. The size of equity gaps was greater in Southeast Asia than in South Asia, particularly for vitamin A-rich fruits (3.3–30.0 pp vs. 0.3–19.6 pp), vitamin A-rich vegetables (12.1–26.7 pp vs. 2.4–5.9 pp), meat (17.7–33.4 pp vs. 3.4–13.4 pp), and dairy (14.7–32.5 pp vs. 3.3–11.4 pp). However, the size of equity gap in egg consumption was greater in Southeast Asia than South Asia (11.2–19.8 pp vs. 11.0–26.7 pp). Relatively narrower gaps were seen in the consumption of grains (0.3–12.9 pp), DGLV (0.6–12.4 pp), and fish (0.1–16.8 pp) across all countries.
CONCLUSIONS
Equity gaps in food consumption differed by socio-economic status and region. Reducing equity gaps in nutrient-rich foods and utilizing regionally available food resources may increase child dietary quality.
Keyword
Figure
-
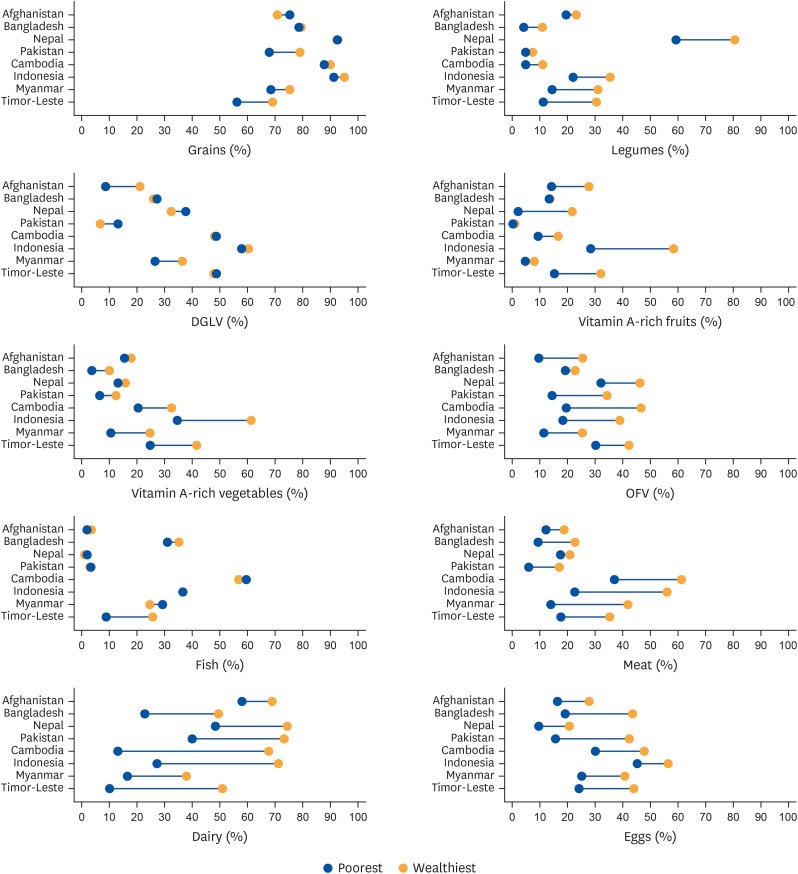
Fig. 1 Equiplots of food group consumption by wealth quintiles (poorest vs. wealthiest) in 4 South Asian countries (Afghanistan, Bangladesh, Pakistan, and Nepal) and 4 Southeast Asian countries (Cambodia, Indonesia, Myanmar, and Timor-Leste).DGLV, dark green leafy vegetables; OFV, other fruits and vegetables.
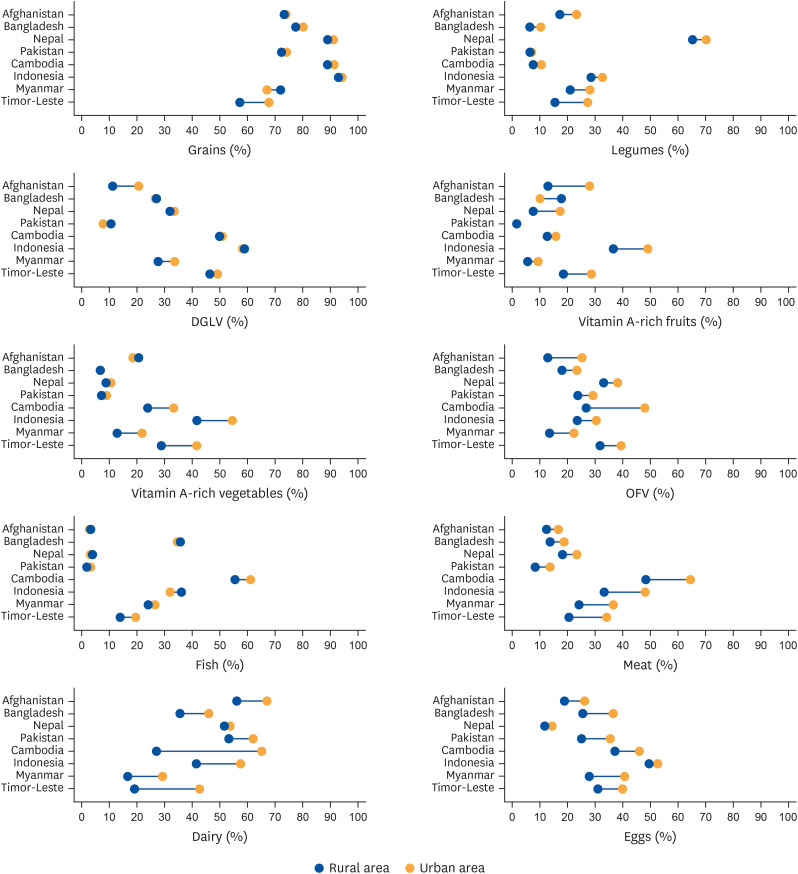
Fig. 2 Equiplots of food group consumption by geographical area (rural vs. urban) in 4 South Asian countries (Afghanistan, Bangladesh, Pakistan, and Nepal) and 4 Southeast Asia countries (Cambodia, Indonesia, Myanmar, and Timor-Leste).DGLV, dark green leafy vegetables; OFV, other fruits and vegetables.
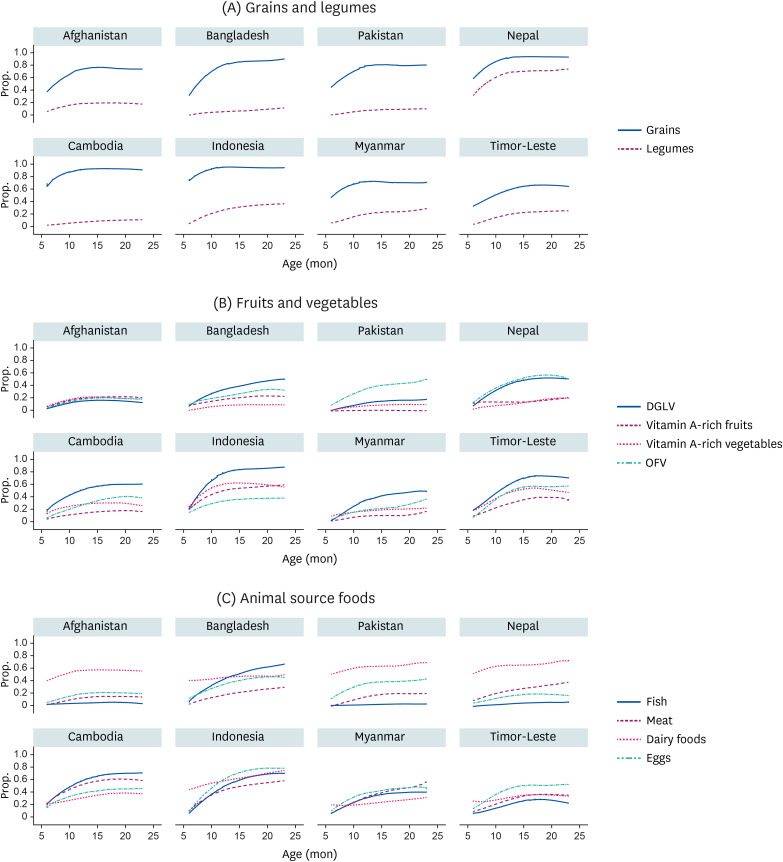
Fig. 3 Consumption of ten food items from 6–23 months of age in 4 South Asian countries (Afghanistan, Bangladesh, Pakistan, and Nepal) and 4 Southeast Asian countries (Cambodia, Indonesia, Myanmar, and Timor-Leste).DGLV, dark green leafy vegetables; OFV, other fruits and vegetables.
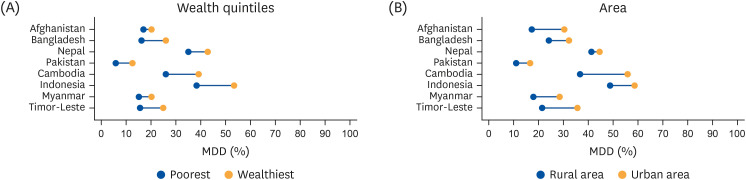
Fig. 4 Equiplots of MDD by (A) wealth quintiles (poorest vs. wealthiest) and (B) geographical area (rural vs. urban) in 4 South Asian countries (Afghanistan, Bangladesh, Pakistan, and Nepal) and 4 Southeast Asia countries (Cambodia, Indonesia, Myanmar, and Timor-Leste).MDD, minimum dietary diversity.
Reference
-
1. Black RE, Victora CG, Walker SP, Bhutta ZA, Christian P, de Onis M, Ezzati M, Grantham-McGregor S, Katz J, Martorell R, et al. Maternal and child undernutrition and overweight in low-income and middle-income countries. Lancet. 2013; 382:427–451. PMID: 23746772.
Article2. World Health Organization. Exclusive breastfeeding for optimal growth, development and health of infants 2019. Geneva: World Health Organization;2019. cited 2020 August 8. Available from: https://www.who.int/elena/titles/exclusive_breastfeeding/en/.3. World Health Organization. Child health: Recommended food for the very early years. Geneva: World Health Organization;2011. cited 2020 November 26. Available from: https://www.who.int/news-room/q-a-detail/child-health-recommended-food-for-the-very-early-years#:~:text=Infants%20can%20eat%20pureed%2C%20mashed,appropriate%20for%20the%20child's%20age.4. World Health Organization. Global Nutrition Monitoring Framework: Operational Guidance for Tracking Progress in Meeting Targets for 2025. Geneva: World Health Organization;2017.5. UNICEF. Infant and young child feeding - UNICEF DATA 2020 November 27, 2020. Available from: https://data.unicef.org/topic/nutrition/infant-and-young-child-feeding/.6. World Health Organization. UNICEF/WHO/The World Bank Group Joint Child Malnutrition Estimates: Levels and Trends in Child Malnutrition: Key Findings of the 2020 Edition. Geneva: World Health Organization;2020.7. Gatica-Domínguez G, Neves PA, Barros AJ, Victora CG. Complementary feeding practices in 80 low- and middle-income countries: prevalence of and socioeconomic inequalities in dietary diversity, meal frequency, and dietary adequacy. J Nutr. 2021; 151:1956–1964. PMID: 33847352.
Article8. Baye K, Kennedy G. Estimates of dietary quality in infants and young children (6–23 mo): Evidence from demographic and health surveys of 49 low- and middle-income countries. Nutrition. 2020; 78:110875. PMID: 32653760.
Article9. National Research Council. Supplemental Nutrition Assistance Program: Examining the Evidence to Define Benefit Adequacy. Washington, D.C.: National Academies Press;2013.10. International Center for Equity in Health. Equiplot. Pelotas: International Center for Equity in Health;2020. cited 2020 August 8. Available from: https://www.equidade.org/equiplot.11. Central Statistics Organization/Afghanistan, Ministry of Public Health/Afghanistan, ICF. Afghanistan Demographic and Health Survey 2015. Kabul: Central Statistics Organization;2017.12. National Institute of Population Research. Training - NIPORT/Bangladesh, Mitra and Associates, ICF International. Bangladesh Demographic and Health Survey 2014. Dhaka: NIPORT, Mitra and Associates, and ICF International;2016.13. Ministry of Health - MOH/Nepal. New ERA/Nepal, ICF. Nepal Demographic and Health Survey 2016. Kathmandu: MOH/Nepal, New ERA, and ICF;2017.14. National Institute of Population Studies - NIPS/Pakistan. ICF. Pakistan Demographic and Health Survey 2017–18. Islamabad: NIPS/Pakistan and ICF;2019.15. National Institute of Statistics/Cambodia, Directorate General for Health/Cambodia, ICF International. Cambodia Demographic and Health Survey 2014. Phnom Penh: National Institute of Statistics/Cambodia, Directorate General for Health/Cambodia, and ICF International;2015.16. Ministry of Health, Sports - MoHS/Myanmar, ICF. Myanmar Demographic and Health Survey 2015–16. Nay Pyi Taw: MoHS and ICF;2017.17. National Population. Family Planning Board, Statistical Indonesia, Ministry of Health - Kemenkes, ICF. Indonesia Demographic and Health Survey 2017. Jakarta: BKKBN, BPS, Kemenkes, and ICF;2018.18. General Directorate of Statistics, Ministry of Finance/Timor Leste, ICF. Timor-Leste Demographic and Health Survey 2016. Dili: GDS and ICF;2018.19. Mujica OJ, Victora CG. Obesity inequality among adults in Latin America and the Caribbean. Lancet Glob Health. 2019; 7:e1589–e1590. PMID: 31708129.
Article20. Central Statistics Organization. MoPHM, and ICF. Afghanistan Demographic and Health Survey 2015. Kabul: Central Statistics Organization;2017.21. National Institute of Population Research and Training. Bangladesh Demographic and Health Survey 2017–18. Dhaka, Rockville (MA): NIPORT and ICF;2020.22. National Institute of Population Studies and ICF. Pakistan Demographic and Health Survey 2017–18. Islamabad, Rockville (MA): NIPS and ICF;2019.23. Ministry of Health of Nepal. Nepal Demographic and Health Survey 2016. Kathmandu: Ministry of Health of Nepal;2017.24. National Institute of Statistics, Directorate General for Health, and ICF International. Cambodia Demographic and Health Survey 2014. Phnom Penh, Rockville (MA): National Institute of Statistics, Directorate General for Health, and ICF International;2015.25. National Population and Family Planning Board (BKKBN) SIB, Ministry of Health (Kemenkes). Indonesia Demographic and Health Survey 2017. Jakarta: BKKBN, BPS, Kemenkes, and ICF;2018.26. Ministry of Health and Sports (MoHS) and ICF. Myanmar Demographic and Health Survey 2015–16. Nay Pyi Taw, Rockville (MA): Ministry of Health and Sports and ICF;2017.27. General Directorate of Statistics (GDS) MoHaI. Timor-Leste Demographic and Health Survey 2016. Dili, Rockville (MA): GDS and ICF;2018.28. Muhammad A, D’Souza A, Meade B, Micha R, Mozaffarian D. How income and food prices influence global dietary intakes by age and sex: evidence from 164 countries. BMJ Glob Health. 2017; 2:e000184–e000184.
Article29. United Nations. World Social Report 2020 Inequality in a Rapidly Changing World. San Francisco (CA): United Nations;2020.30. Future Learn. Food system types in Southeast Asia. London: Future Learn;2020. cited 2020 November 26. Available from: https://www.futurelearn.com/info/courses/food-systems-southeast-asia/0/steps/83768.31. Mittal S, Sethi D. Food Security in South Asia: Issues and Opportunities. Working Paper. New Delhi: Indian Council for Research on International Economic Relations;2009.32. Haddad L, Hawkes C, Waage J, Webb P, Godfray C, Toulmin C. Food Systems and Diets: Facing the Challenges of the 21st Century. London: Global Panel on Agriculture and Food Systems for Nutrition;2016.33. Akhtar S, Ahmed A, Randhawa MA, Atukorala S, Arlappa N, Ismail T, Ali Z. Prevalence of vitamin A deficiency in South Asia: causes, outcomes, and possible remedies. J Health Popul Nutr. 2013; 31:413–423. PMID: 24592582.
Article34. Herran OF, Patiño GA, Gamboa EM. Socioeconomic inequalities in the consumption of fruits and vegetables: colombian National Nutrition Survey, 2010. Cad Saude Publica. 2019; 35:e00031418. PMID: 30892423.
Article35. Mason-D’Croz D, Bogard JR, Sulser TB, Cenacchi N, Dunston S, Herrero M, Wiebe K. Gaps between fruit and vegetable production, demand, and recommended consumption at global and national levels: an integrated modelling study. Lancet Planet Health. 2019; 3:e318–e329. PMID: 31326072.36. Drewnowski A, Mognard E, Gupta S, Ismail MN, Karim NA, Tibère L, Laporte C, Alem Y, Khusun H, Februhartanty J, et al. Socio-cultural and economic drivers of plant and animal protein consumption in Malaysia: the SCRiPT study. Nutrients. 2020; 12:1530.
Article37. Muslimatun S, Wiradnyani LA. Dietary diversity, animal source food consumption and linear growth among children aged 1–5 years in Bandung, Indonesia: a longitudinal observational study. Br J Nutr. 2016; 116(Suppl 1):S27–S35. PMID: 26817493.
Article38. World Health Organization. Global and regional food consumption patterns and trends. Geneva: World Health Organization;2020. cited 2020 November 26. Available from: https://www.who.int/dietphysicalactivity/publications/trs916/en/gsfao_global.pdf.39. Choudhury S, Headey DD. Household dairy production and child growth: evidence from Bangladesh. Econ Hum Biol. 2018; 30:150–161. PMID: 30048913.
Article40. Iqbal SJ. Importance of Dairy Industry in Pakistan’s Fight Against Malnutrition. 2020. cited 2020 November 26. Available from: https://nation.com.pk/06-Jun-2020/importance-of-dairy-industry-in-pakistan-s-fight-against-malnutrition.41. Burki AA, Khan MA. Economic Impact of Pakistan’s Dairy Sector: Lessons for Building Sustainable Value. Punjab: Lahore University of Management Sciences;2019.42. Headey D, Martin WJ, Laborde D. Dairy Markets and Child Nutrition in the Developing World. Washington, D.C.: IFPRI;2018.43. Kaimila Y, Divala O, Agapova SE, Stephenson KB, Thakwalakwa C, Trehan I, Manary MJ, Maleta KM. Consumption of animal-source protein is associated with improved height-for-age z scores in rural Malawian children aged 12–36 months. Nutrients. 2019; 11:480.
Article44. Tezzo X, Bush SR, Oosterveer P, Belton B. Food system perspective on fisheries and aquaculture development in Asia. Agric Hum Values. 2021; 38:73–90.
Article45. Beveridge MC, Thilsted SH, Phillips MJ, Metian M, Troell M, Hall SJ. Meeting the food and nutrition needs of the poor: the role of fish and the opportunities and challenges emerging from the rise of aquaculture. J Fish Biol. 2013; 83:1067–1084. PMID: 24090563.
Article46. Herforth A, Arimond M, Álvarez-Sánchez C, Coates J, Christianson K, Muehlhoff E. A global review of food-based dietary guidelines. Adv Nutr. 2019; 10:590–605. PMID: 31041447.
Article47. Angeles-Agdeppa I, Lenighan YM, Jacquier EF, Toledo MB, Capanzana MV. The impact of wealth status on food intake patterns in Filipino school-aged children and adolescents. Nutrients. 2019; 11:2910.
Article48. Baek Y, Chitekwe S. Sociodemographic factors associated with inadequate food group consumption and dietary diversity among infants and young children in Nepal. PLoS One. 2019; 14:e0213610. PMID: 30856209.
Article49. Thorne-Lyman AL, Valpiani N, Akter R, Baten MA, Genschick S, Karim M, Thilsted SH. Fish and meat are often withheld from the diets of infants 6 to 12 months in fish-farming households in rural Bangladesh. Food Nutr Bull. 2017; 38:354–368. PMID: 28618837.
Article
- Full Text Links
-
- Actions
-
Cited
- CITED
-
- Close
- Share
-
- Similar articles
-
- Food and Nutrient Consumption Patterns of Korean Adults by Socioeconomic Status
- Overview of Asian clinical practice guidelines for the management of hepatocellular carcinoma: An Asian perspective comparison
- Dietary acculturation and changes of Central Asian immigrant workers in South Korea by health perception
- The Change in Undergraduate Students' Food Consumption Behavior due to Korean Economic Crisis in 1997
- The Cultural Context of Plagiarism and Research Misconduct in the Asian Region
