The Crucial Role of the Establishment of Computed Tomography Density Conversion Tables for Treating Brain or Head/Neck Tumors
- Affiliations
-
- 1Department of Radiation Oncology, Chi Mei Medical Center, Liouying, Tainan, Taiwan
- 2Department of Medical Imaging and Radiological Sciences, Kaohsiung Medical University, Kaohsiung, Taiwan
- 3Chiu Ho Medical System Co., LTD, Taipei, Taiwan
- 4Graduate Institute of Medical Science, Chang Jung Christian University, Tainan, Taiwan
- 5Department of Radiation Oncology, Chi Mei Medical Center, Tainan, Taiwan
- KMID: 2521093
- DOI: http://doi.org/10.14316/pmp.2021.32.3.59
Abstract
- Purpose
The relationship between computed tomography (CT) number and electron density (ED) has been investigated in previous studies. However, the role of these measures for guiding cancer treatment remains unclear.
Methods
The CT number was plotted against ED for different imaging protocols. The CT number was imported into ED tables for the Pinnacle treatment planning system (TPS) and was used to determine the effect on dose calculations. Conversion tables for radiation dose calculations were generated and subsequently monitored using a dosimeter to determine the effect of different CT scanning protocols and treatment sites. These tables were used to retrospectively recalculate the radiation therapy plans for 41 patients after an incorrect scanning protocol was inadvertently used. The gamma index was further used to assess the dose distribution, percentage dose difference (DD), and distance-to-agreement (DTA).
Results
For densities <1.1 g/cm3 , the standard deviation of the CT number was ±0.6% and the greatest variation was noted for brain protocol conditions. For densities >1.1 g/cm3 , the standard deviation of the CT number was ±21.2% and the greatest variation occurred for the tube voltage and head and neck (H&N) protocol conditions. These findings suggest that the factors most affecting the CT number are the tube voltage and treatment site (brain and H&N). Gamma index analyses for the 41 retrospective clinical cases, as well as brain metastases and H&N tumors, showed gamma passing rates >90% and <90% for the passing criterion of 2%/2 and 1%/1 mm, respectively.
Conclusions
The CT protocol should be carefully decided for TPS. The correct protocol should be used for the corresponding TPS based on the treatment site because this especially affects the dose distribution for brain metastases and H&N tumor recognition. Such steps could help reduce systematic errors.
Keyword
Figure
-
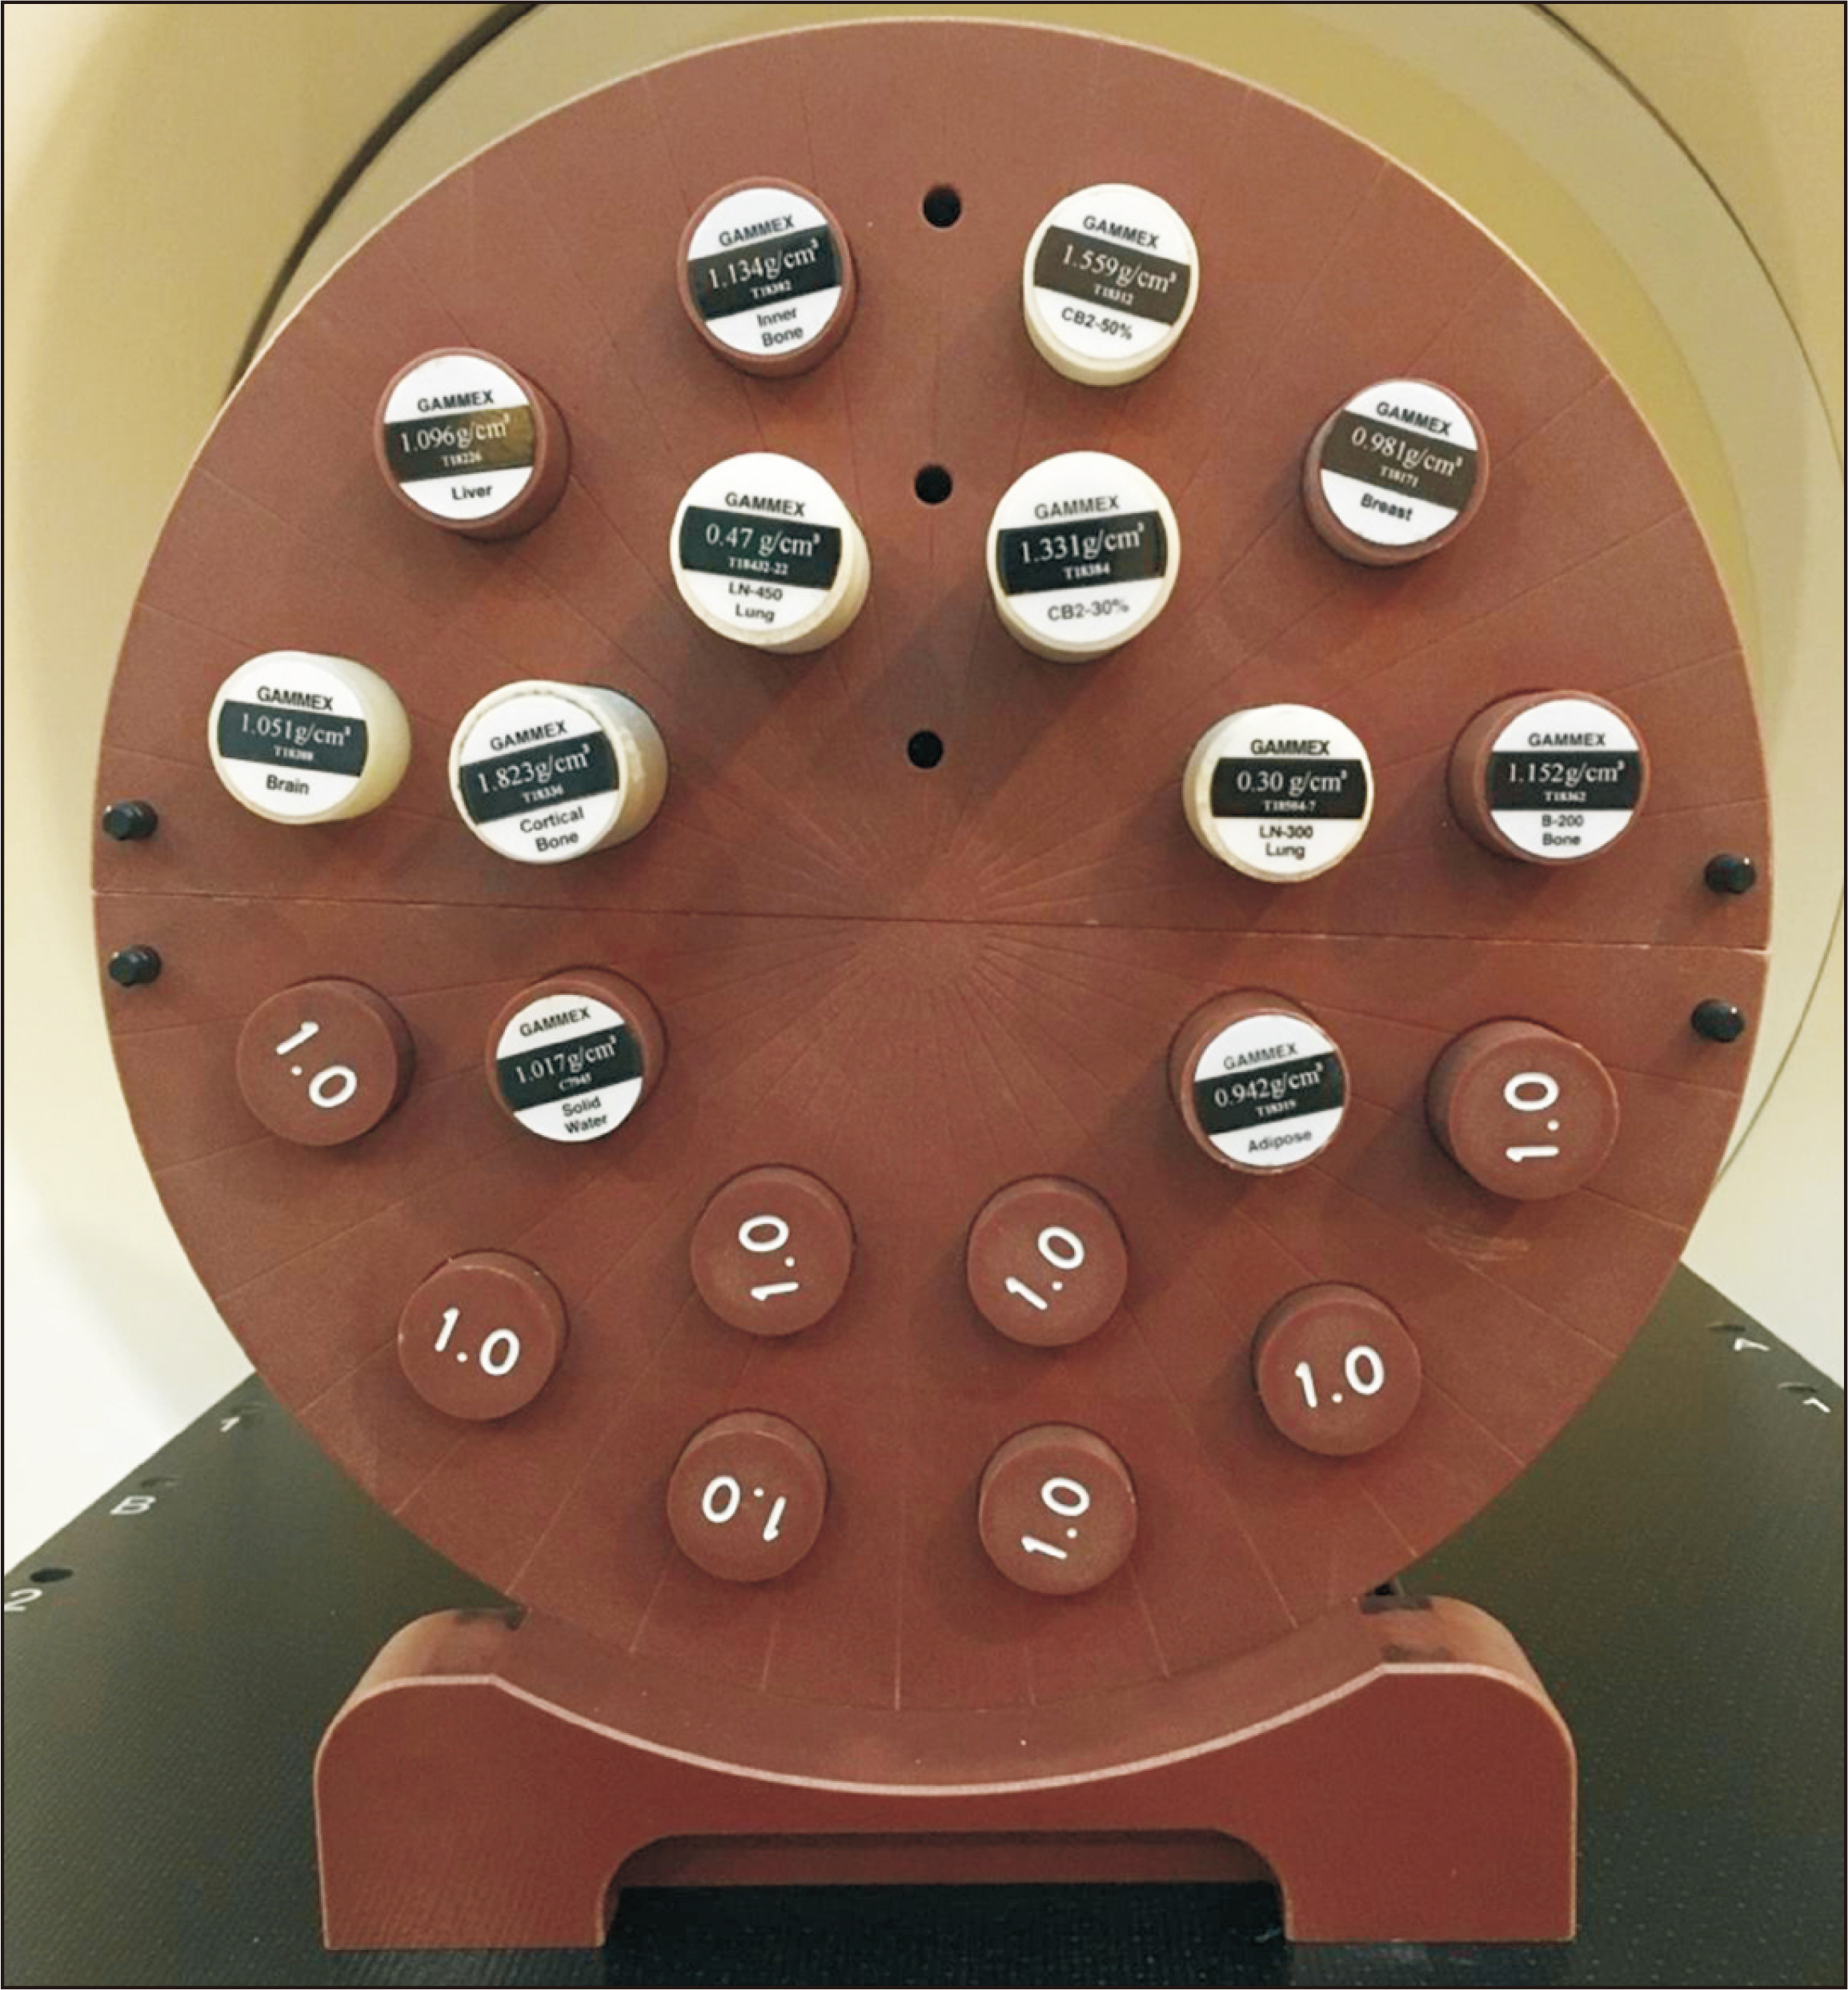
Fig. 1 The cylindrical Cheese Virtual WaterTM phantom.
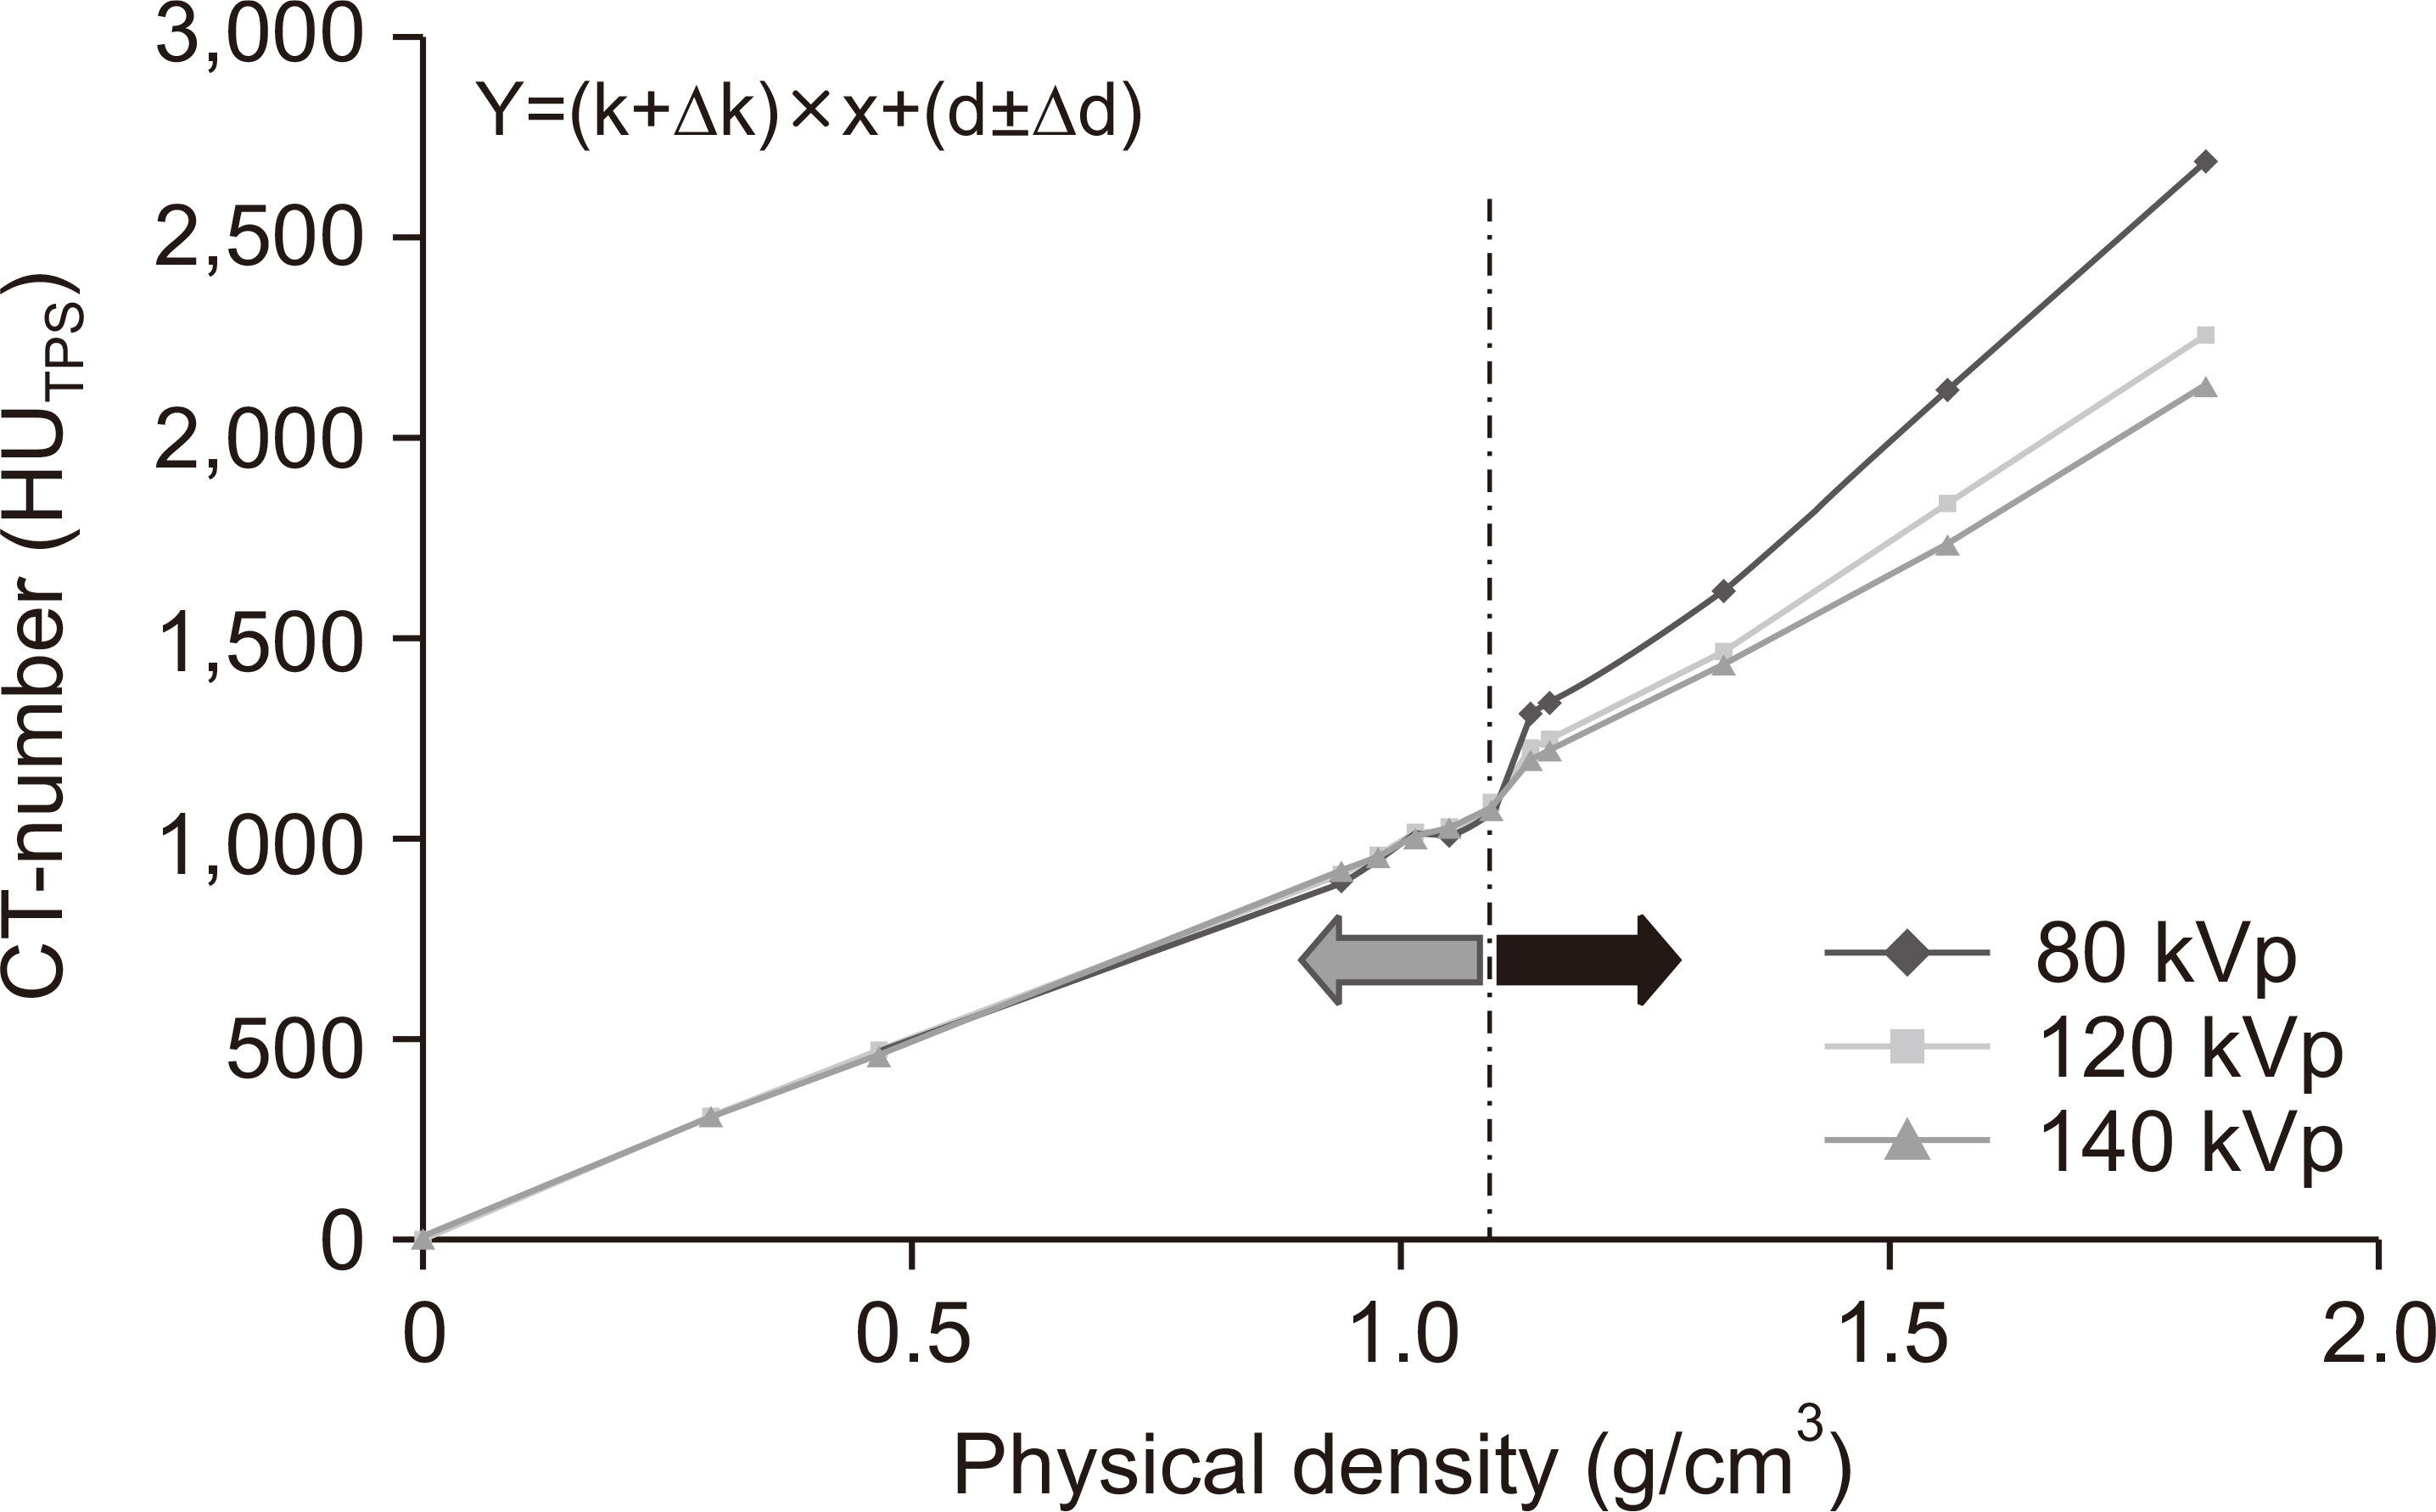
Fig. 2 The computed tomography (CT) number–electron density conversion tables were split into two ranges: <1.1 and >1.1 g/cm3 densities. A straight-line fit was constructed for each range. The mean and standard deviation for each range and set of scanning conditions were used as a measure of the CT number relative to the CT scanning parameters.

Fig. 3 The computed tomography (CT) number–electron density conversion tables using different tube voltages. For densities >1.1 g/cm3, the standard deviation for the CT number was ±21.2%. For densities <1.1 g/cm3, the standard deviation for the CT number was ±0.6%.
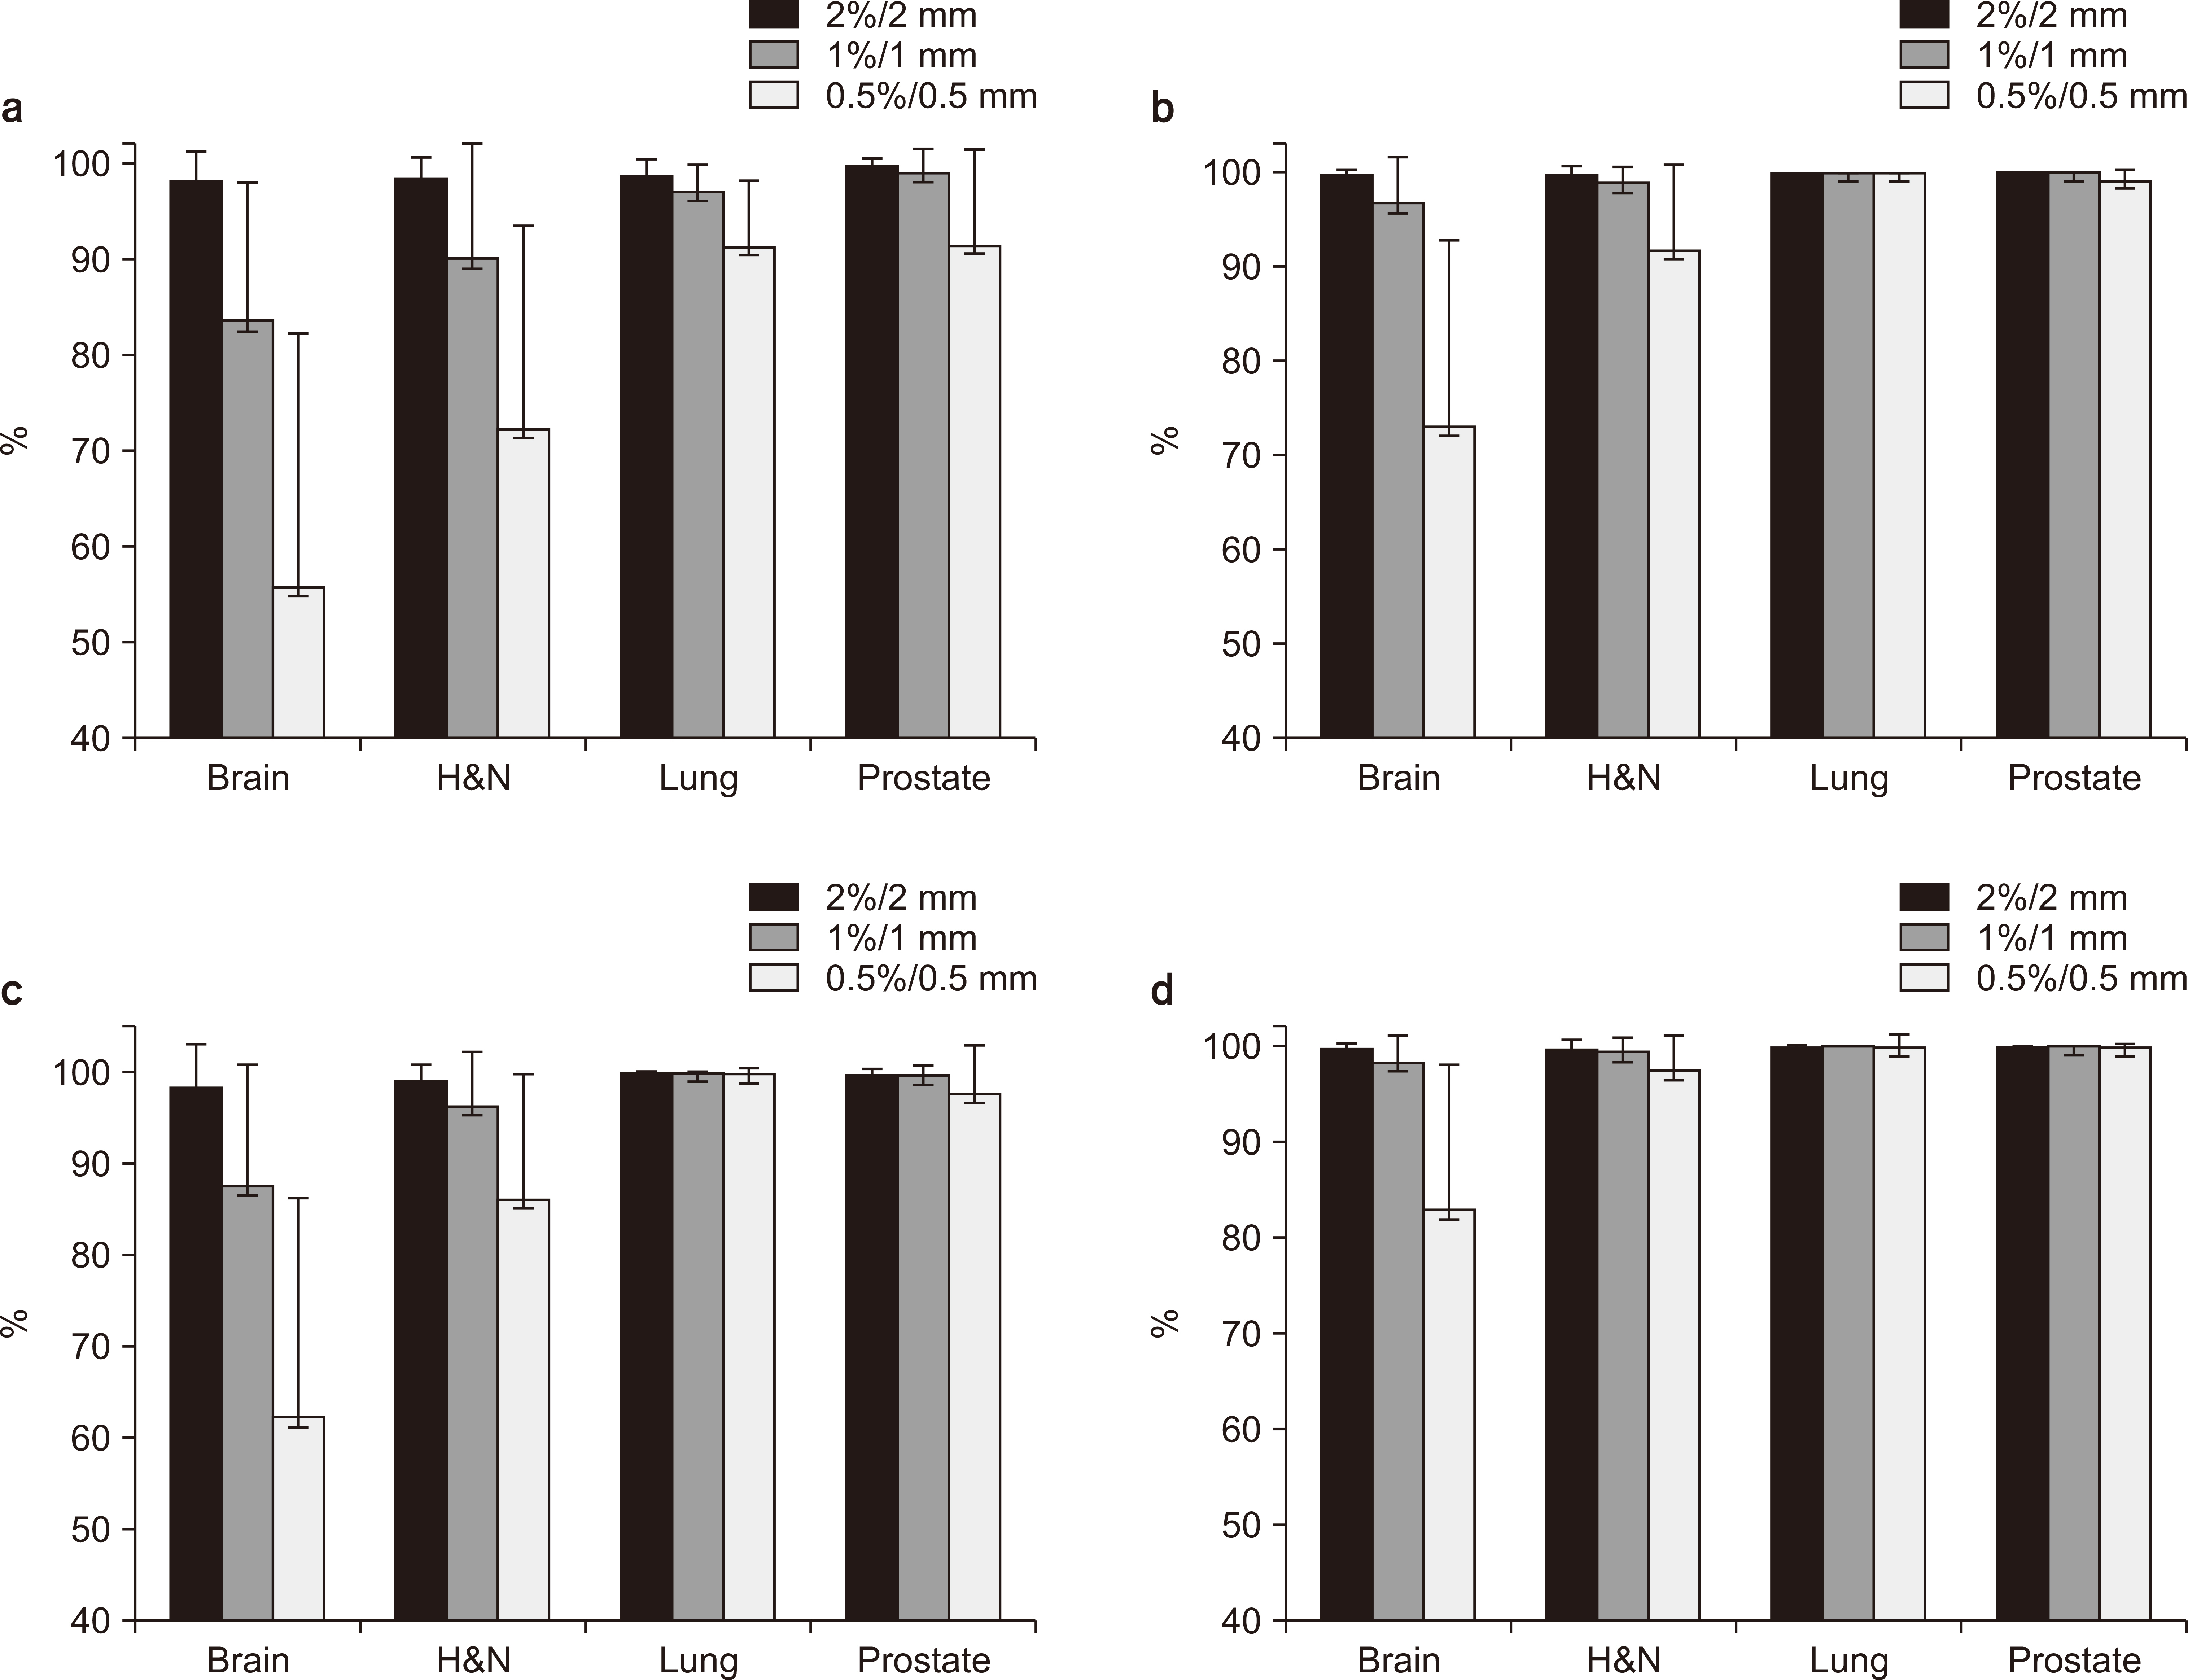
Fig. 4 Local gamma passing rates with various passing criteria calculated from the PTW–VeriSoft® dosimeter measurements are shown for (a) the 80 and 140 kVp plans and (b) the 120 and 140 kVp plans. Global gamma passing rates with various passing criteria calculated from the PTW–VeriSoft® dosimeter measurements are shown for (c) the 80 and 140 kVp plans and (d) the 120 s and 140 kVp plans. The dosimetric effects for the four treatment sites (brain metastases plans, head and neck cancer plans, lung cancer plans, and prostate cancer plans) were analyzed. The error bars above the histogram indicate the standard deviation.

Fig. 5 Sagittal view of a brain metastases treatment plan (a) parallel to the IOM line and across the frontal lobe (the top of the ROI), (b) parallel to the IOM line and across the corpus callosum (the middle of the ROI), and (c) parallel to the IOM line and across the cerebellum (the end of the ROI). The local gamma passing rates for various passing criteria were compared for 1%/1 mm and show (d–f) ED calibrations of 80 and 140 kVp and (g–i) ED calibrations of 120 and 140 kVp. Passing criteria: gamma ≤1. Green 90.0%–100.0%, yellow 75.0%–90.0%, and red 0.0%–75.0%. IOM, inferior orbitomeatal; ROI, circular region of interest; ED, electron density.

Fig. 6 Sagittal view of H&N tumor treatment plan system (a) parallel to the line and across the maxillary sinus (the top of the ROI), (b) parallel to the IOM line and across the mandible (the middle of the ROI), and (c) parallel to the IOM line and across the C7 (the end of the ROI). The local gamma passing rates for various passing criteria were compared for 1%/1 mm and show (d–f) ED calibrations of 80 and 120 kVp and (g–i) ED calibrations of 120 and 140 kVp. Passing criteria: gamma ≤1. Green 90.0%–100.0%, yellow 75.0%–90.0%, and red 0.0%–75.0%. IOM, inferior orbitomeatal; ROI, circular region of interest; ED, electron density.
Reference
-
References
1. Das IJ, Cheng CW, Cao M, Johnstone PA. 2016; Computed tomography imaging parameters for inhomogeneity correction in radiation treatment planning. J Med Phys. 41:3–11. DOI: 10.4103/0971-6203.177277. PMID: 27051164. PMCID: PMC4795414.
Article2. Geise RA, McCullough EC. 1977; The use of CT scanners in megavoltage photon-beam therapy planning. Radiology. 124:133–141. DOI: 10.1148/124.1.133. PMID: 405706.
Article3. Goodsitt MM, Christodoulou EG, Larson SC. 2011; Accuracies of the synthesized monochromatic CT numbers and effective atomic numbers obtained with a rapid kVp switching dual energy CT scanner. Med Phys. 38:2222–2232. DOI: 10.1118/1.3567509. PMID: 21626956.
Article4. Lv P, Liu J, Zhang R, Jia Y, Gao J. 2015; Combined use of automatic tube voltage selection and current modulation with iterative reconstruction for CT evaluation of small hypervascular hepatocellular carcinomas: effect on lesion conspicuity and image quality. Korean J Radiol. 16:531–540.
Article5. Guan H, Yin FF, Kim JH. 2002; Accuracy of inhomogeneity correction in photon radiotherapy from CT scans with different settings. Phys Med Biol. 47:N223–N231. DOI: 10.1088/0031-9155/47/17/402. PMID: 12361225.
Article6. Davis AT, Palmer AL, Nisbet A. 2017; Can CT scan protocols used for radiotherapy treatment planning be adjusted to optimize image quality and patient dose? A systematic review. Br J Radiol. 90:20160406. DOI: 10.1259/bjr.20160406. PMID: 28452568. PMCID: PMC5603945.
Article7. Cropp RJ, Seslija P, Tso D, Thakur Y. 2013; Scanner and kVp dependence of measured CT numbers in the ACR CT phantom. J Appl Clin Med Phys. 14:4417. DOI: 10.1120/jacmp.v14i6.4417. PMID: 24257284. PMCID: PMC5714621.
Article8. Skrzyński W, Zielińska-Dabrowska S, Wachowicz M, Slusarczyk-Kacprzyk W, Kukołowicz PF, Bulski W. 2010; Computed tomography as a source of electron density information for radiation treatment planning. Strahlenther Onkol. 186:327–333. DOI: 10.1007/s00066-010-2086-5. PMID: 20458451.
Article9. du Plessis FC, Willemse CA, Lötter MG, Goedhals L. 2001; Comparison of the Batho, ETAR and Monte Carlo dose calculation methods in CT based patient models. Med Phys. 28:582–589. DOI: 10.1118/1.1357223. PMID: 11339755.
Article10. Cozzi L, Fogliata A, Buffa F, Bieri S. 1998; Dosimetric impact of computed tomography calibration on a commercial treatment planning system for external radiation therapy. Radiother Oncol. 48:335–338. DOI: 10.1016/s0167-8140(98)00072-3. PMID: 9925254.
Article11. Zurl B, Tiefling R, Winkler P, Kindl P, Kapp KS. 2014; Hounsfield units variations: impact on CT-density based conversion tables and their effects on dose distribution. Strahlenther Onkol. 190:88–93. DOI: 10.1007/s00066-013-0464-5. PMID: 24201381.12. Görlitz E. 2006. Dosimetrische und verfahrenstechnische Untersuchungen zur Qualitätssicherung eines Bestrahlungsplanungsprogramms. [Thesis]. Universität Hamburg;Hambur:13. Low DA, Harms WB, Mutic S, Purdy JA. 1998; A technique for the quantitative evaluation of dose distributions. Med Phys. 25:656–661. DOI: 10.1118/1.598248. PMID: 9608475.
Article14. Cheng A, Gerber RL, Wong JW, Purdy JA. Harms WB Sr. 1996; Systematic verification of a three-dimensional electron beam dose calculation algorithm. Med Phys. 23:685–693. DOI: 10.1118/1.597714. PMID: 8724741.
Article15. Shiu AS, Tung S, Hogstrom KR, Wong JW, Gerber RL, Harms WB, et al. 1992; Verification data for electron beam dose algorithms. Med Phys. 19:623–636. DOI: 10.1118/1.596808. PMID: 1508101.
Article16. William BH, Daniel AL, James AP. 1994; A quantitative software analysis tool for verifying 3-d dose calculation programs. Int J Radiat Oncol Biol Phys. 30(Suppl 1):187.17. Ezzell GA, Galvin JM, Low D, Palta JR, Rosen I, Sharpe MB, et al. 2003; Guidance document on delivery, treatment planning, and clinical implementation of IMRT: report of the IMRT Subcommittee of the AAPM Radiation Therapy Committee. Med Phys. 30:2089–2115. DOI: 10.1118/1.1591194. PMID: 12945975.
Article18. Fraass B, Doppke K, Hunt M, Kutcher G, Starkschall G, Stern R, et al. 1998; American Association of Physicists in Medicine Radiation Therapy Committee Task Group 53: quality assurance for clinical radiotherapy treatment planning. Med Phys. 25:1773–1829. DOI: 10.1118/1.598373. PMID: 9800687.
Article19. Thomas SJ. 1999; Relative electron density calibration of CT scanners for radiotherapy treatment planning. Br J Radiol. 72:781–786. DOI: 10.1259/bjr.72.860.10624344. PMID: 10624344.
Article20. Rhee DJ, Kim S, Jeong DH, Moon YM, Kim JK. 2015; Effects of the difference in tube voltage of the CT scanner on dose calculation. J Korean Phys Soc. 67:123–128.
Article21. Van Dyk J, Barnett RB, Cygler JE, Shragge PC. 1993; Commissioning and quality assurance of treatment planning computers. Int J Radiat Oncol Biol Phys. 26:261–273. DOI: 10.1016/0360-3016(93)90206-b. PMID: 8491684.22. Gershkevitsh E, Schmidt R, Velez G, Miller D, Korf E, Yip F, et al. 2008; Dosimetric verification of radiotherapy treatment planning systems: results of IAEA pilot study. Radiother Oncol. 89:338–346. DOI: 10.1016/j.radonc.2008.07.007. PMID: 18701178.
Article23. Kilby W, Sage J, Rabett V. 2002; Tolerance levels for quality assurance of electron density values generated from CT in radiotherapy treatment planning. Phys Med Biol. 47:1485–1492. DOI: 10.1088/0031-9155/47/9/304. PMID: 12043814.
Article24. Venselaar J, Welleweerd H, Mijnheer B. 2001; Tolerances for the accuracy of photon beam dose calculations of treatment planning systems. Radiother Oncol. 60:191–201. DOI: 10.1016/s0167-8140(01)00377-2. PMID: 11439214.
Article25. Yang SC, Chang YL, Chang LY, Ho SY. 2018; The effectiveness of skill learning assessment using direct observation of procedural skills (DOPS) in the training of post-graduate training year and internship students of radiological technologist. C J Radiologic Tech. 42:89–96.
- Full Text Links
-
- Actions
-
Cited
- CITED
-
- Close
- Share
-
- Similar articles
-
- Deep neck infection : Comparision of computed tomography scan and surgical findings
- A Case of Vidian Nerve Schwannoma: Resection by Endoscopic Sinus Surgery
- Preenhanced computed tomographic findings in brain death
- The Role of Protein Kinase in Head and Neck Cancer
- Animal Models of Cancer in the Head and Neck Region
