Distinct Dose-Dependent Association of Free Fatty Acids with Diabetes Development in Nonalcoholic Fatty Liver Disease Patients
- Affiliations
-
- 1Department of Gastroenterology, The First Affiliated Hospital, Sun Yat-sen University, Guangzhou, China
- 2Department of Clinical Laboratory, The First Affiliated Hospital, Sun Yat-sen University, Guangzhou, China
- 3Department of Radiology, The First Affiliated Hospital, Sun Yat-sen University, Guangzhou, China
- KMID: 2516343
- DOI: http://doi.org/10.4093/dmj.2020.0039
Abstract
- Background
Excessive delivery of free fatty acids (FFAs) to the liver promotes steatosis and insulin resistance (IR), with IR defined as reduced glucose uptake, glycogen synthesis and anti-lipolysis stimulated by normal insulin levels. Whether the associations between FFAs and diabetes development differ between patients with and without nonalcoholic fatty liver disease (NAFLD) remains unclear.
Methods
Consecutive subjects (2,220 NAFLD subjects and 1,790 non-NAFLD subjects according to ultrasound imaging) were enrolled from the First Affiliated Hospital of Sun Yat-sen University between 2009 and 2019. The homeostasis model assessment of insulin resistance (HOMA-IR) was calculated.
Results
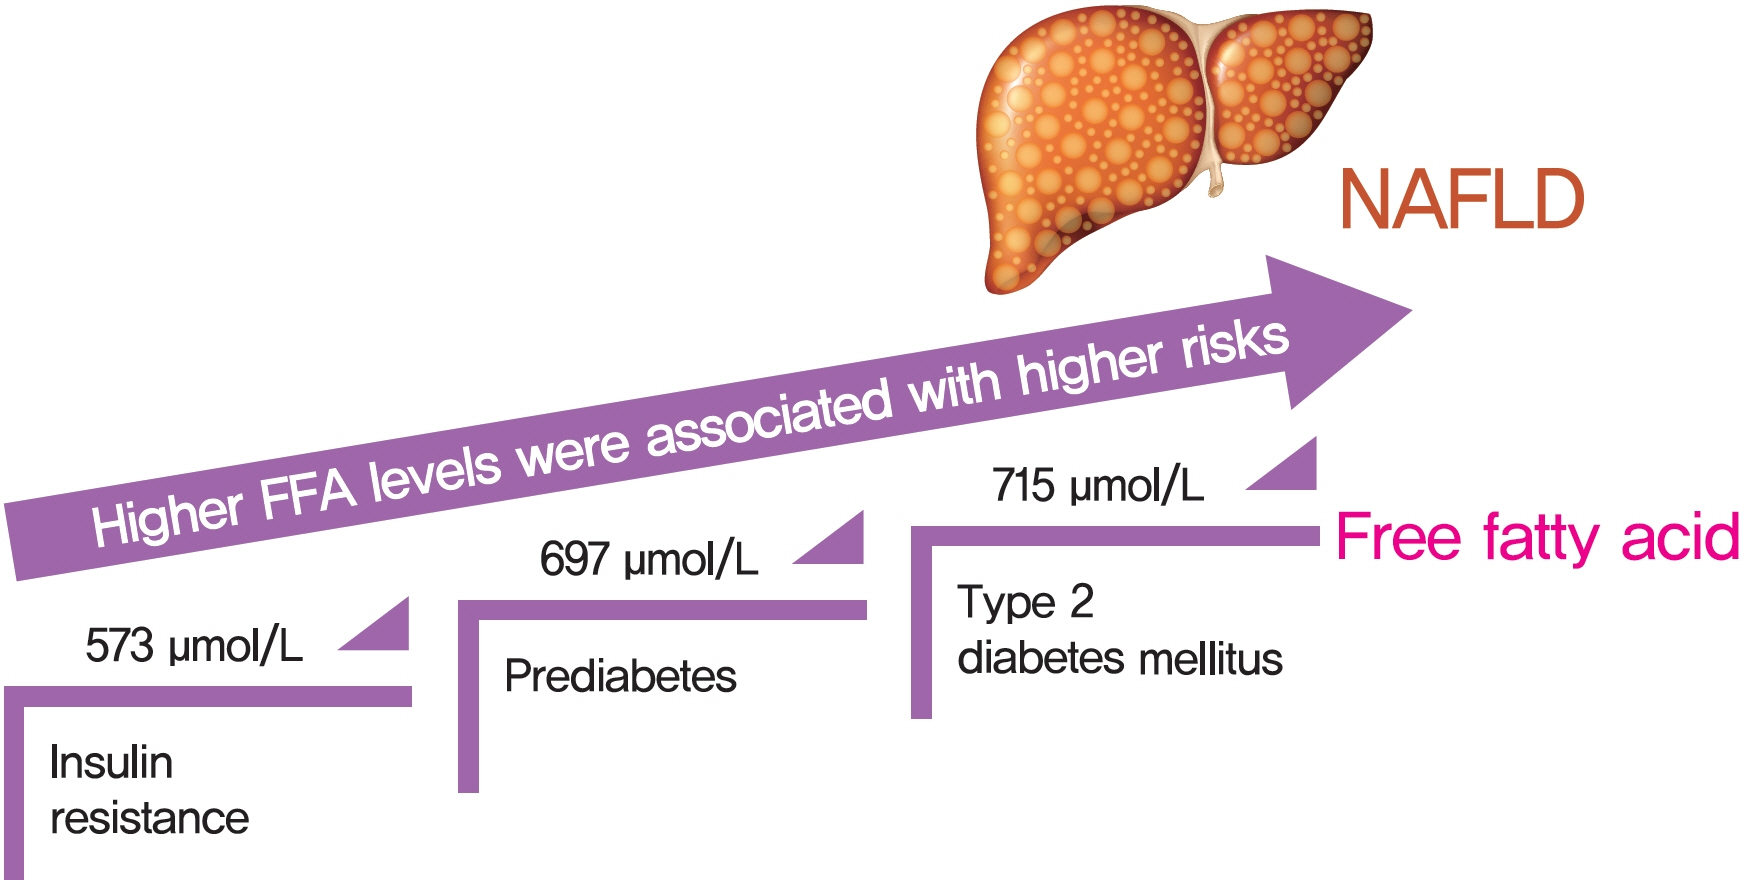
There was an approximate J-shaped relationship between FFA levels and HOMA-IR in the NAFLD group. Higher FFA concentration quartiles were associated with higher risks of IR (odds ratio [OR], 9.24; 95% confidence interval [CI], 6.43 to 13.36), prediabetes (OR, 10.48; 95% CI, 5.66 to 19.39), and type 2 diabetes mellitus (T2DM; OR, 19.43; 95% CI, 12.75 to 29.81) in the NAFLD group but not in the non-NAFLD group. The cut-off points for the FFA levels increased in a stepwise manner in discriminating IR, prediabetes and T2DM (573, 697, and 715 μmol/L) in the NAFLD group but not in non-NAFLD individuals.
Conclusion
A distinct dose-dependent relationship of FFA levels was found with IR, prediabetes and T2DM in NAFLD patients. Screening serum FFA levels in NAFLD patients would be valuable in preventing diabetes development.
Figure
-
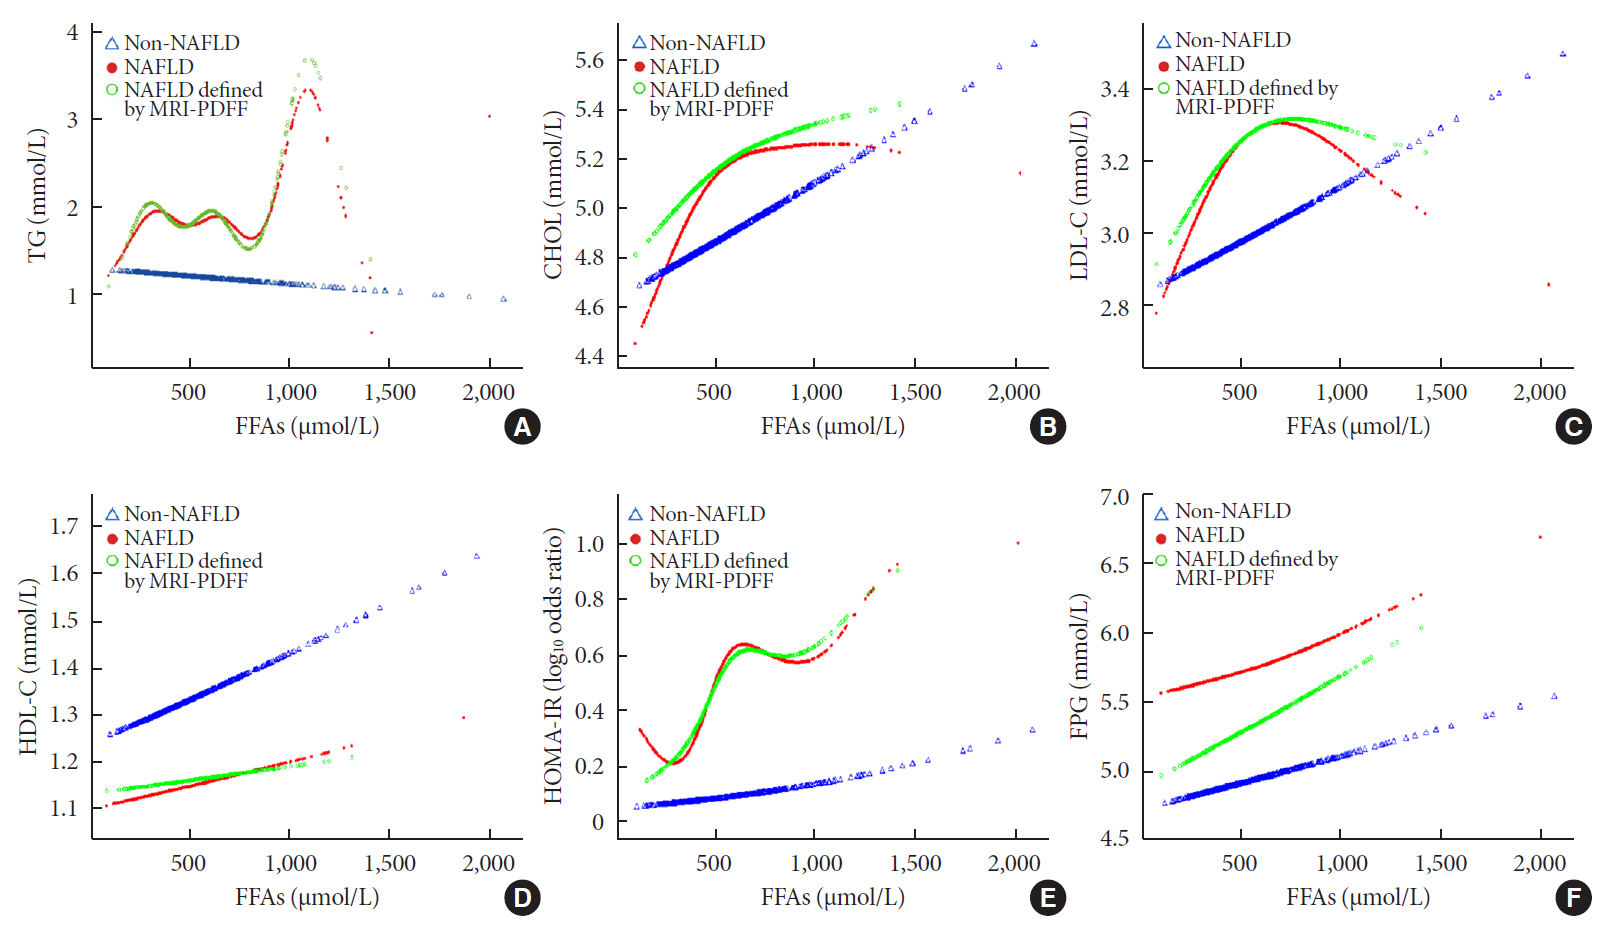
Fig. 1. Nonlinear relationships of lipid profiles, homeostasis model assessment of insulin resistance (HOMA-IR), and fasting plasma glucose levels with free fatty acids (FFAs) in non-nonalcoholic fatty liver disease (NAFLD), NAFLD and subgroup NAFLD defined by magnetic resonance imaging proton density fat fraction (MRI-PDFF) groups adjusted for age, sex, and body mass index. (A) Triglycerides (TG), (B) cholesterol (CHOL), (C) low-density lipoprotein cholesterol (LDL-C), (D) high-density lipoprotein cholesterol (HDL-C), (E) HOMA-IR, and (F) fasting plasma glucose (FPG).
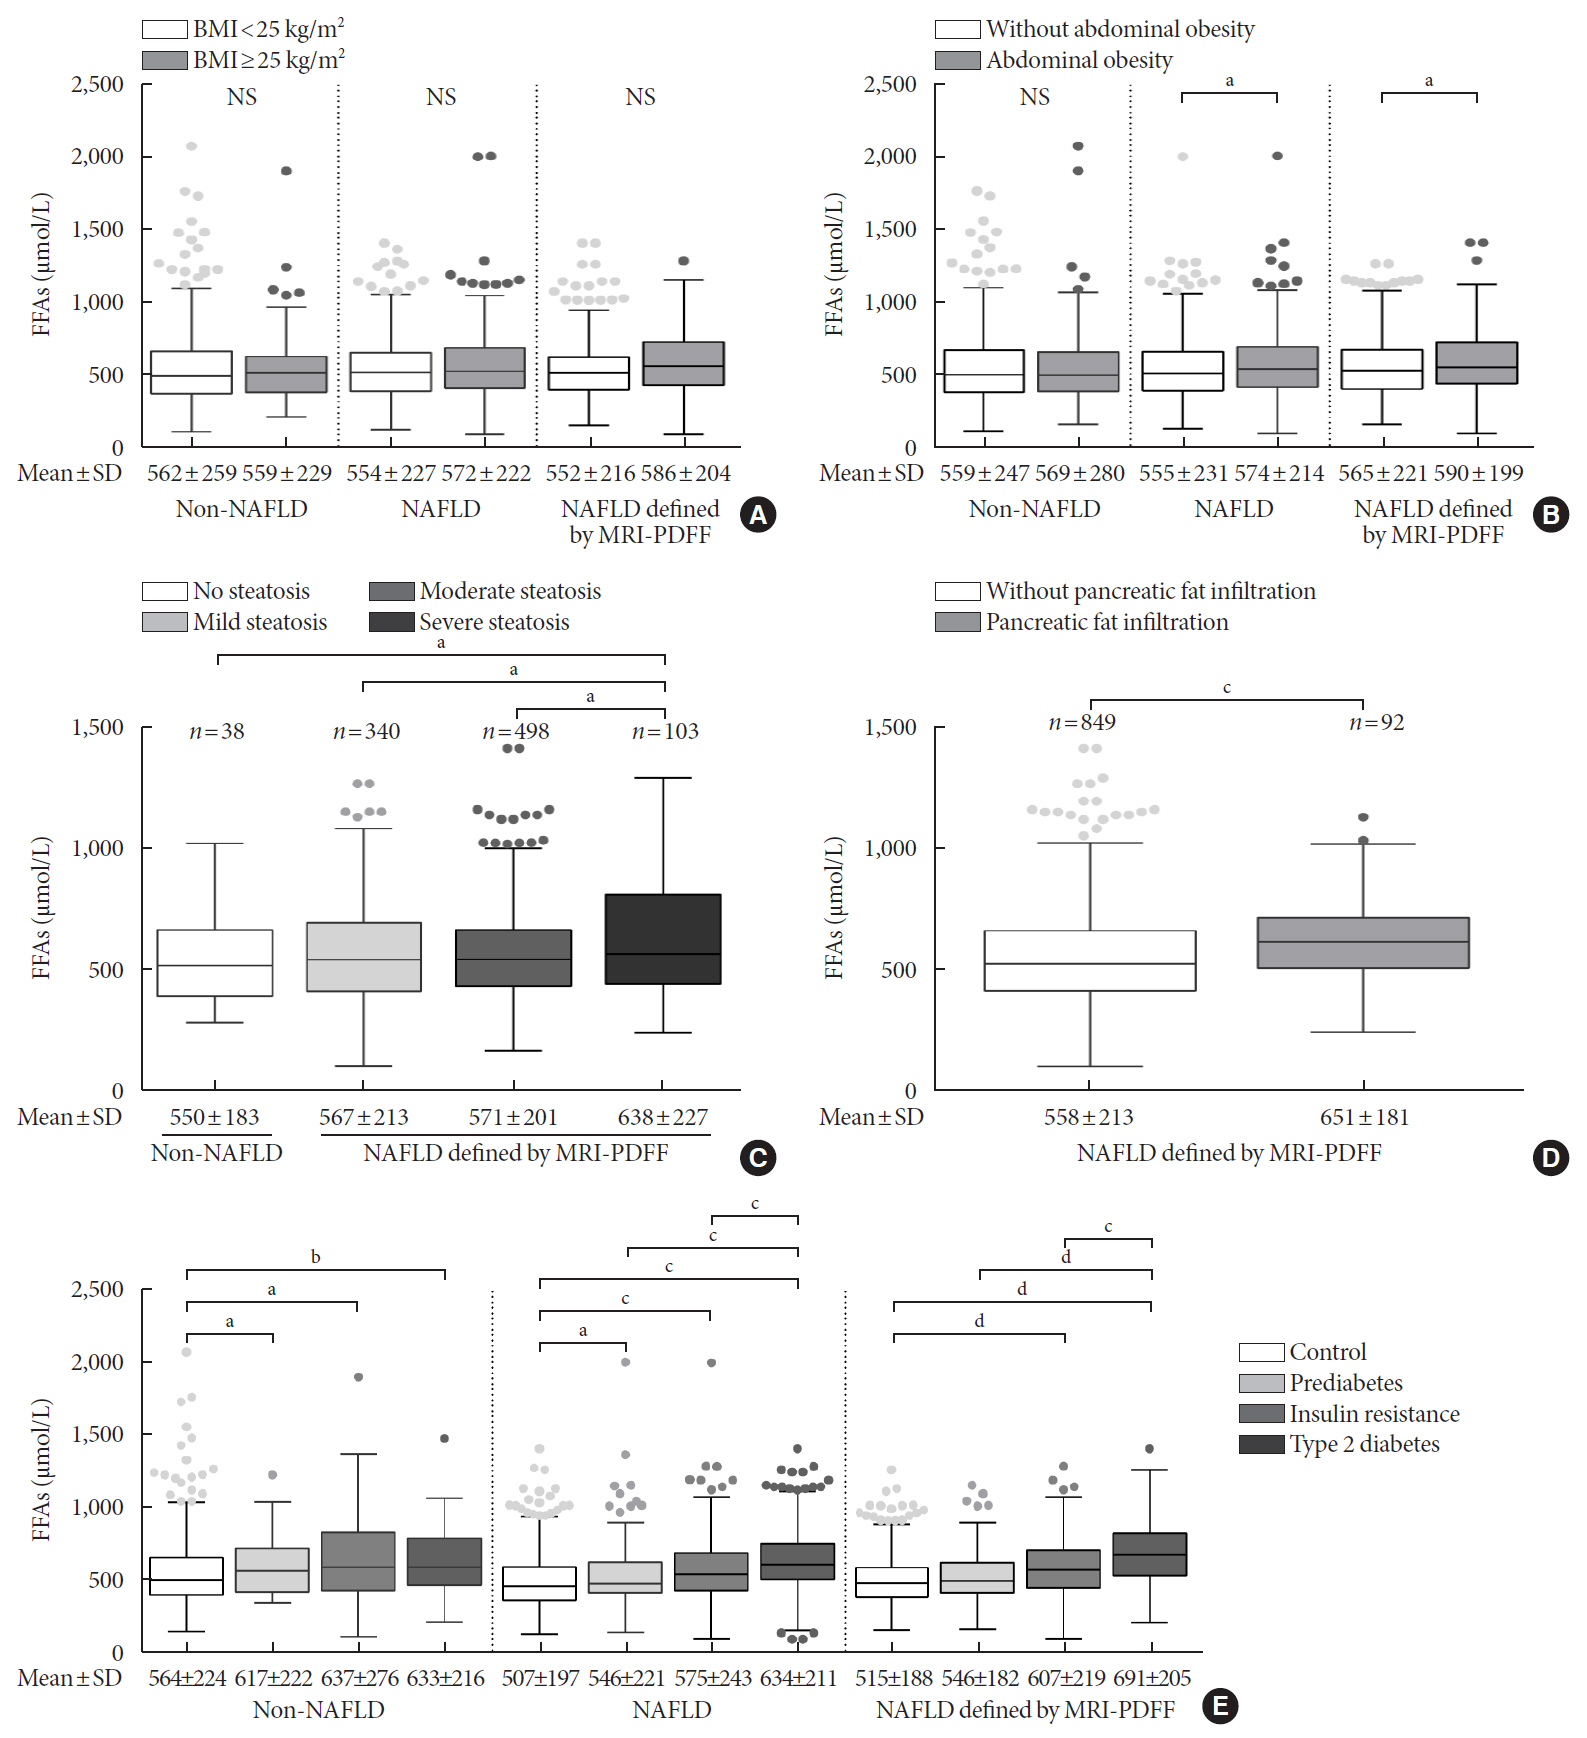
Fig. 2. Comparison of free fatty acid levels among subgroups with different body fat distribution and diabetes development. Subgroups were divided by (A) obesity, (B) abdominal obesity, (C) liver steatosis, (D) pancreatic fat infiltration, and (E) diabetes development. Obesity was defined as a body mass index (BMI) ≥25 kg/m2; abdominal obesity was defined as a waist circumference >90 cm for men and >80 cm for women; subjects was classified as absent, mild, moderate and severe steatosis based on the average liver fat content assessed using the magnetic resonance imaging proton density fat fraction (MRI-PDFF); pancreatic fat infiltration was defined as an average pancreatic fat content ≥5%, as assessed by MRI-PDFF. NAFLD, nonalcoholic fatty liver disease; FFA, free fatty acid; NS, not significant; SD, standard deviation. aP<0.05, bP<0.01, cP<0.001, dP<0.0001.
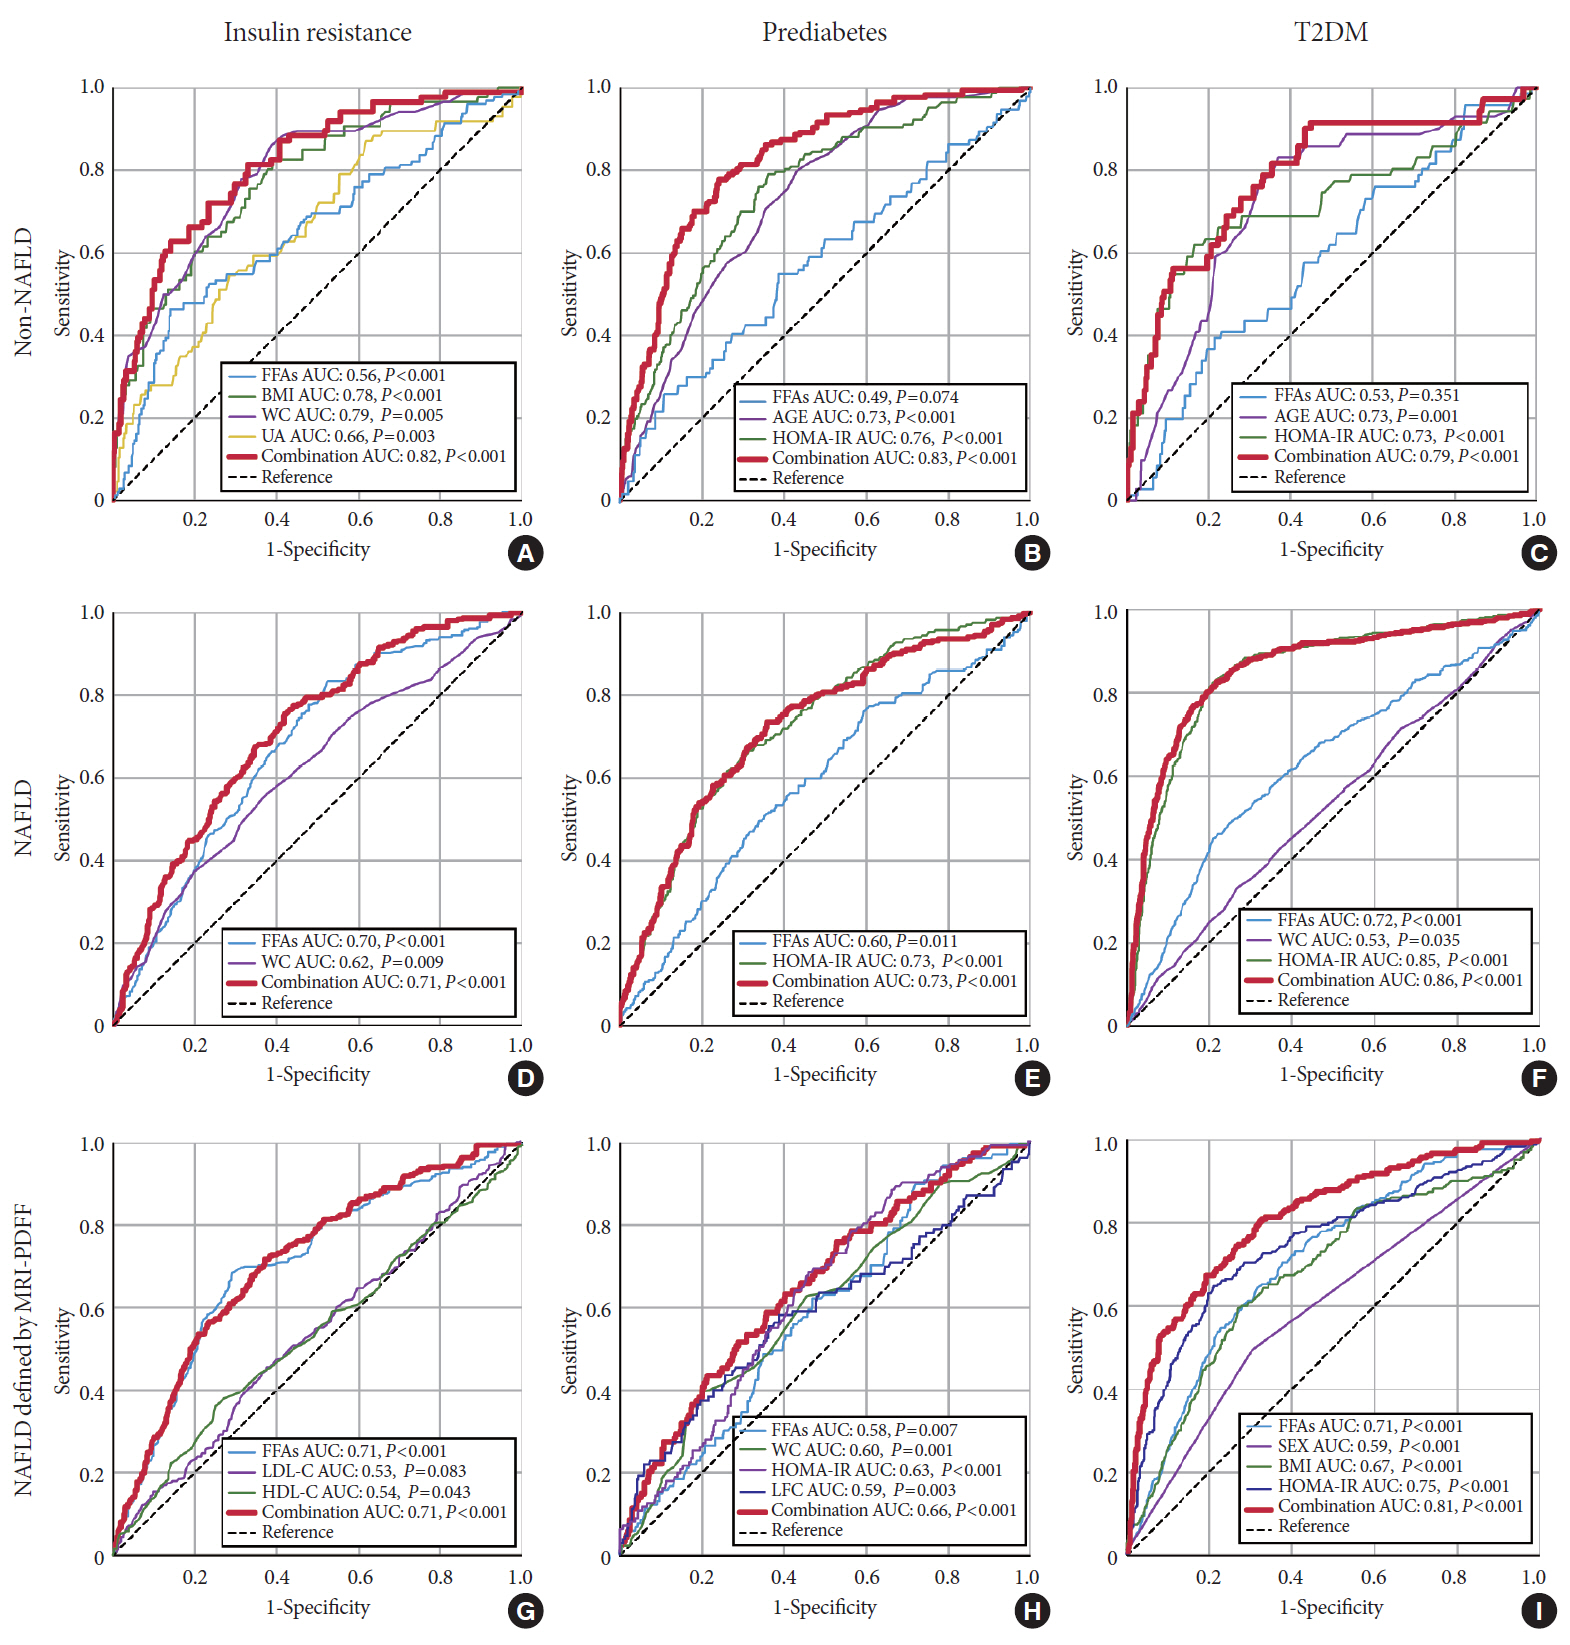
Fig. 3. Receiver operator characteristic (ROC) curve of factors for predicting insulin resistance (IR), prediabetes and type 2 diabetes mellitus (T2DM) in non-nonalcoholic fatty liver disease (NAFLD), NAFLD and subgroup NAFLD defined by magnetic resonance imaging proton density fat fraction (MRI-PDFF) groups. (A, B, C) ROC curve for predicting IR, prediabetes and T2DM in patients with non-NAFLD, (D, E, F) ROC curve for predicting IR, prediabetes and T2DM in NAFLD individuals, (G, H, I) ROC curve for predicting IR, prediabetes and T2DM in the subgroup of NAFLD defined by MRI-PDFF. FFA, free fatty acid; AUC, area under curve; BMI, body mass index; WC, waist circumference; UA, uric acid; HOMA-IR, homeostasis model assessment of insulin resistance; LDL-C, low-density lipoprotein cholesterol; HDL-C, high-density lipoprotein cholesterol; LFC, liver fat content.
Cited by 1 articles
-
Experimental model and novel therapeutic targets for non-alcoholic fatty liver disease development
Yujin Jin, Kyung-Sun Heo
Korean J Physiol Pharmacol. 2023;27(4):299-310. doi: 10.4196/kjpp.2023.27.4.299.
Reference
-
1. Younossi ZM, Koenig AB, Abdelatif D, Fazel Y, Henry L, Wymer M. Global epidemiology of nonalcoholic fatty liver disease-Meta-analytic assessment of prevalence, incidence, and outcomes. Hepatology. 2016; 64:73–84.
Article2. Younossi Z, Anstee QM, Marietti M, Hardy T, Henry L, Eslam M, et al. Global burden of NAFLD and NASH: trends, predictions, risk factors and prevention. Nat Rev Gastroenterol Hepatol. 2018; 15:11–20.
Article3. Zheng Y, Ley SH, Hu FB. Global aetiology and epidemiology of type 2 diabetes mellitus and its complications. Nat Rev Endocrinol. 2018; 14:88–98.
Article4. Adams LA, Anstee QM, Tilg H, Targher G. Non-alcoholic fatty liver disease and its relationship with cardiovascular disease and other extrahepatic diseases. Gut. 2017; 66:1138–53.
Article5. Fukuda T, Hamaguchi M, Kojima T, Hashimoto Y, Ohbora A, Kato T, et al. The impact of non-alcoholic fatty liver disease on incident type 2 diabetes mellitus in non-overweight individuals. Liver Int. 2016; 36:275–83.
Article6. Kanwal F, Kramer JR, Li L, Dai J, Natarajan Y, Yu X, et al. Effect of metabolic traits on the risk of cirrhosis and hepatocellular cancer in nonalcoholic fatty liver disease. Hepatology. 2020; 71:808–19.
Article7. Pang Y, Kartsonaki C, Turnbull I, Guo Y, Clarke R, Chen Y, et al. Diabetes, plasma glucose, and incidence of fatty liver, cirrhosis, and liver cancer: a prospective study of 0.5 million people. Hepatology. 2018; 68:1308–18.
Article8. Czech MP, Tencerova M, Pedersen DJ, Aouadi M. Insulin signalling mechanisms for triacylglycerol storage. Diabetologia. 2013; 56:949–64.
Article9. Wree A, Schlattjan M, Bechmann LP, Claudel T, Sowa JP, Stojakovic T, et al. Adipocyte cell size, free fatty acids and apolipoproteins are associated with non-alcoholic liver injury progression in severely obese patients. Metabolism. 2014; 63:1542–52.
Article10. Boden G. Role of fatty acids in the pathogenesis of insulin resistance and NIDDM. Diabetes. 1997; 46:3–10.
Article11. Leamy AK, Egnatchik RA, Young JD. Molecular mechanisms and the role of saturated fatty acids in the progression of nonalcoholic fatty liver disease. Prog Lipid Res. 2013; 52:165–74.
Article12. Fan JG, Kim SU, Wong VW. New trends on obesity and NAFLD in Asia. J Hepatol. 2017; 67:862–73.
Article13. Park S, Buranakitjaroen P, Chen CH, Chia YC, Divinagracia R, Hoshide S, et al. Expert panel consensus recommendations for home blood pressure monitoring in Asia: the Hope Asia Network. J Hum Hypertens. 2018; 32:249–58.
Article14. Xing X, Yang W, Yang Z. The diagnostic significance of homeostasis model assessment of insulin resistance in metabolic syndrome among subjects with different glucose tolerance. Chin J Diabetes. 2004; 12:182–6.15. Gastaldelli A, Gaggini M, DeFronzo RA. Role of adipose tissue insulin resistance in the natural history of type 2 diabetes: results from the San Antonio metabolism study. Diabetes. 2017; 66:815–22.
Article16. American Diabetes Association. 2. Classification and diagnosis of diabetes: standards of medical care in diabetes-2020. Diabetes Care. 2020; 43:S14–31.17. Ballestri S, Lonardo A, Romagnoli D, Carulli L, Losi L, Day CP, et al. Ultrasonographic fatty liver indicator, a novel score which rules out NASH and is correlated with metabolic parameters in NAFLD. Liver Int. 2012; 32:1242–52.
Article18. Dong Z, Luo Y, Zhang Z, Cai H, Li Y, Chan T, et al. MR quantification of total liver fat in patients with impaired glucose tolerance and healthy subjects. PLoS One. 2014; 9:e111283.
Article19. Caussy C, Alquiraish MH, Nguyen P, Hernandez C, Cepin S, Fortney LE, et al. Optimal threshold of controlled attenuation parameter with MRI-PDFF as the gold standard for the detection of hepatic steatosis. Hepatology. 2018; 67:1348–59.
Article20. Lin SC, Heba E, Wolfson T, Ang B, Gamst A, Han A, et al. Noninvasive diagnosis of nonalcoholic fatty liver disease and quantification of liver fat using a new quantitative ultrasound technique. Clin Gastroenterol Hepatol. 2015; 13:1337–45.21. Jayakumar S, Middleton MS, Lawitz EJ, Mantry PS, Caldwell SH, Arnold H, et al. Longitudinal correlations between MRE, MRI-PDFF, and liver histology in patients with non-alcoholic steatohepatitis: analysis of data from a phase II trial of selonsertib. J Hepatol. 2019; 70:133–41.
Article22. Puri P, Wiest MM, Cheung O, Mirshahi F, Sargeant C, Min HK, et al. The plasma lipidomic signature of nonalcoholic steatohepatitis. Hepatology. 2009; 50:1827–38.
Article23. Feng R, Luo C, Li C, Du S, Okekunle AP, Li Y, et al. Free fatty acids profile among lean, overweight and obese non-alcoholic fatty liver disease patients: a case-control study. Lipids Health Dis. 2017; 16:165.
Article24. Zhang J, Zhao Y, Xu C, Hong Y, Lu H, Wu J, et al. Association between serum free fatty acid levels and nonalcoholic fatty liver disease: a cross-sectional study. Sci Rep. 2014; 4:5832.
Article25. Park SS, Seo YK. Excess accumulation of lipid impairs insulin sensitivity in skeletal muscle. Int J Mol Sci. 2020; 21:1949.
Article26. VanWagner LB, Ning H, Allen NB, Siddique J, Carson AP, Bancks MP, et al. Twenty-five-year trajectories of insulin resistance and pancreatic β-cell response and diabetes risk in nonalcoholic fatty liver disease. Liver Int. 2018; 38:2069–81.
Article27. Snel M, Jonker JT, Schoones J, Lamb H, de Roos A, Pijl H, et al. Ectopic fat and insulin resistance: pathophysiology and effect of diet and lifestyle interventions. Int J Endocrinol. 2012; 2012:983814.
Article28. Karjalainen L, Pihlajamaki J, Karhapaa P, Laakso M. Impaired insulin-stimulated glucose oxidation and free fatty acid suppression in patients with familial combined hyperlipidemia: a precursor defect for dyslipidemia? Arterioscler Thromb Vasc Biol. 1998; 18:1548–53.29. Xin Y, Wang Y, Chi J, Zhu X, Zhao H, Zhao S, et al. Elevated free fatty acid level is associated with insulin-resistant state in nondiabetic Chinese people. Diabetes Metab Syndr Obes. 2019; 12:139–47.
Article
- Full Text Links
-
- Actions
-
Cited
- CITED
-
- Close
- Share
-
- Similar articles
-
- Recent update on pathogenesis of nonalcoholic fatty liver disease
- Nonalcoholic fatty liver disease: molecular mechanisms for the hepatic steatosis
- Nonalcoholic fatty liver disease: pathogenesis and treatment
- Noninvasive serum biomarkers for liver steatosis in nonalcoholic fatty liver disease: Current and future developments
- The crosstalk between insulin resistance and nonalcoholic fatty liver disease/metabolic dysfunction-associated fatty liver disease: a culprit or a consequence?
