Quantitative Assessment of Chest CT Patterns in COVID-19 and Bacterial Pneumonia Patients: a Deep Learning Perspective
- Affiliations
-
- 1Robotics Engineering, Daegu Gyeongbuk Institute of Science and Technology (DGIST), Daegu, Korea
- 2Division of Pulmonology and Allergy, Department of Internal Medicine, Regional Center for Respiratory Diseases, Yeungnam University Medical Center, College of Medicine, Yeungnam University, Daegu, Korea
- 3Department of Radiology, Seoul National University Hospital, Seoul, Korea
- KMID: 2512468
- DOI: http://doi.org/10.3346/jkms.2021.36.e46
Abstract
- Background
It is difficult to distinguish subtle differences shown in computed tomography (CT) images of coronavirus disease 2019 (COVID-19) and bacterial pneumonia patients, which often leads to an inaccurate diagnosis. It is desirable to design and evaluate interpretable feature extraction techniques to describe the patient's condition.
Methods
This is a retrospective cohort study of 170 confirmed patients with COVID-19 or bacterial pneumonia acquired at Yeungnam University Hospital in Daegu, Korea. The lung and lesion regions were segmented to crop the lesion into 2D patches to train a classifier model that could differentiate between COVID-19 and bacterial pneumonia. The K-means algorithm was used to cluster deep features extracted by the trained model into 20 groups.Each lesion patch cluster was described by a characteristic imaging term for comparison.For each CT image containing multiple lesions, a histogram of lesion types was constructed using the cluster information. Finally, a Support Vector Machine classifier was trained with the histogram and radiomics features to distinguish diseases and severity.
Results
The 20 clusters constructed from 170 patients were reviewed based on common radiographic appearance types. Two clusters showed typical findings of COVID-19, with two other clusters showing typical findings related to bacterial pneumonia. Notably, there is one cluster that showed bilateral diffuse ground-glass opacities (GGOs) in the central and peripheral lungs and was considered to be a key factor for severity classification. The proposed method achieved an accuracy of 91.2% for classifying COVID-19 and bacterial pneumonia patients with 95% reported for severity classification. The CT quantitative parameters represented by the values of cluster 8 were correlated with existing laboratory data and clinical parameters.
Conclusion
Deep chest CT analysis with constructed lesion clusters revealed well-known COVID-19 CT manifestations comparable to manual CT analysis. The constructed histogram features improved accuracy for both diseases and severity classification, and showed correlations with laboratory data and clinical parameters. The constructed histogram features can provide guidance for improved analysis and treatment of COVID-19.
Figure
-
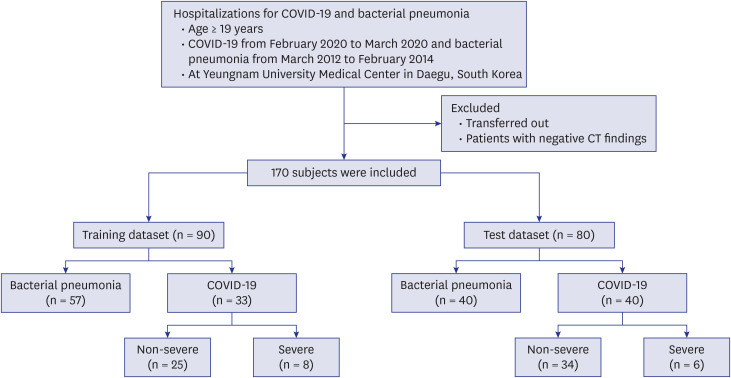
Fig. 1 Flow chart.COVID-19 = coronavirus disease 2019, CT = computed tomography.
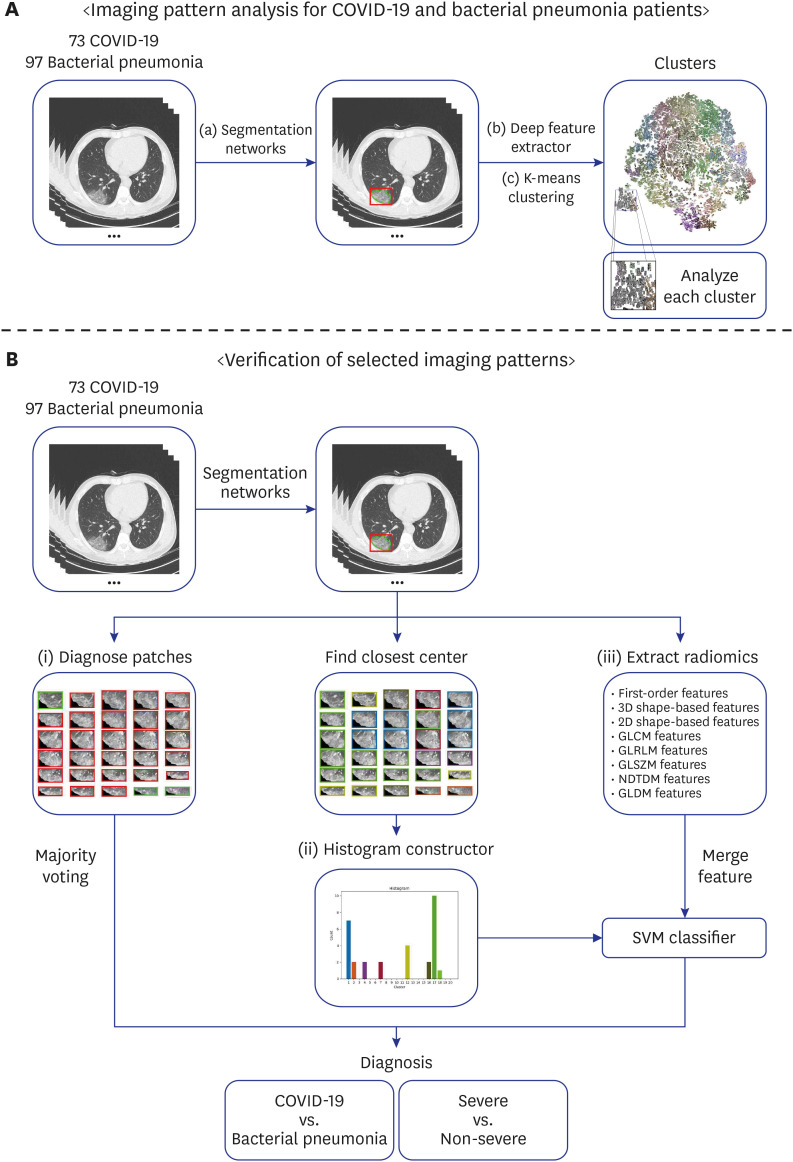
Fig. 2 Diagram of the modeling framework. For analyzing the imaging patterns, the segmentation models were employed to extract regions of interest of the lung and lesions in the chest CT scans. Then, the ResNet50 model takes lesion cropped patches as input and returns a label prediction and a 2048-dimensional feature vector. Next, the K-means clustering algorithm was used to cluster 2D lesion features into 20 groups. To verify the usability of these patterns, (i) majority voting; (ii) constructed histogram with SVM; and (iii) Radiomics features (with/without constructed histogram) with SVM were employed. Disease and severity classification tasks were performed.COVID-19 = coronavirus disease 2019, CT = computed tomography, SVM = Support Vector Machine.

Fig. 3 Visualization of the lesion patches from 170 patients into two-dimensions. (A) K-means clusters (20 groups) were used for distinction. Different color edge represents different groups. (B) True diagnosis was used for distinction. Purple color represents non-severe COVID-19, magenta represents severe COVID-19, and green for bacterial pneumonia.COVID-19 = coronavirus disease 2019.
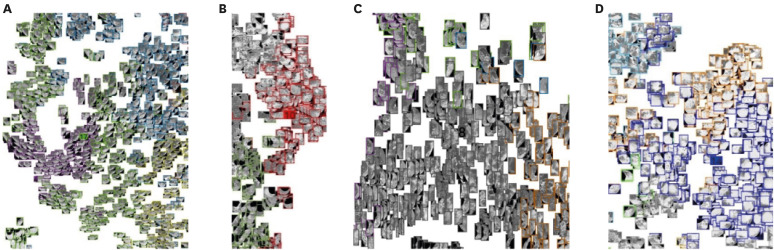
Fig. 4 (A) Typical COVID-19 CT manifestations—GGOs with interlobular septal thickening in the peripheral lungs—were observed in cluster 4 and 17. (B) bacterial pneumonia CT manifestation—crazy-paving appearance in the posterior lungs—observed in cluster 5 and 10. (C) Cluster 8 showed the lowest t-test P value < 0.001 for diseased and severe groups which is the typical pattern for severe COVID-19 patients (i.e., diffuse GGOs in the central and peripheral lungs). (D) Bacterial pneumonia CT manifestation—extensive consolidation with air-bronchogram—was observed in cluster 14. These clusters showed a t-test P value < 0.001. Lesions were colored based on K-means clustering result.COVID-19 = coronavirus disease 2019, CT = computed tomography, GGO = ground-glass opacity.
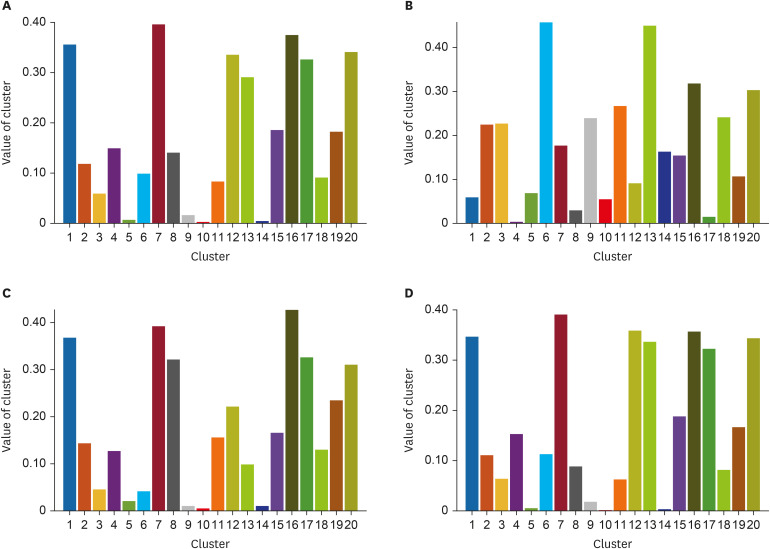
Fig. 5 Mean histograms. (A) Mean histogram of COVID-19; (B) Mean histogram of bacterial pneumonia; (C) Mean histogram of severe COVID-19 patients; and (D) Mean histogram of non-severe COVID-19 patients.COVID-19 = coronavirus disease 2019.

Fig. 6 Representative slices which showed an average dice coefficient score (78.06%) for lesion segmentation. (A) Slice showed a dice coefficient score of 77.08%. (B) Slice showed a dice coefficient score of 78.31%. Red color represents a manual segmentation by human and green color represents an automated segmentation by the trained segmentation model. Due to the ambiguity of lesion boundaries, an average dice score of 78.06% showed satisfactory lesion segmentation results for the deep feature extractor.
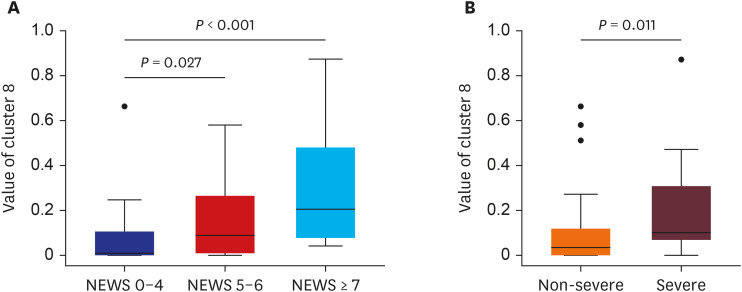
Fig. 7 Comparisons between values of cluster 8 versus NEWS (A) and disease severity (B) in COVID-19 patients.NEWS = National Early Warning Score, COVID-19 = coronavirus disease 2019.
Cited by 1 articles
-
A Retrospective Clinical Evaluation of an Artificial Intelligence Screening Method for Early Detection of STEMI in the Emergency Department
Dongsung Kim, Ji Eun Hwang, Youngjin Cho, Hyoung-Won Cho, Wonjae Lee, Ji Hyun Lee, Il-Young Oh, Sumin Baek, Eunkyoung Lee, Joonghee Kim
J Korean Med Sci. 2022;37(10):e81. doi: 10.3346/jkms.2022.37.e81.
Reference
-
1. Guan WJ, Ni ZY, Hu Y, Liang WH, Ou CQ, He JX, et al. Clinical characteristics of coronavirus disease 2019 in China. N Engl J Med. 2020; 382(18):1708–1720. PMID: 32109013.2. Xie X, Zhong Z, Zhao W, Zheng C, Wang F, Liu J. Chest CT for typical coronavirus disease 2019 (COVID-19) pneumonia: relationship to negative RT-PCR testing. Radiology. 2020; 296(2):E41–5. PMID: 32049601.3. Huang P, Liu T, Huang L, Liu H, Lei M, Xu W, et al. Use of chest CT in combination with negative RT-PCR assay for the 2019 novel coronavirus but high clinical suspicion. Radiology. 2020; 295(1):22–23. PMID: 32049600.4. Fang Y, Zhang H, Xie J, Lin M, Ying L, Pang P, et al. Sensitivity of chest CT for COVID-19: comparison to RT-PCR. Radiology. 2020; 296(2):E115–7. PMID: 32073353.5. Song F, Shi N, Shan F, Zhang Z, Shen J, Lu H, et al. Emerging 2019 novel coronavirus (2019-nCoV) pneumonia. Radiology. 2020; 295(1):210–217. PMID: 32027573.
Article6. Salehi S, Abedi A, Balakrishnan S, Gholamrezanezhad A. Coronavirus disease 2019 (COVID-19): a systematic review of imaging findings in 919 patients. AJR Am J Roentgenol. 2020; 215(1):87–93. PMID: 32174129.
Article7. Zhou S, Wang Y, Zhu T, Xia L. CT features of coronavirus disease 2019 (COVID-19) pneumonia in 62 patients in Wuhan, China. AJR Am J Roentgenol. 2020; 214(6):1287–1294. PMID: 32134681.
Article8. Bai HX, Hsieh B, Xiong Z, Halsey K, Choi JW, Tran TM, et al. Performance of radiologists in differentiating COVID-19 from viral pneumonia on chest CT. Radiology. 2020; 296(2):E46–54. PMID: 32155105.9. Choi H, Qi X, Yoon SH, Park SJ, Lee KH, Kim JY, et al. Extension of coronavirus disease 2019 on chest CT and implications for chest radiographic interpretation. Radiol Cardiothorac Imaging. 2020; 2(2):e200107.
Article10. Hansell DM, Bankier AA, MacMahon H, McLoud TC, Müller NL, Remy J. Fleischner Society: glossary of terms for thoracic imaging. Radiology. 2008; 246(3):697–722. PMID: 18195376.
Article11. Litjens G, Kooi T, Bejnordi BE, Setio AA, Ciompi F, Ghafoorian M, et al. A survey on deep learning in medical image analysis. Med Image Anal. 2017; 42:60–88. PMID: 28778026.
Article12. ARDS Definition Task Force, Ranieri VM, Rubenfeld GD, Thompson BT, Ferguson ND, Caldwell E, et al. Acute respiratory distress syndrome: the Berlin Definition. JAMA. 2012; 307(23):2526–2533. PMID: 22797452.13. Jang JG, Hur J, Hong KS, Lee W, Ahn JH. Prognostic accuracy of the SIRS, qSOFA, and NEWS for early detection of clinical deterioration in SARS-CoV-2 infected patients. J Korean Med Sci. 2020; 35(25):e234. PMID: 32597046.
Article14. Hong KS, Lee KH, Chung JH, Shin KC, Choi EY, Jin HJ, et al. Clinical features and outcomes of 98 patients hospitalized with SARS-CoV-2 infection in Daegu, South Korea: a brief descriptive study. Yonsei Med J. 2020; 61(5):431–437. PMID: 32390367.
Article15. Zhang H, Wu C, Zhang Z, Zhu Y, Zhang Z, Lin H, et al. ResNeSt: split-attention networks. arXiv. Forthcoming. 2020.16. Dai J, Qi H, Xiong Y, Li Y, Zhang G, Hu H, et al. Deformable convolutional networks. In : Proceedings of 2017 IEEE International Conference on Computer Vision (ICCV); 2017 Oct 22-29; Venice, Italy. Piscataway, NJ: Institute of Electrical and Electronics Engineers;2017. p. 764–773. DOI: 10.1109/ICCV.2017.89.17. Aerts HJ, Velazquez ER, Leijenaar RT, Parmar C, Grossmann P, Carvalho S, et al. Decoding tumour phenotype by noninvasive imaging using a quantitative radiomics approach. Nat Commun. 2014; 5(1):4006. PMID: 24892406.
Article18. Jun M, Cheng G, Yixin W, Xingle A, Jiantao G, Ziqi Y, et al. COVID-19 CT lung and infection segmentation dataset. Zenodo. Forthcoming. 2020; DOI: 10.5281/zenodo.3757476.19. Morozov SP, Andreychenko AE, Pavlov NA, Vladzymyrskyy AV, Ledikhova NV, Gombolevskiy VA, et al. MosMedData: chest CT scans with COVID-19 related findings dataset. medRxiv. Forthcoming. 2020; DOI: 10.1101/2020.05.20.20100362.
Article20. Simpson AL, Antonelli M, Bakas S, Bilello M, Farahani K, van Ginneken B, et al. A large annotated medical image dataset for the development and evaluation of segmentation algorithms. arXiv. Forthcoming. 2020.21. He K, Zhang X, Ren S, Sun J. Deep residual learning for image recognition. In : Proceedings of 2016 IEEE Conference on Computer Vision and Pattern Recognition (CVPR); 2016 Jun 27-30; Las Vegas, NV. Piscataway, NJ: Institute of Electrical and Electronics Engineers;2016. p. 770–778. DOI: 10.1109/CVPR.2016.90.22. Lloyd S. Least squares quantization in PCM. IEEE Trans Inf Theory. 1982; 28(2):129–137.
Article23. Lvd M, Hinton G. Visualizing data using t-SNE. J Mach Learn Res. 2008; 9(86):2579–2605.24. Chung M, Bernheim A, Mei X, Zhang N, Huang M, Zeng X, et al. CT imaging features of 2019 novel coronavirus (2019-nCoV). Radiology. 2020; 295(1):202–207. PMID: 32017661.25. Caruso D, Zerunian M, Polici M, Pucciarelli F, Polidori T, Rucci C, et al. Chest CT features of COVID-19 in Rome, Italy. Radiology. 2020; 296(2):E79–85. PMID: 32243238.
Article26. Pan Y, Guan H, Zhou S, Wang Y, Li Q, Zhu T, et al. Initial CT findings and temporal changes in patients with the novel coronavirus pneumonia (2019-nCoV): a study of 63 patients in Wuhan, China. Eur Radiol. 2020; 30(6):3306–3309. PMID: 32055945.
Article27. Qi X, Jiang Z, Yu Q, Shao C, Zhang H, Yue H, et al. Machine learning-based CT radiomics model for predicting hospital stay in patients with pneumonia associated with SARS-CoV-2 infection: a multicenter study. medRxiv. Forthcoming. 2020; DOI: 10.21037/atm-20-3026.
Article28. Nishino M. Perinodular radiomic features to assess nodule microenvironment: does it help to distinguish malignant versus benign lung nodules? Radiology. 2019; 290(3):793–795. PMID: 30561277.
Article29. Li L, Qin L, Xu Z, Yin Y, Wang X, Kong B, et al. Using artificial intelligence to detect COVID-19 and community-acquired pneumonia based on pulmonary CT: evaluation of the diagnostic accuracy. Radiology. 2020; 296(2):E65–E71. PMID: 32191588.
- Full Text Links
-
- Actions
-
Cited
- CITED
-
- Close
- Share
-
- Similar articles
-
- Implementation of a Deep Learning-Based ComputerAided Detection System for the Interpretation of Chest Radiographs in Patients Suspected for COVID-19
- Application of deep learning algorithm to detect COVID-19 pneumonia in chest X-ray
- Pulmonary Contusion Similar to COVID-19 Pneumonia
- Clinical and Radiologic Findings of COVID-19 Pneumonia: South Korean Experience from Three Cases
- Role of chest imaging in the diagnosis and treatment of COVID-19
