Spatio-temporal Analysis of Districtlevel Life Expectancy from 2004 to 2017 in Korea
- Affiliations
-
- 1Institute of Health Policy and Management, Seoul National University Medical Research Center, Seoul, Korea
- 2Department of Health Policy and Management, Seoul National University College of Medicine, Seoul, Korea
- 3Department of Health Policy and Management, Jeju National University College of Medicine and Graduate School of Medicine, Jeju, Korea
- KMID: 2510595
- DOI: http://doi.org/10.3346/jkms.2021.36.e8
Abstract
- Background
Health indicators, such as mortality rates or life expectancy, need to be presented at the local level to improve the health of local residents and to reduce health inequality across geographic areas. The aim of this study was to estimate life expectancy at the district level in Korea through a spatio-temporal analysis.
Methods
Spatio-temporal models were applied to the National Health Information Database of the National Health Insurance Service to estimate the mortality rates for 19 age groups in 250 districts from 2004 to 2017 by gender in Korea. Annual district-level life tables by gender were constructed using the estimated mortality rates, and then annual district-level life expectancy by gender was estimated using the life table method and the Kannisto-Thatcher method. The annual district-level life expectancies based on the spatio-temporal models were compared to the life expectancies calculated under the assumption that the mortality rates in these 250 districts are independent from one another.
Results
In 2017, district-level life expectancy at birth ranged from 75.5 years (95% credible interval [CI], 74.0–77.0 years) to 84.2 years (95% CI, 83.4–85.0 years) for men and from 83.9 years (95% CI, 83.2–84.6 years) to 88.2 years (95% CI, 87.3–89.1 years) for women.Between 2004 and 2017, district-level life expectancy at birth increased by 4.57 years (95% CI, 4.49–4.65 years) for men and by 4.06 years (95% CI, 3.99–4.12 years) for women. To obtain stable annual life expectancy estimates at the district level, it is recommended to use the life expectancy based on spatio-temporal models instead of calculating life expectancy using observed mortality.
Conclusion
In this study, we estimated the annual district-level life expectancy from 2004 to 2017 in Korea by gender using a spatio-temporal model. Local governments could use annual district-level life expectancy estimates as a performance indicator of health policies to improve the health of local residents. The approach to district-level analysis with spatiotemporal modeling employed in this study could be used in future analyses to produce district-level health-related indicators in Korea.
Keyword
Figure
-
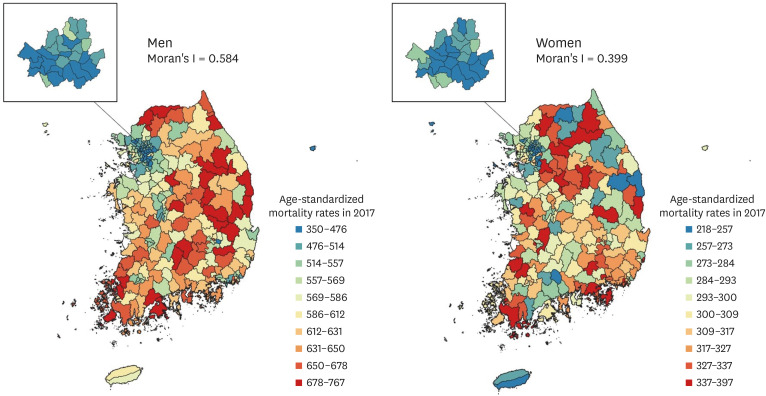
Fig. 1 Age-standardized mortality rates per 100,000 population in 250 districts for men (left) and women (right) in Korea, 2017, shown in 10 color groups with ranges for the categories determined by the deciles of age-standardized mortality rates per 100,000 population.
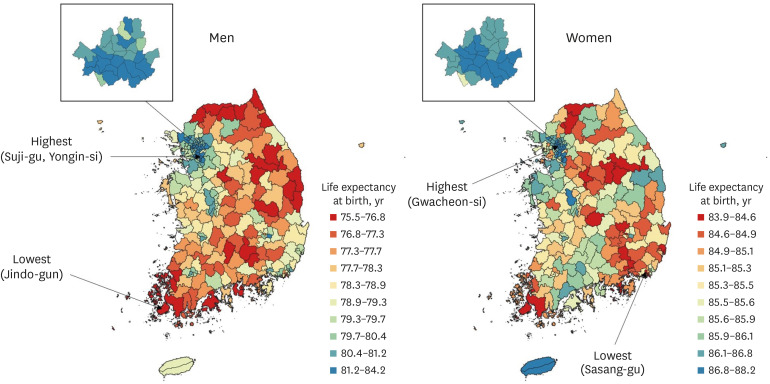
Fig. 2 Life expectancy at birth in 250 districts for men (left) and women (right) in Korea, 2017, shown in 10 color groups with ranges for the categories determined by the deciles of life expectancy at birth.
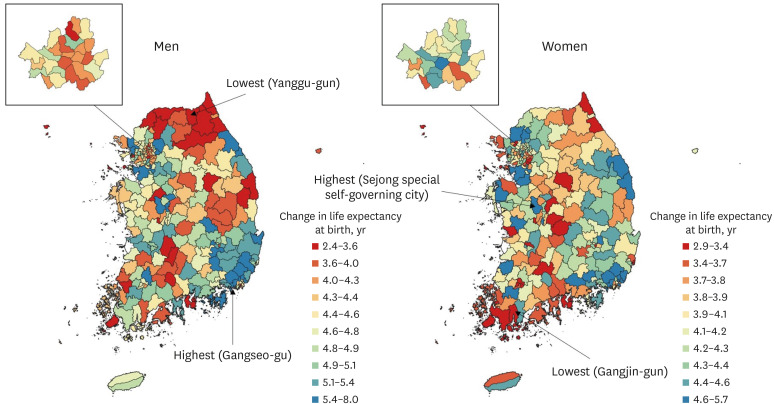
Fig. 3 Change in life expectancy at birth in 250 districts between 2004 and 2017 for men (left) and women (right) in Korea, shown in 10 color groups with ranges for the categories determined by the deciles of changes in life expectancy at birth.
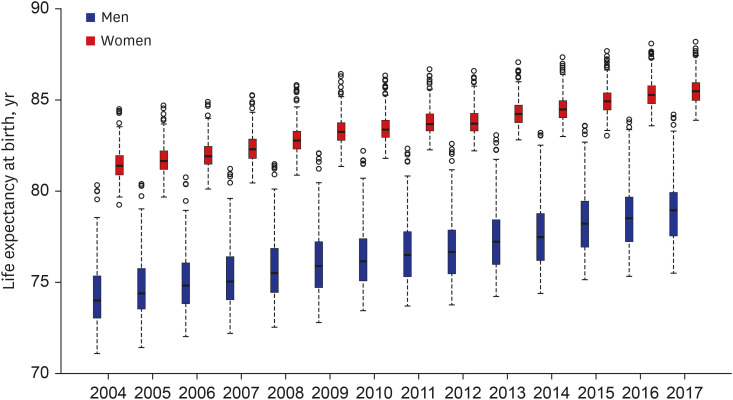
Fig. 4 Distribution of life expectancy at birth in 250 districts from 2004 to 2017 by gender in Korea; the bottom border, middle line, and top border of the boxes indicate the 25th, 50th, and 75th percentiles, respectively, across all districts; the dashed lines (whiskers) represent the full range across districts except outliers; and circles (outliers) represent the observations with the highest or lowest life expectancy at birth.
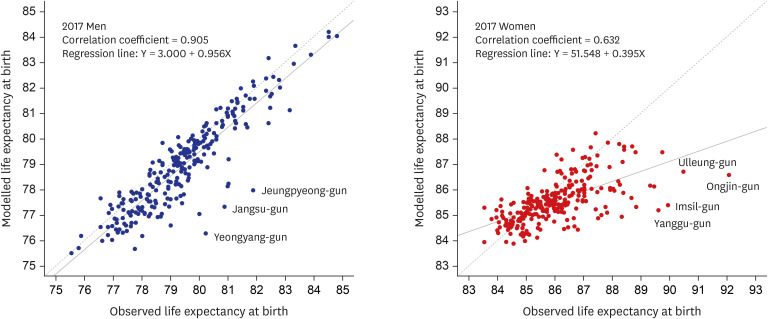
Fig. 5 Comparison of the life expectancy at birth calculated from observed mortality rates (x-axis) and the life expectancy at birth based on the spatio-temporal model (y-axis) in 2017; the solid lines represent the fitted regression lines and the dashed lines represent the straight lines with slope 1.
Cited by 1 articles
-
Cancer-free Life Expectancy in Small Administrative Areas in Korea and Its Associations with Regional Health Insurance Premiums
Eunjeong Noh, Hee-Yeon Kang, Jinwook Bahk, Ikhan Kim, Young-Ho Khang
J Korean Med Sci. 2021;36(42):e269. doi: 10.3346/jkms.2021.36.e269.
Reference
-
1. Korea Health Promotion Institute. Guideline for establishment of the 7th local healthcare plan. Updated 2018. Accessed February 15, 2020. http://www.khealth.or.kr/kps/publish/view?menuId=MENU00890&page_no=B2017003&pageNum=1&siteId=&srch_text=&srch_cate=28&srch_type=ALL&str_clft_cd_list=&str_clft_cd_type_list=&board_idx=10127.2. Seong SC, Kim YY, Khang YH, Heon Park J, Kang HJ, Lee H, et al. Data resource profile: the national health information database of the national health insurance service in South Korea. Int J Epidemiol. 2017; 46(3):799–800. PMID: 27794523.3. Bahk J, Kim YY, Kang HY, Lee J, Kim I, Lee J, et al. Using the National Health Information Database of the National Health Insurance Service in Korea for monitoring mortality and life expectancy at national and local levels. J Korean Med Sci. 2017; 32(11):1764–1770. PMID: 28960027.
Article4. Kim I, Lim HK, Kang HY, Khang YH. Comparison of three small-area mortality metrics according to urbanity in Korea: the standardized mortality ratio, comparative mortality figure, and life expectancy. Popul Health Metr. 2020; 18(1):3. PMID: 32620133.
Article5. Lim D, Bahk J, Ock M, Kim I, Kang HY, Kim YY, et al. Income-related inequality in quality-adjusted life expectancy in Korea at the national and district levels. Health Qual Life Outcomes. 2020; 18(1):45. PMID: 32103763.
Article6. Bahk J, Kang HY, Khang YH. Life expectancy and inequalities therein by income from 2016 to 2018 across the 253 electoral constituencies of the National Assembly of the Republic of Korea. J Prev Med Public Health. 2020; 53(2):143–148.7. Khang YH, Lim D, Bahk J, Kim I, Kang HY, Chang Y, et al. A publicly well-accepted measure versus an academically desirable measure of health inequality: cross-sectional comparison of the difference between income quintiles with the slope index of inequality. BMJ Open. 2019; 9(6):e028687.
Article8. Kim I, Bahk J, Yun SC, Khang YH. Income gaps in self-rated poor health and its association with life expectancy in 245 districts of Korea. Epidemiol Health. 2017; 39:e2017011. PMID: 28330335.
Article9. Eayres D, Williams ES. Evaluation of methodologies for small area life expectancy estimation. J Epidemiol Community Health. 2004; 58(3):243–249. PMID: 14966240.
Article10. Bennett JE, Li G, Foreman K, Best N, Kontis V, Pearson C, et al. The future of life expectancy and life expectancy inequalities in England and Wales: Bayesian spatiotemporal forecasting. Lancet. 2015; 386(9989):163–170. PMID: 25935825.
Article11. Bennett JE, Pearson-Stuttard J, Kontis V, Capewell S, Wolfe I, Ezzati M. Contributions of diseases and injuries to widening life expectancy inequalities in England from 2001 to 2016: a population-based analysis of vital registration data. Lancet Public Health. 2018; 3(12):e586–97. PMID: 30473483.
Article12. Dwyer-Lindgren L, Bertozzi-Villa A, Stubbs RW, Morozoff C, Kutz MJ, Huynh C, et al. US county-level trends in mortality rates for major causes of death, 1980–2014. JAMA. 2016; 316(22):2385–2401. PMID: 27959996.
Article13. Dwyer-Lindgren L, Stubbs RW, Bertozzi-Villa A, Morozoff C, Callender C, Finegold SB, et al. Variation in life expectancy and mortality by cause among neighbourhoods in King County, WA, USA, 1990–2014: a census tract-level analysis for the Global Burden of Disease Study 2015. Lancet Public Health. 2017; 2(9):e400–10. PMID: 29253411.
Article14. Dwyer-Lindgren L, Bertozzi-Villa A, Stubbs RW, Morozoff C, Mackenbach JP, van Lenthe FJ, et al. Inequalities in life expectancy among US Counties, 1980 to 2014: temporal trends and key drivers. JAMA Intern Med. 2017; 177(7):1003–1011. PMID: 28492829.15. Moran PA. Notes on continuous stochastic phenomena. Biometrika. 1950; 37(1-2):17–23. PMID: 15420245.
Article16. Leroux BG, Lei X, Breslow N. Estimation of disease rates in small areas: a new mixed model for spatial dependence. Statistical Models in Epidemiology, the Environment, and Clinical Trials. New York, NY: Springer-Verlag;2000. p. 179–191.17. Knorr-Held L. Bayesian modelling of inseparable space-time variation in disease risk. Stat Med. 2000; 19(17-18):2555–2567. PMID: 10960871.
Article18. Thatcher AR, Kannisto V, Vaupel JW. The Force of Mortality at Ages 80 to 120. Odense, Denmark: Odense University Press;1998.19. Khang YH, Hwang IA, Yun SC, Lee MS, Lee SI, Jo MW, et al. Census population vs. registration population: which population denominator should be used to calculate geographical mortality. J Prev Med Public Health. 2005; 38(2):147–153. PMID: 16315751.20. Khang YH, Yoon SC, Bahk JW, Kang HY, Kim I, Seo SB, et al. Developing indicators for evaluating and monitoring the Health Plan 2020 using the National Health Information Database of the National Health Insurance Service in Korea. National Health Insurance Service & Seoul National University R&DB Foundation;2016. Updated 2016. Accessed March 20, 2020. http://lib.nhis.or.kr/search/detail/CATXBZ000000031459?briefLink=/searchA/xbz?bk_2=jttj2016jttj.21. Choi MH, Yoon TH. Trends in amenable mortality to health care across the districts in Korea from 1993 to 2013. J Crit Soc Welfare. 2015; (49): 404– 432.22. Khang YH. Monthly Community Health Report. Geographic health inequalities: time trends in mortality indicators and future research agenda. Updated October 2019. Accessed March 20, 2020. https://chs.cdc.go.kr/chs/hd/hdMain.do.23. Khang YH, Bahk J, Lim D, Kang HY, Lim HK, Kim YY, et al. Trends in inequality in life expectancy at birth between 2004 and 2017 and projections for 2030 in Korea: multiyear cross-sectional differences by income from national health insurance data. BMJ Open. 2019; 9(7):e030683.
Article
- Full Text Links
-
- Actions
-
Cited
- CITED
-
- Close
- Share
-
- Similar articles
-
- A Systematic Review of Spatial and Spatio-temporal Analyses in Public Health Research in Korea
- Spatio-Temporal Pattern Analysis in EEG of Alzheimer's Dementia: A Preliminary Report Using Karhunen-Loeve Method for Clinical Implication
- Life Expectancy of The Posttraumatic Persistent Vegetative State: Review of Literature and A Proposal
- Life Expectancy in Areas around Subway Stations in the Seoul Metropolitan Area in Korea, 2008–2017
- An Expert Opinion on the Life Expectancy after Traumatic Brain Injury
