Theory and Practice of Meta-Analysis
- Affiliations
-
- 1Department of Otorhinolaryngology-Head and Neck Surgery, College of Medicine, Konkuk University, Seoul, Korea
- KMID: 2508951
- DOI: http://doi.org/10.18787/jr.2020.00320
Abstract
- Decisions about the utility of an intervention or the validity of a hypothesis should not be based on results of a single study, because different studies provide different results. Hence, a data synthesizing mechanism is required. Meta-analysis is the statistical procedure for combining data from multiple studies. When the treatment effect is consistent across different studies, metaanalysis can identify the common effect. When the treatment effect varies in studies, meta-analysis may identify reasons for variations. Meta-analysis is a powerful tool, though awareness of its limitations and possible errors for correct application are essential.
Figure
-
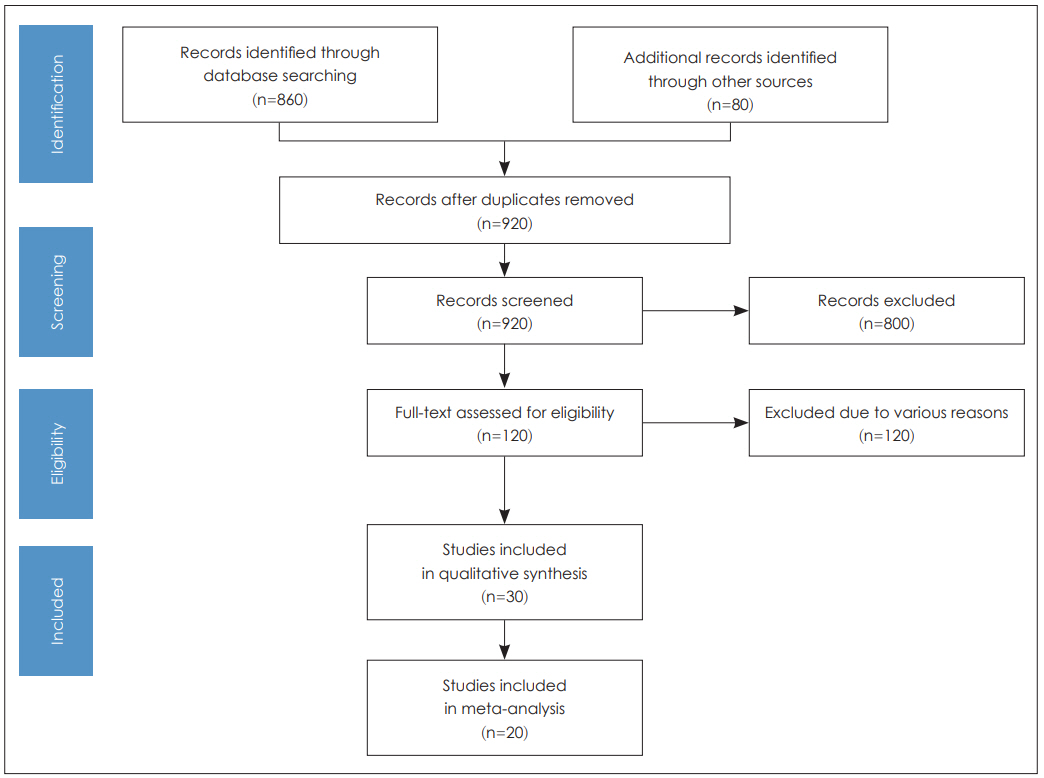
Fig. 1. PRISMA flowchart example.

Fig. 2. Forest plot example. In Study 1, since the position of the square is located below 0 and the range of the horizontal bar does not include 0, drug A has a significant effect in reducing weight compared to the placebo. Conversely, in Study 4, although the position of the square is located below 0, the range of the horizontal bar includes 0; therefore, drug A has significantly decreased weight compared to the placebo. Since the vertices of the diamond—the mean effect size of all studies—are less than 0, the appetite suppressant reduces weight compared to the placebo. However, it does not have statistical significance, because it contains 0.
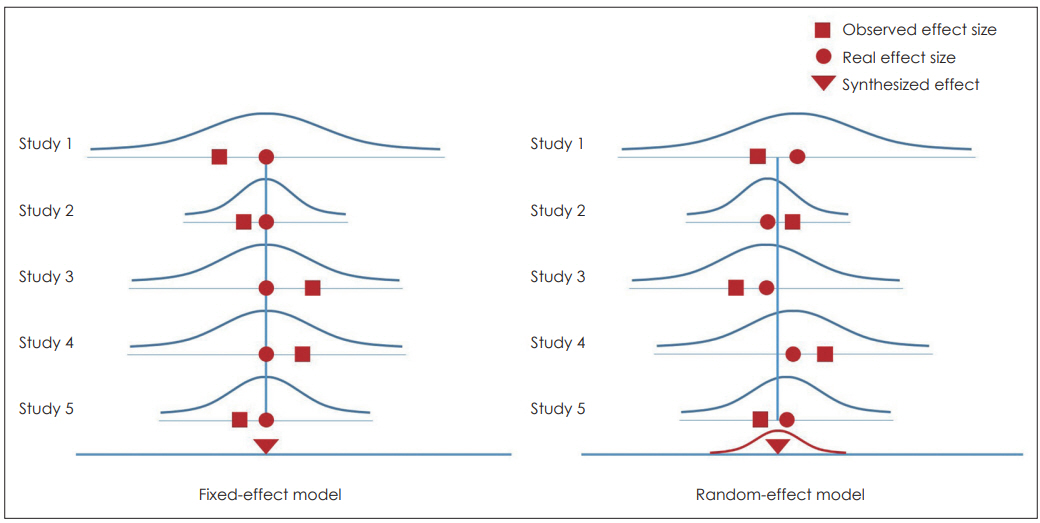
Fig. 3. Comparison of fixed-effect model and random-effect model. The fixed-effect model assumes that each study shares the same population, while the random-effect model assumes that each study has different populations. In the former, since the effect sizes of the studies are the same and the variance between the studies is 0, the precision increases, and the confidence interval of the mean effect size narrows. In the latter, the confidence interval of the mean effect size is larger, because the effect sizes of the studies are different and the variances are recognized.
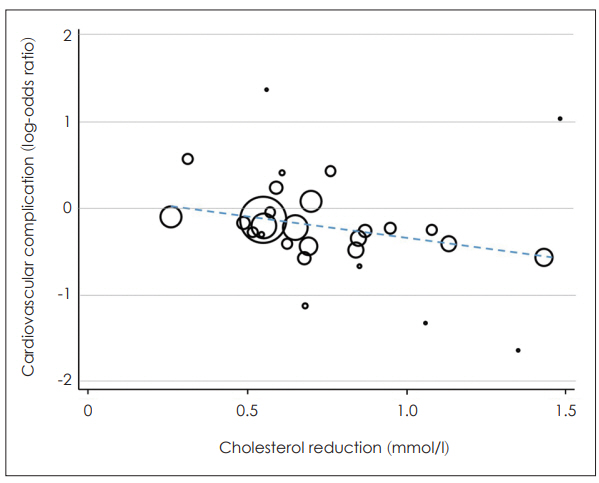
Fig. 4. Meta-regression example. For each study, the circle illustrates the estimate, and the size indicates the precision. The dotted line is the regression result. The graph illustrates that greater decrease in blood cholesterol results in fewer cardiovascular complication occurrences.
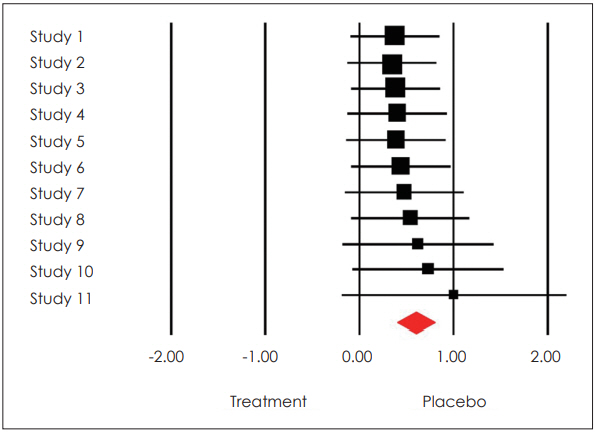
Fig. 5. Forest plot sorted by weight size. Since studies with small weight tend to have large effect sizes, there is a high possibility that small-study effects exist.
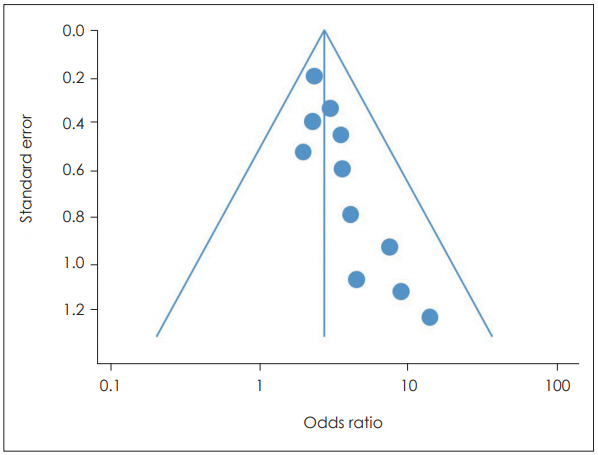
Fig. 6. Funnel plot example. The horizontal axis represents the effect size, the vertical axis represents the standard error, and there is a 95% confidence interval for each effect size on the diagonal. Generally, studies with large samples are concentrated at the top center of the graph, and studies with small sample sizes are widely distributed at the bottom. If there are no publication errors, the studies are distributed symmetrically, and if it is asymmetric, like this graph, publication errors are suspected.
Cited by 1 articles
-
A Review of a Recent Meta-Analysis Study on Obstructive Sleep Apnea
Bo Yoon Choi, Jin Kook Kim, Jae Hoon Cho
J Rhinol. 2022;29(3):134-140. doi: 10.18787/jr.2022.00422.
Reference
-
1. 황성동. 알기 쉬운 메타분석의 이해. 학지사;2014. all pages.2. Borenstein M, Hedges LV, Higgins JPT, Rpthstein HR. Introduction to meta-analysis. Wiley;2009.3. The Centre for Evidence-Based Medicine develops, promotes and disseminates better evidence for healthcare (https://www.cebm.net/category/ebm-resources/).4. PubMed 검 색 매 뉴 얼(https://ymlib.yonsei.ac.kr/wp-content/uploads/2018/01/PubMed201706-1.pdf).5. 신우종. 체계적 고찰과 메타분석의 개요. Hanyang Med Rev 2015;35:9-17. .
