CMR Parametric Mapping as a Tool for Myocardial Tissue Characterization
- Affiliations
-
- 1Oxford Centre for Clinical Magnetic Resonance Research, Division of Cardiovascular Medicine, Radcliffe Department of Medicine, University of Oxford, Oxford, United Kingdom
- KMID: 2505120
- DOI: http://doi.org/10.4070/kcj.2020.0157
Abstract
- Cardiovascular magnetic resonance (CMR) is the current gold standard for imaging cardiac anatomy, function, and advanced myocardial tissue characterization. After cine, late gadolinium enhancement (LGE), and perfusion imaging, parametric mapping is widely regarded as the 4th era of myocardial CMR development. In contrast to conventional CMR tissue characterization techniques, which rely on relative variations in image intensities to highlight abnormal tissues, parametric mapping provides direct visualization of tissue MR properties such as T1, T2 and T2* in absolute denominations (e.g. in milliseconds). Presentation as pixel-wise parametric maps adds spatial information for a more complete assessment of the myocardium. Advantages of parametric mapping include direct, quantitative comparisons inter- and within-individuals, as well as detection of diffuse disease not evident on conventional CMR imaging, without the need for contrast agents. CMR parametric mapping methods have matured over the past decade into clinical tools, demonstrating not only clinical utility but added value in a wide range of cardiac diseases. They are particularly useful for the evaluation of acute myocardial injury, suspected infiltration and heart failure of unclear etiology. This review discusses the background of parametric mapping, particularly T1-, T2- and ECV-mapping, general magnetic resonance physics principles, clinical applications (including imaging protocols, image analysis and reporting guidelines), current challenges and future directions. CMR parametric mapping is increasingly available on routine clinical scanners, and promises to deliver advanced myocardial tissue characterization beyond conventional CMR techniques, ultimately helping clinicians to benefit patients in their clinical management.
Keyword
Figure
-
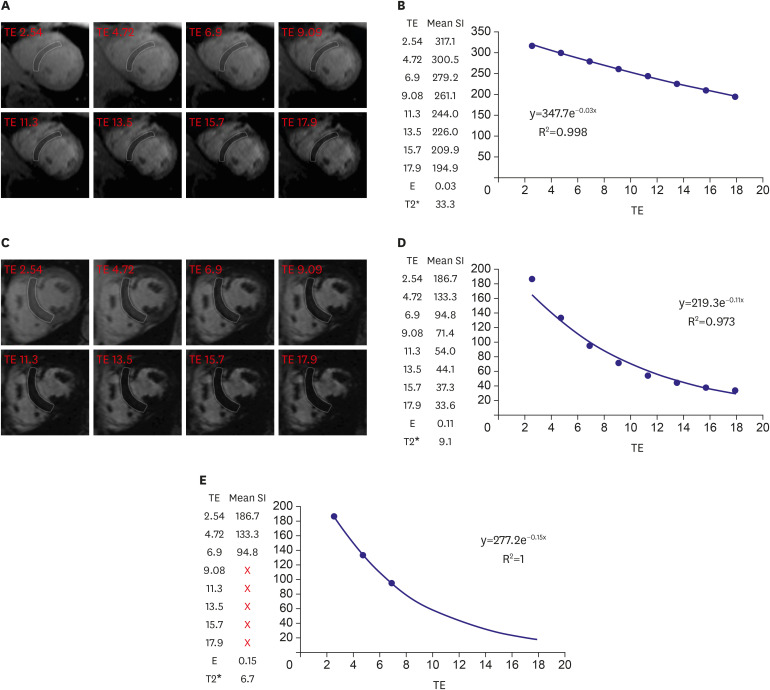
Figure 1 T2* imaging to assess myocardial iron overload. (A) T2* scan of a normal heart showing slow signal loss with increasing TE. (B) Decay curve for normal heart (T2*=33.3 ms). (C) Heavily iron overloaded heart. Note there is substantial signal loss at TE = 9.09. (D) Decay curve for heavily iron overloaded heart showing rapid signal loss with increasing TE. The curve plateaus as myocardial signal intensity falls below background noise. (E) Values for higher TEs are removed (truncation method) resulting in a better curve fit and a lower T2* value. As originally published by BioMed Central in Schulz-Menger et al. Journal of Cardiovascular Magnetic Resonance 2013;15:35.3)TE = echo time.
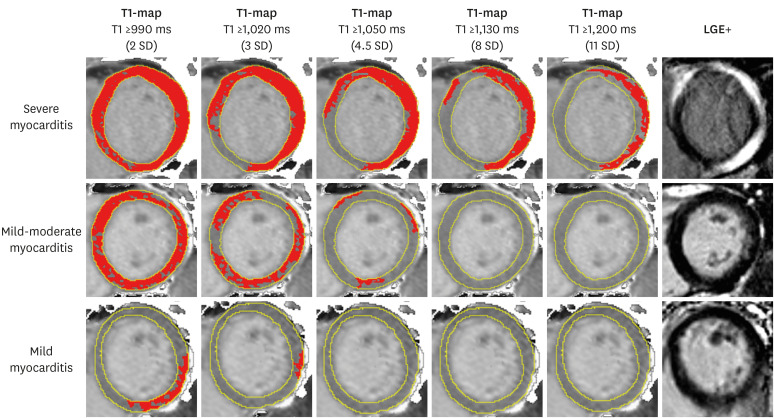
Figure 2 T1-maps using incremental thresholds demonstrate the predominantly non-ischemic pattern of injury across a spectrum of acute myocarditis. Red indicates areas of myocardium with a T1 value above the stated threshold of at least 40 mm2 in contiguous area. T1 threshold of 990 ms was previously validated for the detection of acute myocardial edema; other thresholds were selected for illustrative purposes. As originally published by Biomed Central in Ferreira et al. Journal of Cardiovascular Magnetic Resonance 2014;16:36.4)LGE = late gadolinium enhancement; SD = standard deviation.
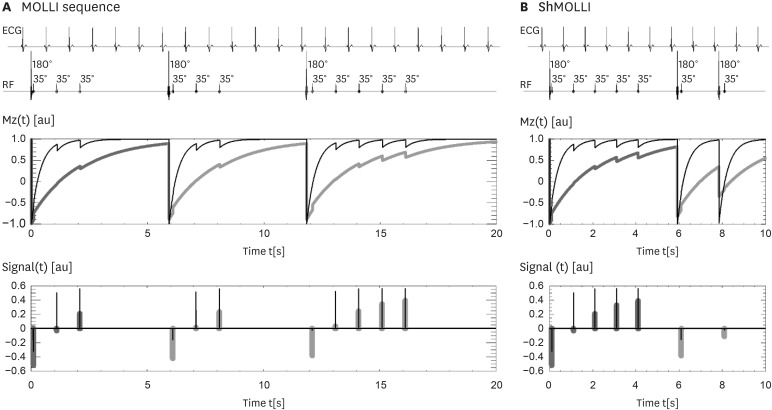
Figure 3 ECG-gated pulse sequence schemes for simulation of (A) MOLLI and (B) ShMOLLI at a heart rate of 60 bpm. SSFP readouts are simplified to a single 35° pulse each, presented at a constant delay time TD from each preceding R wave. The 180° inversion pulses are shifted depending on the IR number to achieve the desired first TI of 100, 180 and 260 ms in the consecutive IR experiments. The plots below represent the evolution of longitudinal Mz for short T1 (400 ms, thin lines) and long T1 (2,000 ms, thick lines). Note that long epochs free of signal acquisitions minimise the impact of incomplete Mz recoveries in MOLLI so that all acquired samples can be pooled together for T1 reconstruction. In ShMOLLI the validity of additional signal samples from the 2nd and 3rd IR epochs is determined by progressive nonlinear estimation. As originally published by BioMed Central in Piechnik S et al. Journal of Cardiovascular Magnetic Resonance 2010;12:69.10)IR = inversion recovery; MOLLI = modified Look-Locker inversion recovery; Mz = longitudinal magnetization; ShMOLLI = shortened modified Look-Locker inversion recovery; SSFP = steady-state free precession; TD = trigger delay.
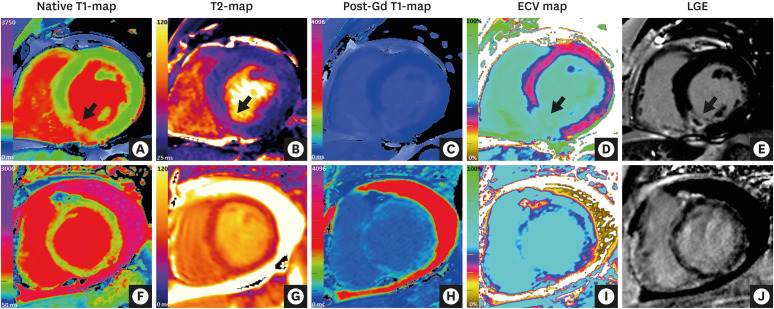
Figure 4 CMR mapping and LGE imaging in acute myocardial pathologies. (Top row) CMR (3 Tesla) images of a patient with an acute myocardial infarction in the inferior septum. (A) Native T1-map (ShMOLLI) showing significantly increased T1 values in the inferior septum (1,407 ms vs. 1,159 ms in remote myocardium in the anterior wall; normal ShMOLLI T1 at 3T = 1,166±60 ms). (B) T2-map showing increased T2 values in the inferior septum (arrow, 55 ms vs. 39 ms in remote myocardium in the anterior wall). (C) Post-gadolinium contrast T1-map. (D) ECV map showing significantly increased ECV in the inferior septum (59% vs. 30% in remote myocardium in the anterior wall). (E) LGE imaging showing transmural enhancement with a core area of microvascular obstruction in the inferior septum (arrow). (Bottom row) CMR (1.5 Tesla) images of a patient with acute myocarditis. (F) Native T1-mapping using the ShMOLLI method showed significantly increased global myocardial T1 values (1,060 ms; normal ShMOLLI T1 at 1.5T = 962±25 ms). (G) T2-map showed increased global myocardial T2 values (59 ms), consistent with edema. (H) Post-gadolinium contrast T1-map. (I) ECV mapping showed increased global ECV of 36% (normal 27±3%). (J) LGE imaging showed small areas of patchy enhancement in a non-coronary distribution.CMR = cardiovascular magnetic resonance; ECV = extracellular volume; LGE = late gadolinium enhancement; ShMOLLI = shortened modified Look-Locker inversion recovery.
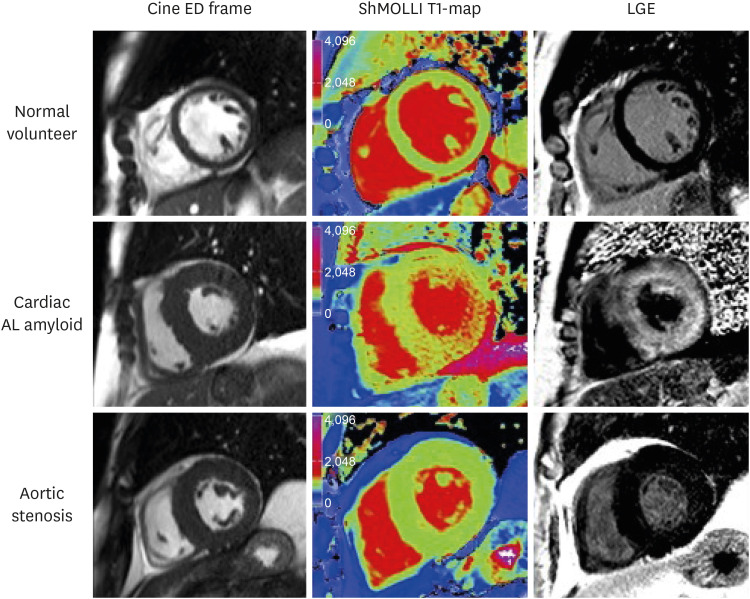
Figure 5 Characteristic examples from CMR scans. CMR end-diastolic frame from cine (left panel), ShMOLLI non-contrast T1 map (middle panel), and LGE images (right panel) in normal volunteer, aortic stenosis patient, and cardiac amyloid patient. Note the markedly elevated myocardial T1 time in the cardiac amyloid patient (1,170 ms, into the red range of the color scale) compared to the normal control (955 ms) and the patient with aortic stenosis and left ventricular hypertrophy (998 ms). As originally published in Karamitsos et al. JACC: Cardiovasc Imaging 2013;6:488-97.17)AL = amyloid light chain; CMR = cardiovascular magnetic resonance; ED = end diastolic; LGE = late gadolinium enhancement; ShMOLLI = shortened modified Look-Locker inversion recovery.
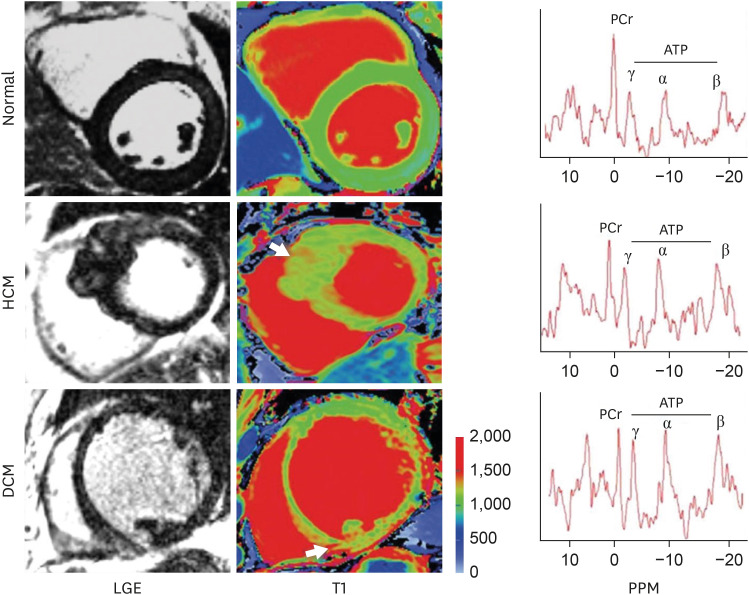
Figure 6 LGE and T1 images in normal, HCM, and DCM. Arrows point to focal areas of LGE and high T1. Note: There is diffusely high T1 in the septum of HCM and inferior septum/inferior in the DCM. Representative spectra for each condition are shown; PCr indicates phosphocreatine; and ATP adenosine triphosphate. As originally published in Dass S. et al. Circulation Cardiovascular Imaging 2012;5:726-33.30)ATP = adenosine triphosphate; DCM = dilated cardiomyopathy; HCM = hypertrophic cardiomyopathy; LGE = late gadolinium enhancement; PCr = creatine phosphate.
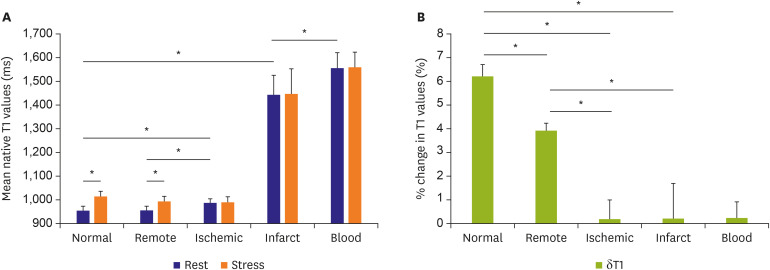
Figure 7 Myocardial T1 at rest and during adenosine stress at 1.5-T. (A) T1 values at rest in normal and remote tissue were similar and significantly lower than in ischemic regions. Infarct T1 was the highest of all myocardial tissue, but lower than the reference left ventricular blood pool of patients. During adenosine stress, normal and remote myocardial T1 increased significantly from baseline, while T1 in ischemic and infarcted regions remained relatively unchanged. (B) Relative T1 reactivity (δT1) in the patient's remote myocardium was significantly blunted compared to normal, and completely abolished in ischemic and infarcted regions. All data indicate mean ±1 SD. Adapted from Liu et al. JACC: Cardiovascular Imaging 2016;9:27-36 originally published by Elsevier.35)SD = standard deviation.*p<0.05.
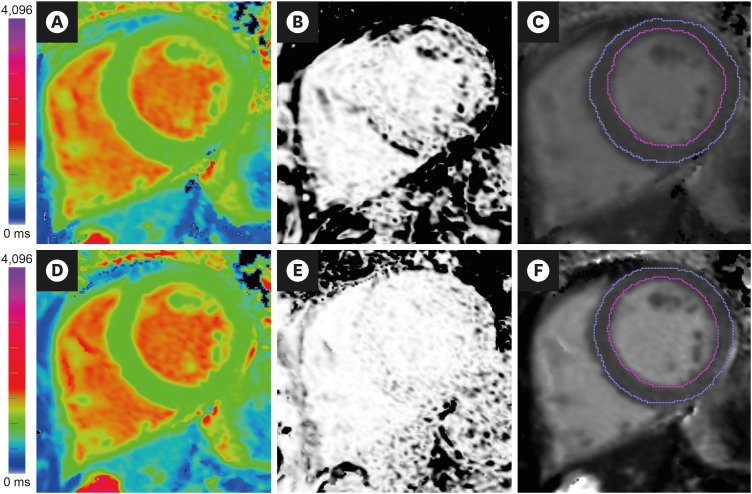
Figure 8 Image analysis of T1-maps. (A) Native T1-map (ShMOLLI at 1.5 Tesla). The acquisition of this T1-map suffered from breathing motion, resulting in (B) an R2 map that showed poor T1 fit (black pixels within the LV myocardium) and (C) underestimated average LV myocardial T1 values (T1=928 ms) after myocardial segmentation using epi- and endo-cardial contours (blue and magenta lines). Guided by the suboptimal R2 map, the operator repeated the acquisition with the patient performing a good breath-hold, which produced (D) A good quality native T1-map, as indicated by (E) an R2 map that showed good T1 fit (pixels within the LV myocardium are white), and (F) accurate average LV myocardial T1 values (T1=943 ms). Ensuring good data fit during image acquisition and analysis is paramount in the clinical application of mapping techniques.LV = left ventricular; ShMOLLI = shortened modified Look-Locker inversion recovery.
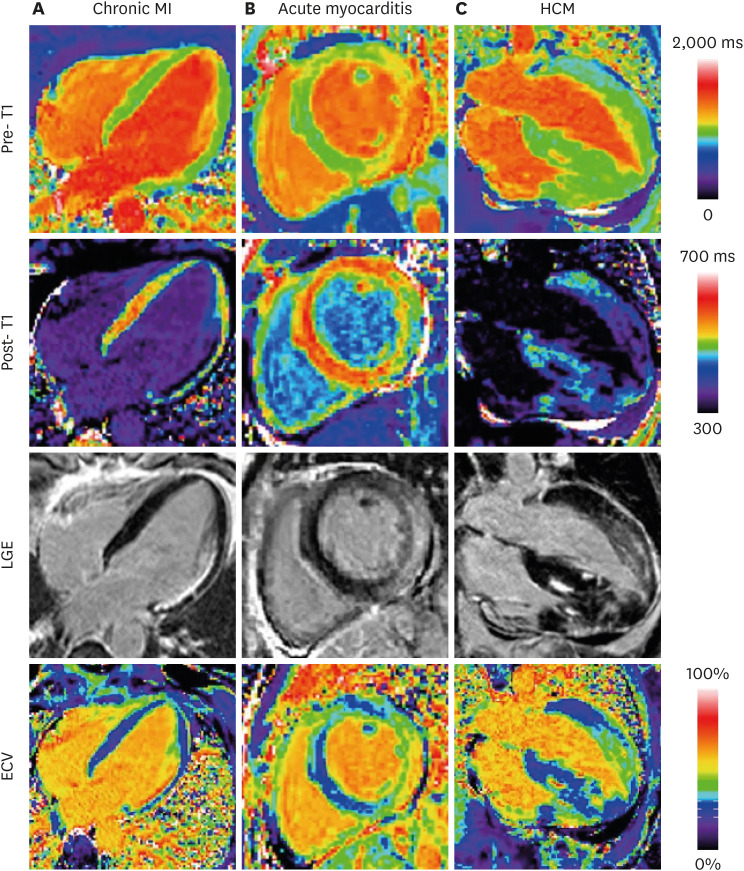
Figure 9 Examples illustrating excellent agreement between LGE and ECV in cases of focal abnormalities in myocardial ECV. Pre-contrast T1-maps (top row), post-contrast T1-maps (2nd row), late gadolinium enhancement (3rd row), and ECV maps (bottom row) for patients with: (A) chronic MI, (B) acute myocarditis, and (C) HCM. As originally published by BioMed Central in Kellman et al. Journal of Cardiovascular Magnetic Resonance 2012;14:64.51)ECV = extracellular volume; HCM = hypertrophic cardiomyopathy; LGE = late gadolinium enhancement; MI = myocardial infarction.
Reference
-
1. Čelutkienė J, Plymen CM, Flachskampf FA, et al. Innovative imaging methods in heart failure: a shifting paradigm in cardiac assessment. Position statement on behalf of the Heart Failure Association of the European Society of Cardiology. Eur J Heart Fail. 2018; 20:1615–1633. PMID: 30411833.
Article2. Ferreira VM, Schulz-Menger J, Holmvang G, et al. Cardiovascular magnetic resonance in nonischemic myocardial inflammation: expert recommendations. J Am Coll Cardiol. 2018; 72:3158–3176. PMID: 30545455.3. Schulz-Menger J, Bluemke DA, Bremerich J, et al. Standardized image interpretation and post processing in cardiovascular magnetic resonance: Society for Cardiovascular Magnetic Resonance (SCMR) board of trustees task force on standardized post processing. J Cardiovasc Magn Reson. 2013; 15:35. PMID: 23634753.
Article4. Ferreira VM, Piechnik SK, Dall'Armellina E, et al. Native T1-mapping detects the location, extent and patterns of acute myocarditis without the need for gadolinium contrast agents. J Cardiovasc Magn Reson. 2014; 16:36. PMID: 24886708.
Article5. Formenti M. Mean of ratios or ratio of means: statistical uncertainty applied to estimate multiperiod probability of default. arXiv. 2014; 1409.4896.6. Robson MD, Piechnik SK, Tunnicliffe EM, Neubauer S. T1 measurements in the human myocardium: the effects of magnetization transfer on the SASHA and MOLLI sequences. Magn Reson Med. 2013; 70:664–670. PMID: 23857710.7. Kellman P, Bandettini WP, Mancini C, Hammer-Hansen S, Hansen MS, Arai AE. Characterization of myocardial T1-mapping bias caused by intramyocardial fat in inversion recovery and saturation recovery techniques. J Cardiovasc Magn Reson. 2015; 17:33. PMID: 25958014.
Article8. Messroghli DR, Moon JC, Ferreira VM, et al. Clinical recommendations for cardiovascular magnetic resonance mapping of T1, T2, T2* and extracellular volume: a consensus statement by the Society for Cardiovascular Magnetic Resonance (SCMR) endorsed by the European Association for Cardiovascular Imaging (EACVI). J Cardiovasc Magn Reson. 2017; 19:75. PMID: 28992817.
Article9. Messroghli DR, Radjenovic A, Kozerke S, Higgins DM, Sivananthan MU, Ridgway JP. Modified Look-Locker inversion recovery (MOLLI) for high-resolution T1 mapping of the heart. Magn Reson Med. 2004; 52:141–146. PMID: 15236377.10. Piechnik SK, Ferreira VM, Dall'Armellina E, et al. Shortened Modified Look-Locker Inversion recovery (ShMOLLI) for clinical myocardial T1-mapping at 1.5 and 3 T within a 9 heartbeat breathhold. J Cardiovasc Magn Reson. 2010; 12:69. PMID: 21092095.
Article11. Piechnik SK, Ferreira VM, Lewandowski AJ, et al. Normal variation of magnetic resonance T1 relaxation times in the human population at 1.5 T using ShMOLLI. J Cardiovasc Magn Reson. 2013; 15:13. PMID: 23331520.
Article12. Dabir D, Child N, Kalra A, et al. Reference values for healthy human myocardium using a T1 mapping methodology: results from the International T1 Multicenter cardiovascular magnetic resonance study. J Cardiovasc Magn Reson. 2014; 16:69. PMID: 25384607.
Article13. Liu JM, Liu A, Leal J, et al. Measurement of myocardial native T1 in cardiovascular diseases and norm in 1291 subjects. J Cardiovasc Magn Reson. 2017; 19:74. PMID: 28954631.
Article14. Ferreira VM, Piechnik SK, Dall'Armellina E, et al. Non-contrast T1-mapping detects acute myocardial edema with high diagnostic accuracy: a comparison to T2-weighted cardiovascular magnetic resonance. J Cardiovasc Magn Reson. 2012; 14:42. PMID: 22720998.
Article15. Ferreira VM, Piechnik SK, Dall'Armellina E, et al. T(1) mapping for the diagnosis of acute myocarditis using CMR: comparison to T2-weighted and late gadolinium enhanced imaging. JACC Cardiovasc Imaging. 2013; 6:1048–1058. PMID: 24011774.16. Dall'Armellina E, Piechnik SK, Ferreira VM, et al. Cardiovascular magnetic resonance by non contrast T1-mapping allows assessment of severity of injury in acute myocardial infarction. J Cardiovasc Magn Reson. 2012; 14:15. PMID: 22309452.17. Karamitsos TD, Piechnik SK, Banypersad SM, et al. Noncontrast T1 mapping for the diagnosis of cardiac amyloidosis. JACC Cardiovasc Imaging. 2013; 6:488–497. PMID: 23498672.
Article18. Sado DM, Maestrini V, Piechnik SK, et al. Noncontrast myocardial T1 mapping using cardiovascular magnetic resonance for iron overload. J Magn Reson Imaging. 2015; 41:1505–1511. PMID: 25104503.19. Sado DM, White SK, Piechnik SK, et al. Identification and assessment of Anderson-Fabry disease by cardiovascular magnetic resonance noncontrast myocardial T1 mapping. Circ Cardiovasc Imaging. 2013; 6:392–398. PMID: 23564562.
Article20. Feng Y, He T, Carpenter JP, et al. In vivo comparison of myocardial T1 with T2 and T2* in thalassaemia major. J Magn Reson Imaging. 2013; 38:588–593. PMID: 23371802.
Article21. Thompson RB, Chow K, Khan A, et al. T1 mapping with cardiovascular MRI is highly sensitive for Fabry disease independent of hypertrophy and sex. Circ Cardiovasc Imaging. 2013; 6:637–645. PMID: 23922004.22. Dall'Armellina E, Ferreira VM, Kharbanda RK, et al. Diagnostic value of pre-contrast T1 mapping in acute and chronic myocardial infarction. JACC Cardiovasc Imaging. 2013; 6:739–742. PMID: 23764100.23. Liu D, Borlotti A, Viliani D, et al. CMR native T1 mapping allows differentiation of reversible versus irreversible myocardial damage in ST-segment-elevation myocardial infarction: an OxAMI Study (Oxford Acute Myocardial Infarction). Circ Cardiovasc Imaging. 2017; 10:e005986–005986. PMID: 28798137.
Article24. Alkhalil M, Borlotti A, De Maria GL, et al. Hyper-acute cardiovascular magnetic resonance T1 mapping predicts infarct characteristics in patients with ST elevation myocardial infarction. J Cardiovasc Magn Reson. 2020; 22:3. PMID: 31915031.
Article25. Wamil M, Borlotti A, Liu D, et al. Combined T1-mapping and tissue tracking analysis predicts severity of ischemic injury following acute STEMI-an Oxford Acute Myocardial Infarction (OxAMI) study. Int J Cardiovasc Imaging. 2019; 35:1297–1308. PMID: 30778713.
Article26. Banypersad SM, Fontana M, Maestrini V, et al. T1 mapping and survival in systemic light-chain amyloidosis. Eur Heart J. 2015; 36:244–251. PMID: 25411195.
Article27. Fontana M, Banypersad SM, Treibel TA, et al. Native T1 mapping in transthyretin amyloidosis. JACC Cardiovasc Imaging. 2014; 7:157–165. PMID: 24412190.
Article28. Fontana M, White SK, Banypersad SM, et al. Comparison of T1 mapping techniques for ECV quantification. Histological validation and reproducibility of ShMOLLI versus multibreath-hold T1 quantification equilibrium contrast CMR. J Cardiovasc Magn Reson. 2012; 14:88. PMID: 23272651.
Article29. Ferreira VM, Messroghli D. Mapping techniques. In : Lombardi M, Plein S, Petersen S, Bucciarelli-Ducci C, Valsangiacomo Buechel ER, Basso C, Ferrari V, editors. The EACVI Textbook of Cardiovascular Magnetic Resonance. Oxford, UK: Oxford University Press;2018. p. 133–145.30. Dass S, Suttie JJ, Piechnik SK, et al. Myocardial tissue characterization using magnetic resonance noncontrast t1 mapping in hypertrophic and dilated cardiomyopathy. Circ Cardiovasc Imaging. 2012; 5:726–733. PMID: 23071146.
Article31. Moon JC, Messroghli DR, Kellman P, et al. Myocardial T1 mapping and extracellular volume quantification: a Society for Cardiovascular Magnetic Resonance (SCMR) and CMR Working Group of the European Society of Cardiology consensus statement. J Cardiovasc Magn Reson. 2013; 15:92. PMID: 24124732.
Article32. Flett AS, Hayward MP, Ashworth MT, et al. Equilibrium contrast cardiovascular magnetic resonance for the measurement of diffuse myocardial fibrosis: preliminary validation in humans. Circulation. 2010; 122:138–144. PMID: 20585010.33. White SK, Sado DM, Fontana M, et al. T1 mapping for myocardial extracellular volume measurement by CMR: bolus only versus primed infusion technique. JACC Cardiovasc Imaging. 2013; 6:955–962. PMID: 23582361.34. Piechnik SK, Jerosch-Herold M. Myocardial T1 mapping and extracellular volume quantification: an overview of technical and biological confounders. Int J Cardiovasc Imaging. 2018; 34:3–14. PMID: 28849419.
Article35. Liu A, Wijesurendra RS, Francis JM, et al. Adenosine stress and rest T1 mapping can differentiate between ischemic, infarcted, remote, and normal myocardium without the need for gadolinium contrast agents. JACC Cardiovasc Imaging. 2016; 9:27–36. PMID: 26684978.
Article36. Mahmod M, Piechnik SK, Levelt E, et al. Adenosine stress native T1 mapping in severe aortic stenosis: evidence for a role of the intravascular compartment on myocardial T1 values. J Cardiovasc Magn Reson. 2014; 16:92. PMID: 25410203.
Article37. Wong TC, Piehler K, Meier CG, et al. Association between extracellular matrix expansion quantified by cardiovascular magnetic resonance and short-term mortality. Circulation. 2012; 126:1206–1216. PMID: 22851543.
Article38. Wong TC, Piehler KM, Kang IA, et al. Myocardial extracellular volume fraction quantified by cardiovascular magnetic resonance is increased in diabetes and associated with mortality and incident heart failure admission. Eur Heart J. 2014; 35:657–664. PMID: 23756336.
Article39. Piechnik SK, Neubauer S, Ferreira VM. State-of-the-art review: stress T1 mapping-technical considerations, pitfalls and emerging clinical applications. MAGMA. 2018; 31:131–141. PMID: 28914389.
Article40. Nakamori S, Fahmy A, Jang J, et al. Changes in myocardial native T1 and T2 after exercise stress: a noncontrast CMR pilot study. JACC Cardiovasc Imaging. 2020; 13:667–680. PMID: 31326484.41. Giri S, Chung YC, Merchant A, et al. T2 quantification for improved detection of myocardial edema. J Cardiovasc Magn Reson. 2009; 11:56. PMID: 20042111.
Article42. Sprinkart AM, Luetkens JA, Träber F, et al. Gradient spin echo (GraSE) imaging for fast myocardial T2 mapping. J Cardiovasc Magn Reson. 2015; 17:12. PMID: 25885268.
Article43. Fernández-Jiménez R, Sánchez-González J, Aguero J, et al. Fast T2 gradient-spin-echo (T2-GraSE) mapping for myocardial edema quantification: first in vivo validation in a porcine model of ischemia/reperfusion. J Cardiovasc Magn Reson. 2015; 17:92. PMID: 26538198.
Article44. Abdel-Aty H, Boyé P, Zagrosek A, et al. Diagnostic performance of cardiovascular magnetic resonance in patients with suspected acute myocarditis: comparison of different approaches. J Am Coll Cardiol. 2005; 45:1815–1822. PMID: 15936612.
Article45. Kramer CM, Barkhausen J, Bucciarelli-Ducci C, Flamm SD, Kim RJ, Nagel E. Standardized cardiovascular magnetic resonance imaging (CMR) protocols: 2020 update. J Cardiovasc Magn Reson. 2020; 22:17. PMID: 32089132.
Article46. von Knobelsdorff-Brenkenhoff F, Prothmann M, Dieringer MA, et al. Myocardial T1 and T2 mapping at 3 T: reference values, influencing factors and implications. J Cardiovasc Magn Reson. 2013; 15:53. PMID: 23777327.47. Schulz-Menger J, Bluemke DA, Bremerich J, et al. Standardized image interpretation and post-processing in cardiovascular magnetic resonance - 2020 update: Society for Cardiovascular Magnetic Resonance (SCMR): Board of Trustees Task Force on Standardized Post-Processing. J Cardiovasc Magn Reson. 2020; 22:19. PMID: 32160925.
Article48. Carapella V, Puchta H, Lukaschuk E, et al. Standardized image post-processing of cardiovascular magnetic resonance T1-mapping reduces variability and improves accuracy and consistency in myocardial tissue characterization. Int J Cardiol. 2020; 298:128–134. PMID: 31500864.
Article49. Baeßler B, Schaarschmidt F, Dick A, et al. Mapping tissue inhomogeneity in acute myocarditis: a novel analytical approach to quantitative myocardial edema imaging by T2-mapping. J Cardiovasc Magn Reson. 2015; 17:115. PMID: 26700020.
Article50. Meduri A, Di Molfetta DV, Natale L, Manfredi R. Cardiac magnetic resonance in systemic sclerosis patients with cardiac symptoms. Eur Rev Med Pharmacol Sci. 2017; 21:4797–4803. PMID: 29164584.51. Kellman P, Wilson JR, Xue H, et al. Extracellular volume fraction mapping in the myocardium, part 2: initial clinical experience. J Cardiovasc Magn Reson. 2012; 14:64. PMID: 22967246.
Article52. Treibel TA, Fontana M, Maestrini V, et al. Automatic measurement of the myocardial interstitium: synthetic extracellular volume quantification without hematocrit sampling. JACC Cardiovasc Imaging. 2016; 9:54–63. PMID: 26762875.
- Full Text Links
-
- Actions
-
Cited
- CITED
-
- Close
- Share
-
- Similar articles
-
- Advanced Cardiac MR Imaging for Myocardial Characterization and Quantification: T1 Mapping
- Principles and Clinical Applications of Feature-Tracking Cardiac Magnetic Resonance Imaging: A Literature Review
- DEMO: Deep MR Parametric Mapping with Unsupervised Multi-Tasking Framework
- Assessment of Myocardial Ischemia Using Stress Perfusion Cardiovascular Magnetic Resonance
- Using Cardiac Magnetic Resonance Imaging to Evaluate Patients with Chest Pain in the Emergency Department
