Generating Motion- and Distortion-Free Local Field Map Using 3D Ultrashort TE MRI: Comparison with Tâ‚‚* Mapping
- Affiliations
-
- 1Utah Center for Advanced Imaging Research, University of Utah, Salt Lake City, UT, USA. ek.jeong@utah.edu
- 2Department of Biomedical Engineering, University of Utah, Salt Lake City, UT, USA.
- 3Department of Physics, University of Utah, Salt Lake City, UT, USA.
- 4Radiology and Imaging Sciences, University of Utah, Salt Lake City, UT, USA.
- 5Radiological Sciences, Yonsei University, Wonju, Korea.
- 6Molecular Imaging & Therapy Branch, National Cancer Center, Goyang-si, Korea.
- KMID: 2468050
- DOI: http://doi.org/10.13104/imri.2019.23.4.328
Abstract
- PURPOSE
To generate phase images with free of motion-induced artifact and susceptibility-induced distortion using 3D radial ultrashort TE (UTE) MRI.
MATERIALS AND METHODS
The field map was theoretically derived by solving Laplace's equation with appropriate boundary conditions, and used to simulate the image distortion in conventional spin-warp MRI. Manufacturer's 3D radial imaging sequence was modified to acquire maximum number of radial spokes in a given time, by removing the spoiler gradient and sampling during both rampup and rampdown gradient. Spoke direction randomly jumps so that a readout gradient acts as a spoiling gradient for the previous spoke. The custom raw data was reconstructed using a homemade image reconstruction software, which is programmed using Python language. The method was applied to a phantom and in-vivo human brain and abdomen. The performance of UTE was compared with 3D GRE for phase mapping. Local phase mapping was compared with Tâ‚‚* mapping using UTE.
RESULTS
The phase map using UTE mimics true field-map, which was theoretically calculated, while that using 3D GRE revealed both motion-induced artifact and geometric distortion. Motion-free imaging is particularly crucial for application of phase mapping for abdomen MRI, which typically requires multiple breathold acquisitions. The air pockets, which are caught within the digestive pathway, induce spatially varying and large background field. Tâ‚‚* map, that was calculated using UTE data, suffers from non-uniform Tâ‚‚* value due to this background field, while does not appear in the local phase map of UTE data.
CONCLUSION
Phase map generated using UTE mimicked the true field map even when non-zero susceptibility objects were present. Phase map generated by 3D GRE did not accurately mimic the true field map when non-zero susceptibility objects were present due to the significant field distortion as theoretically calculated. Nonetheless, UTE allows for phase maps to be free of susceptibility-induced distortion without the use of any post-processing protocols.
Keyword
MeSH Terms
Figure
-
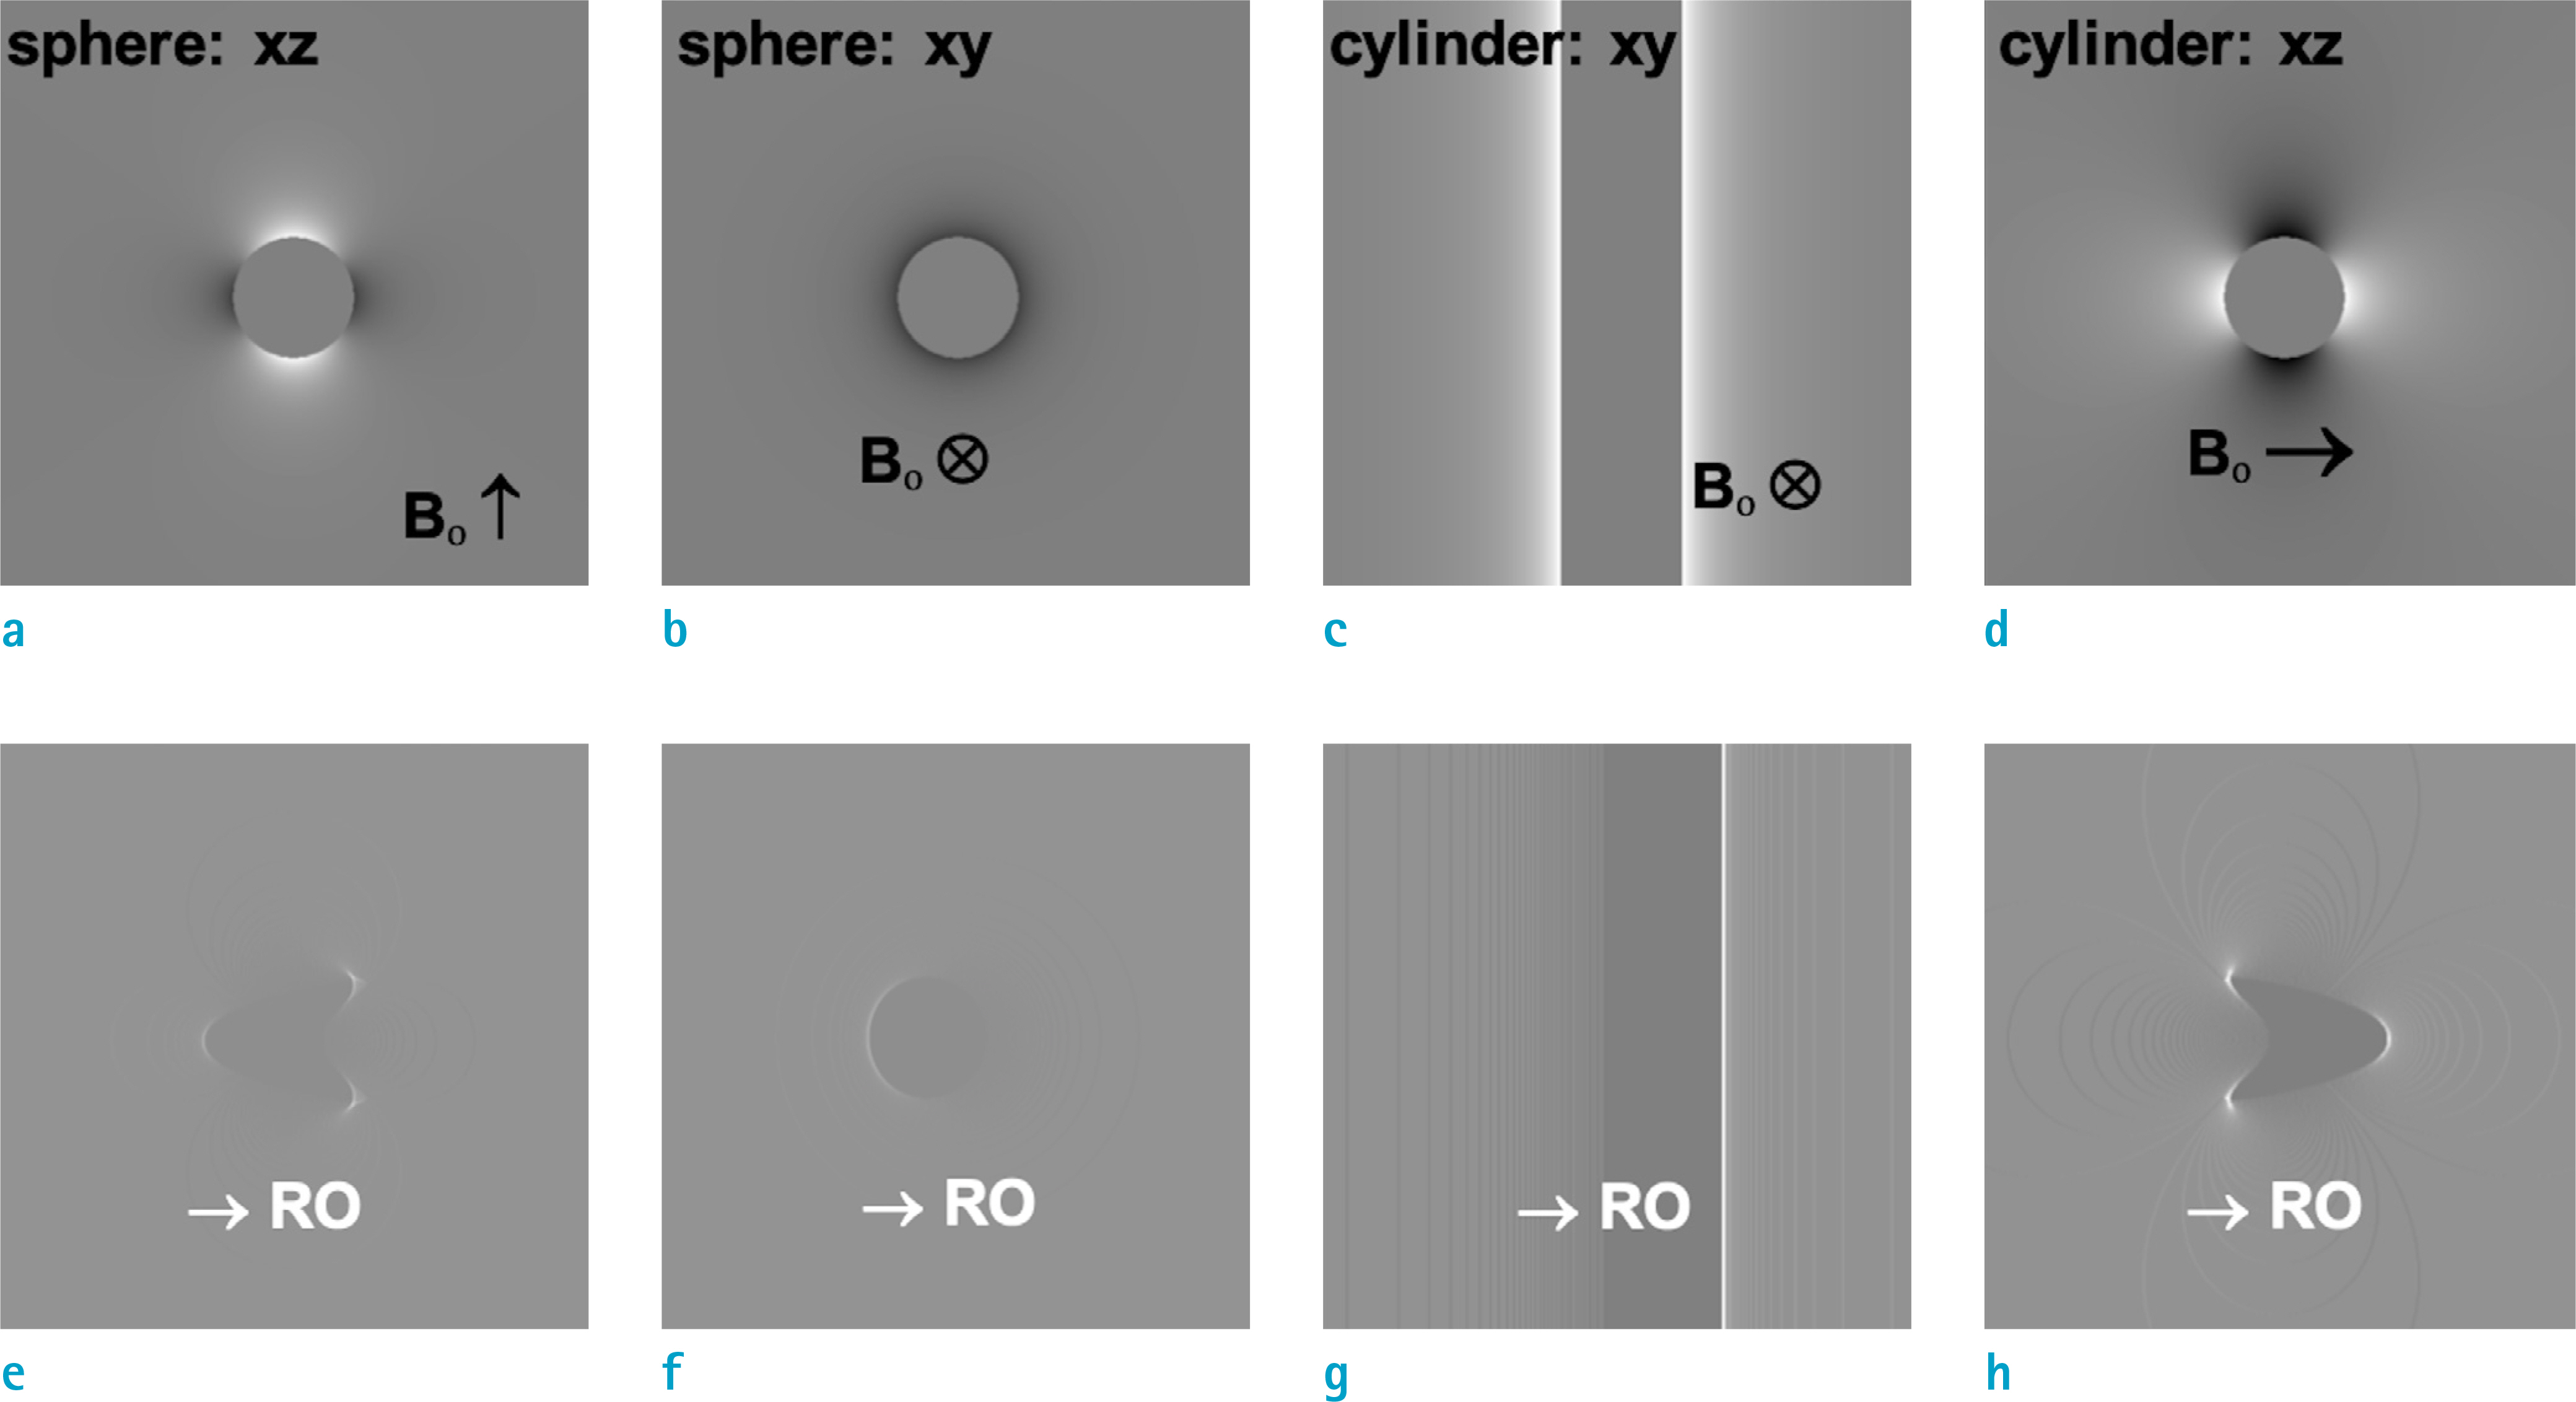
Fig. 1. Numerical simulation of (a-d: top row) local field variation and (e-h: bottom row) geometric distortion in the typical FT MRI images for (a, b, e, f). a solid sphere and (c, d, g, h). a solid cylinder with Δχ = +16 ppm. The cylinder in (c, d, g, h) is oriented perpendicular to the external static magnetic field Bo.
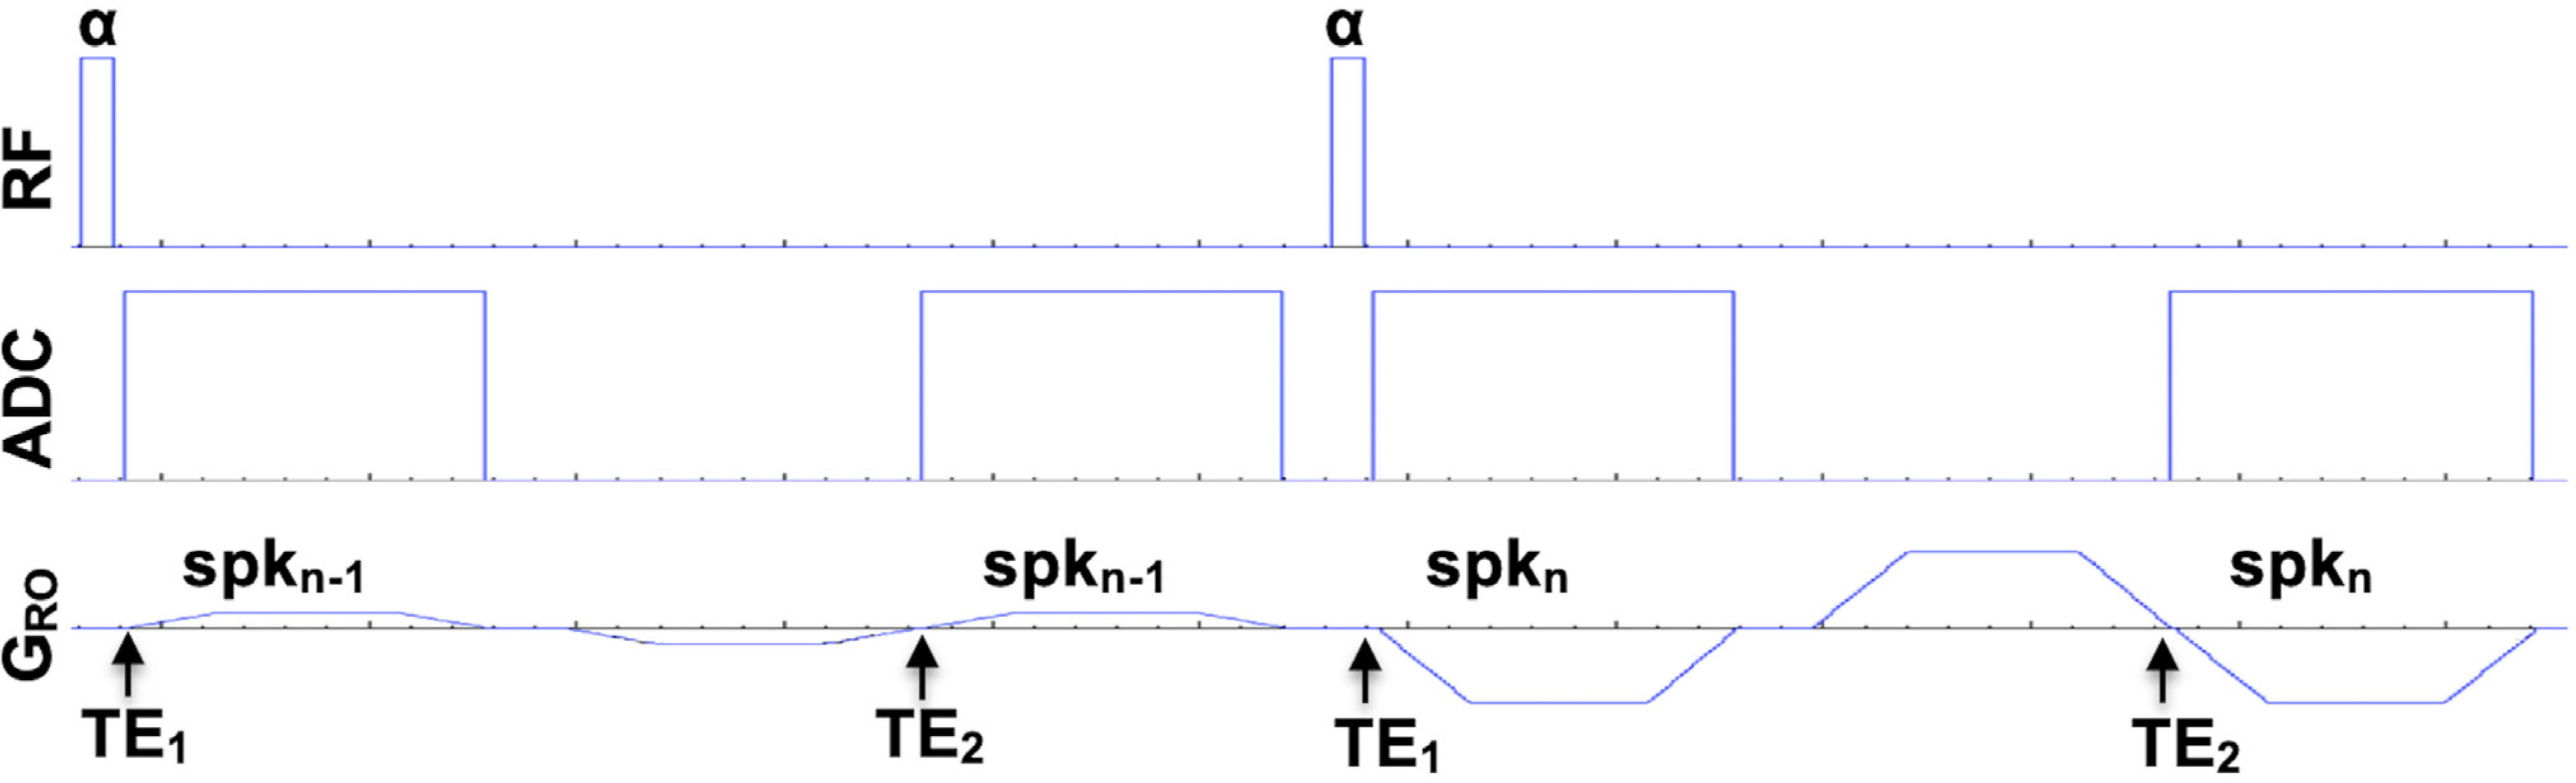
Fig. 2. Pulse sequence diagram for a double FID acquisition. The smooth-varying spoke order is randomly shuffled so that the current readout gradient (spkn) plays as a spoiling gradient for the previous spoke (spkn-1). The flip angle is set to an Ernst angle for the T1 of the tissue of our interest.

Fig. 3. Front-end of GUI-based reconstruction software. The software is very flexible to set the reconstruction as well as the acquisition parameters. It can selectively reconstruct specific loop counters, such as receive channels, echoes, and repetitions. The current software is capable to reconstruct the UTE raw data from Siemens MRI system with VB and VD version.

Fig. 4. Magnitude and phase images of (a, b: top row) UTE with TE = 0.07 and 2.07 ms, and (c, d: bottom row) 3D GRE with TE = 1.6 and 3.6 ms on a phantom filled with MnCl2/water solution and aluminum and two plastic tubings from top to bottom. Note the distorted and asymmetric magnitude and phase images around the aluminum rod and motion-artifact in GRE images in (c, d), indicated by downward arrows.

Fig. 5. Local phase images of a phantom filled with corn starch gel with aluminum rod, a vial filled with high-concentration Gd-DTPA solution, multiple spherical air bubbles, measured using (a: Lt) UTE and (b: Rt) 3D GRE. Note that all local phases are symmetric in UTE phase maps as pointed by arrows, while they mimic the distorted images in Figure 1.

Fig. 6. (a, c: first and third columns) Local phase maps, and (b, d: second and forth columns) T2* maps of in-vivo brain and abdomen of a healthy volunteer. The same data set with TE = 0.07, 2.07, and 4.07 ms was used for T2* and TE = 0.07 and 4.07 ms for local phase mappings. Non-uniformity in the T2* map is clearly visible at the frontal lobe brain (b) and upper part of liver close to lung space and kidney (d).
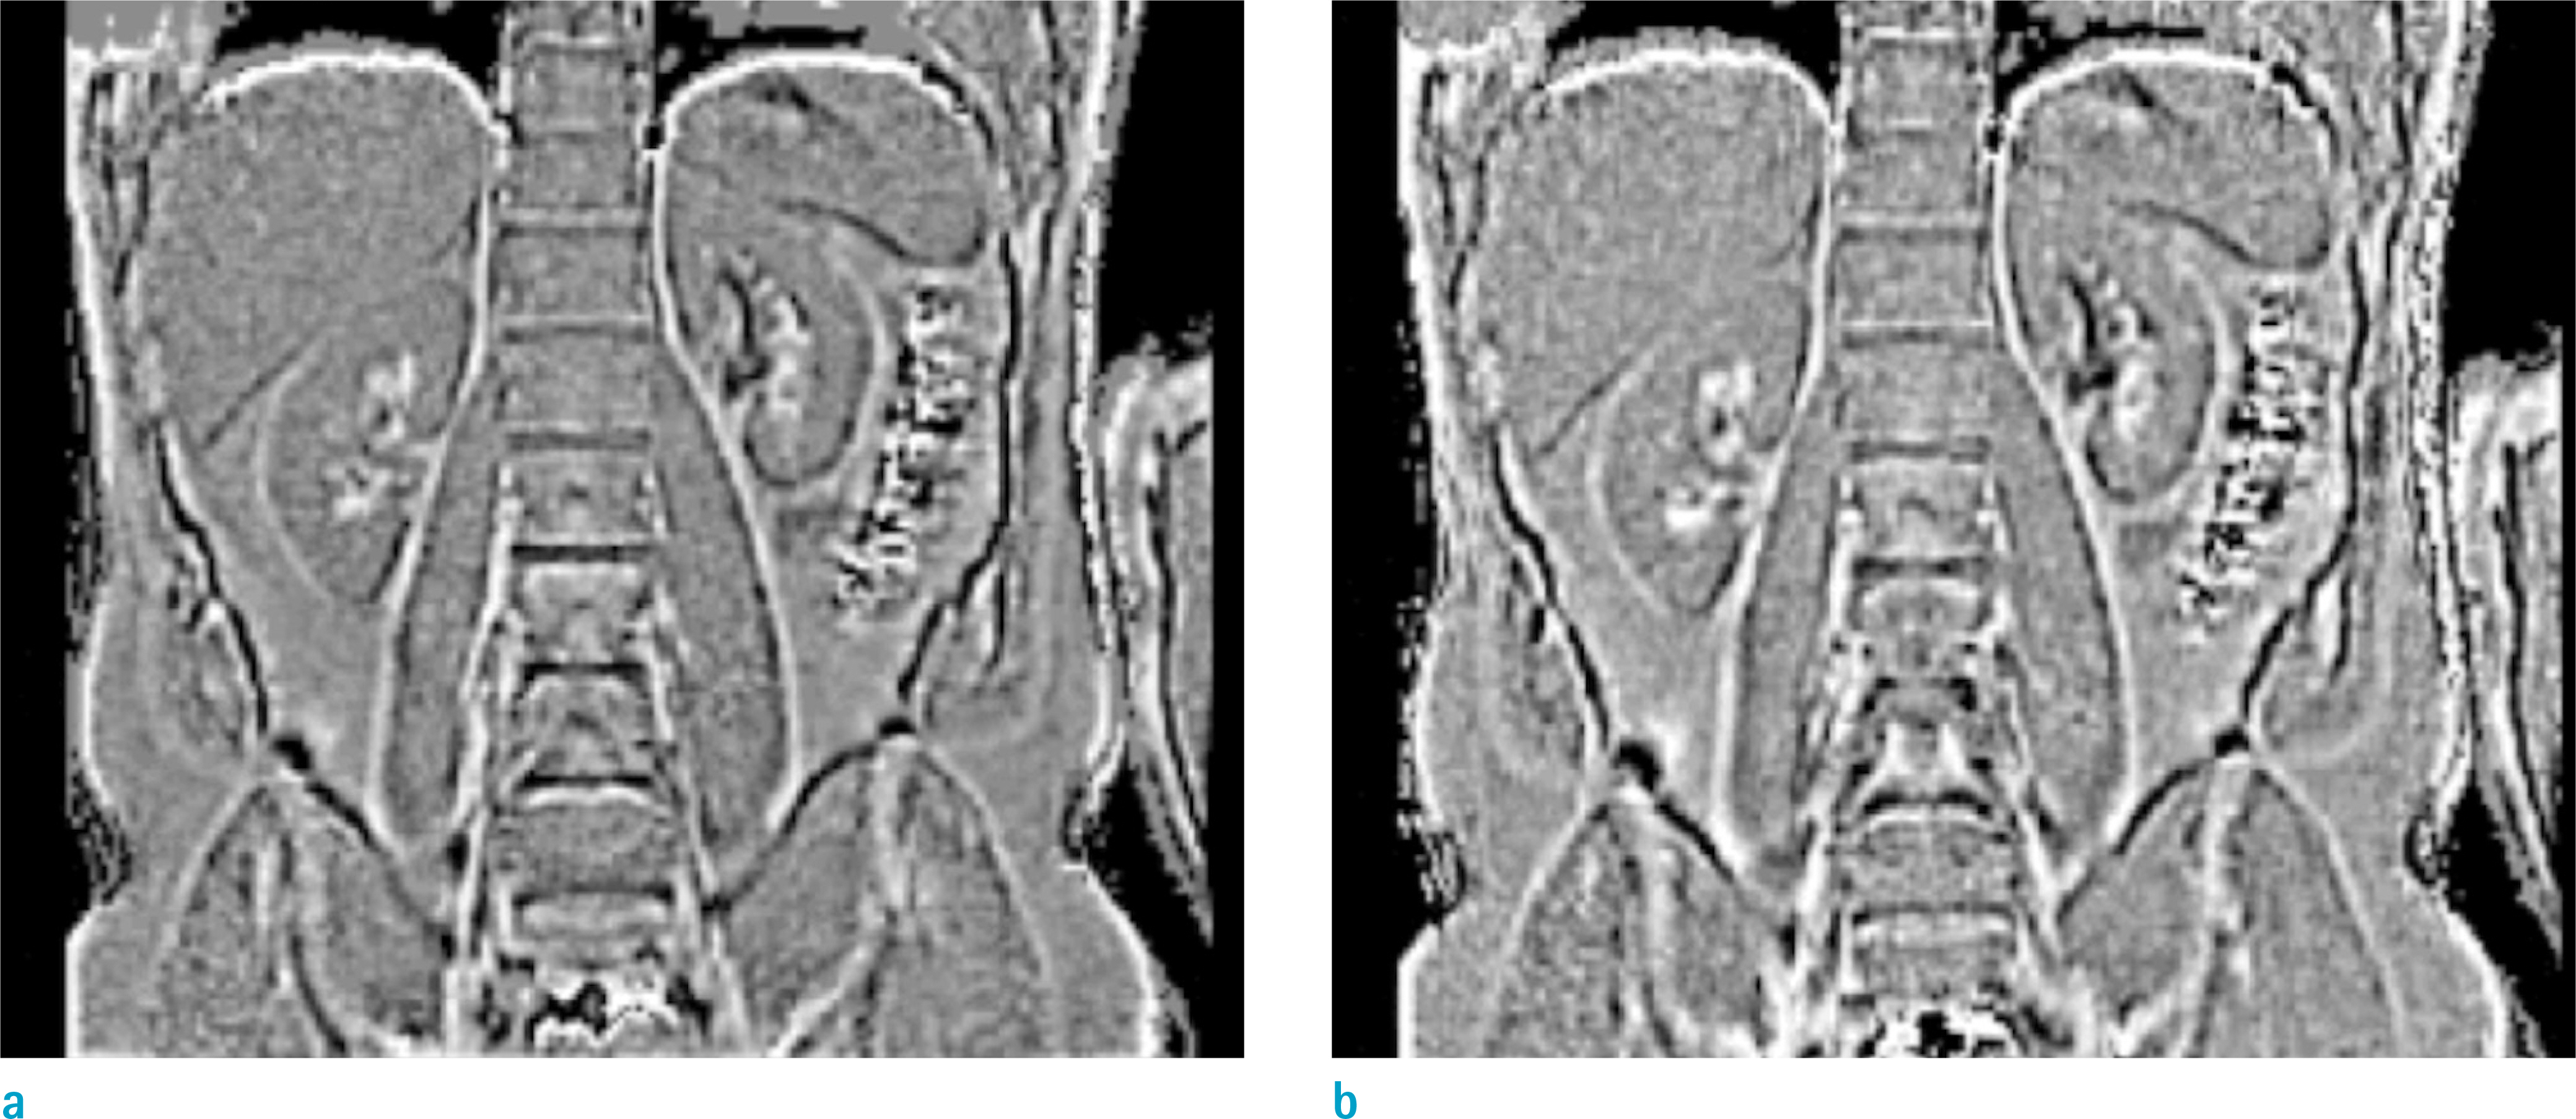
Fig. 7. (a: Lt) Local phase and (b: Rt) QSM maps of abdomen from a healthy volunteer using UTE with nSpks = 131,072, TR = 3.60 ms, TE = 0.070, 2.57 ms, 1 mm3, α = 4.5°. QSM map was calculated using the FT method with Fth = 2.
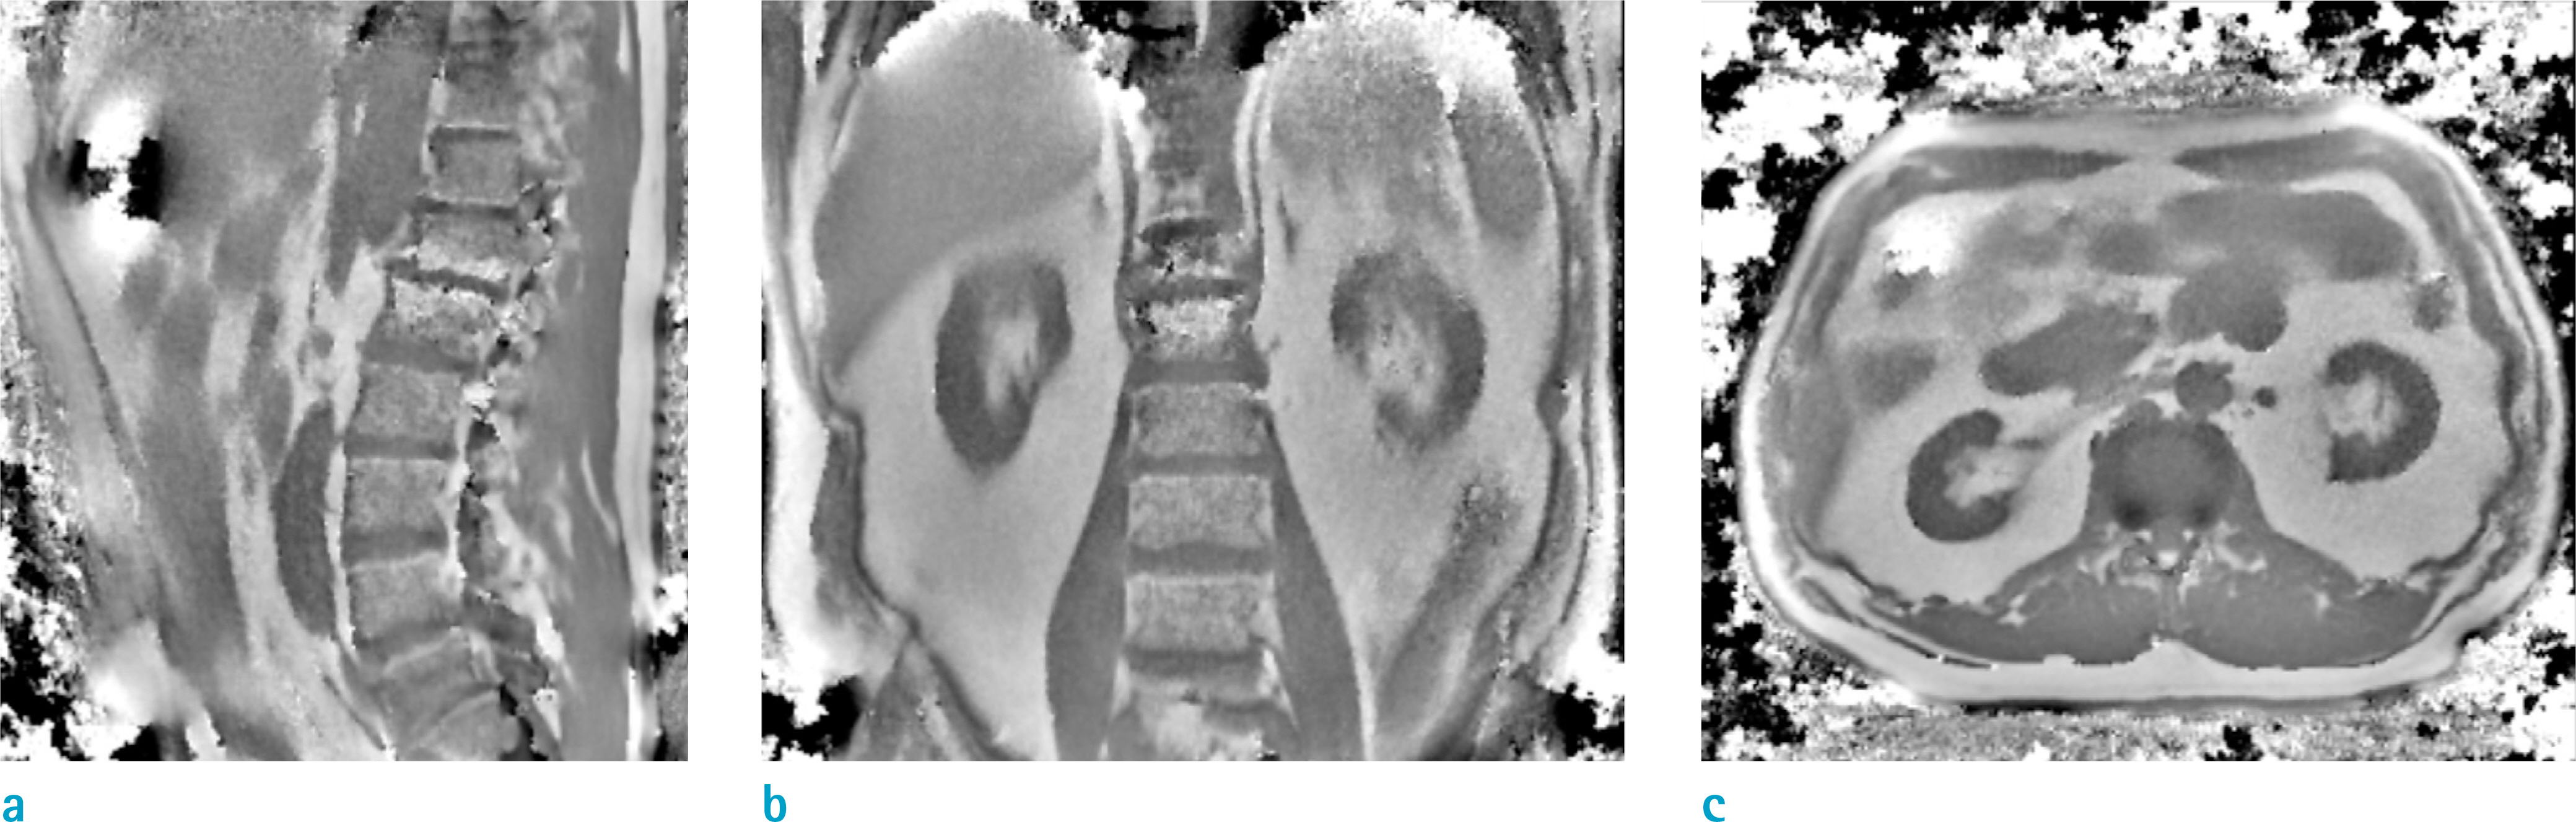
Fig. 8. Local field maps of a kidney dialysis patient in (a: Lt) sagittal, (b: Mid) coronal, (c: Rt) axial planes.
Reference
-
References
1. Haacke EM, Mittal S, Wu Z, Neelavalli J, Cheng YC. Susceptibility-weighted imaging: technical aspects and clinical applications, part 1. AJNR Am J Neuroradiol. 2009; 30:19–30.
Article2. Mittal S, Wu Z, Neelavalli J, Haacke EM. Susceptibility-weighted imaging: technical aspects and clinical applications, part 2. AJNR Am J Neuroradiol. 2009; 30:232–252.
Article3. Shmueli K, de Zwart JA, van Gelderen P, Li TQ, Dodd SJ, Duyn JH. Magnetic susceptibility mapping of brain tissue in vivo using MRI phase data. Magn Reson Med. 2009; 62:1510–1522.
Article4. Schweser F, Deistung A, Sommer K, Reichenbach JR. Toward online reconstruction of quantitative susceptibility maps: superfast dipole inversion. Magn Reson Med. 2013; 69:1582–1594.
Article5. Haacke EM, Brown RW, Thompson MR. Magnetic resonance imaging, physical principles and sequence design. New York, NY: Wiley-Liss;1999.6. Zhou XJ, Bernstein MA, King KF. Handbook of MRI pulse sequences. New York, NY: Elsevier Science;2005.7. Slichter CP. Principles of magnetic resonance. 3rd ed.Berlin, Heidelberg, New York: Springer-Verlag;1990.8. Fukushima E, Roeder SBW. Experimental pulse NMR: A nuts and bolts approach. Reading, MA: Addison-Wesley Publishing Company, Inc.,. 1981.9. Sharma SD, Hernando D, Horng DE, Reeder SB. Quantitative susceptibility mapping in the abdomen as an imaging biomarker of hepatic iron overload. Magn Reson Med. 2015; 74:673–683.
Article10. Barrera Portillo MC, Uranga Uranga M, Sanchez Gonzalez J, Alustiza Echeverria JM, Gervas Wells C, Guisasola Iniguez A. Liver and heart T2* measurement in secondary haemochromatosis. Radiologia. 2013; 55:331–339.11. Li W, Wu B, Liu C. Quantitative susceptibility mapping of human brain reflects spatial variation in tissue composition. Neuroimage. 2011; 55:1645–1656.
Article12. He X, Yablonskiy DA. Biophysical mechanisms of phase contrast in gradient echo MRI. Proc Natl Acad Sci U S A. 2009; 106:13558–13563.
Article13. Yablonskiy DA, Luo J, Sukstanskii AL, Iyer A, Cross AH. Biophysical mechanisms of MRI signal frequency contrast in multiple sclerosis. Proc Natl Acad Sci U S A. 2012; 109:14212–14217.
Article14. Jeong EK, Kim SE, Guo J, Kholmovski EG, Parker DL. High-resolution DTI with 2D interleaved multislice reduced FOV single-shot diffusion-weighted EPI (2D ss-rFOV-DWEPI). Magn Reson Med. 2005; 54:1575–1579.
Article15. He Q, Ma Y, Fan S, et al. Direct magnitude and phase imaging of myelin using ultrashort echo time (UTE) pulse sequences: a feasibility study. Magn Reson Imaging. 2017; 39:194–199.
Article16. Xie L, Layton AT, Wang N, et al. Dynamic contrast-enhanced quantitative susceptibility mapping with ultrashort echo time MRI for evaluating renal function. Am J Physiol Renal Physiol. 2016; 310:F174–F182.
Article17. Gho SM, Shin J, Kim MO, Kim DH. Simultaneous quantitative mapping of conductivity and susceptibility using a double-echo ultrashort echo time sequence: Example using a hematoma evolution study. Magn Reson Med. 2016; 76:214–221.
Article18. Jackson JD. Classical electrodynamics. 2nd ed.New York: Wiley;1975.19. Griffiths DJ. Introduction to electrodynamics. 4th ed.Pearson;2012.20. Case TA, Durney CH, Ailion DC, Cutillo AG, Morris AH. A mathematical model of diamagnetic line broadening in lung tissue and similar heterogeneous systems: calculations and measurements. J Magn Reson. 1987; 73:304–314.
Article21. Salomir R, De Senneville BD, Moonen CTW. A fast calculation method for magnetic field inhomogeneity due to an arbitrary distribution of bulk susceptibility. Concepts Magn Reson Part B Magn Reson Eng. 2003; 19:26–34.
Article22. Abdul-Rahman HS, Gdeisat MA, Burton DR, Lalor MJ, Lilley F, Moore CJ. Fast and robust three-dimensional best path phase unwrapping algorithm. Appl Opt. 2007; 46:6623–6635.
Article23. Robinson S, Grabner G, Witoszynskyj S, Trattnig S. Combining phase images from multi-channel RF coils using 3D phase offset maps derived from a dual-echo scan. Magn Reson Med. 2011; 65:1638–1648.
Article24. van der Walt S, Colbert SC, Varoquaux G. The NumPy array: a structure for efficient numerical computation. Comput Sci Eng. 2011; 13:22–30.
Article25. Oliphant TE. SciPy: Open source scientific tools for Python. Comput Sci Eng. 2007; 9:10–20.26. Hunter JD. Matplotlib: A 2D graphics environment. Comput Sci Eng. 2007; 9:99–104.
Article27. Hunter JD. Matplotlib: A 2D graphic environment. Comput Sci Eng. 2007; 9:90–95.28. Nielles-Vallespin S, Weber MA, Bock M, et al. 3D radial projection technique with ultrashort echo times for sodium MRI: clinical applications in human brain and skeletal muscle. Magn Reson Med. 2007; 57:74–81.
Article29. Jackson JI, Meyer CH, Nishimura DG, Macovski A. Selection of a convolution function for Fourier inversion using gridding [computerised tomography application]. IEEE Trans Med Imaging. 1991; 10:473–478.
Article30. Johnson KO, Pipe JG. Convolution kernel design and efficient algorithm for sampling density correction. Magn Reson Med. 2009; 61:439–447.
Article31. Liu C, Li W, Tong KA, Yeom KW, Kuzminski S. Susceptibility-weighted imaging and quantitative susceptibility mapping in the brain. J Magn Reson Imaging. 2015; 42:23–41.
Article32. Schweser F, Deistung A, Lehr BW, Reichenbach JR. Quantitative imaging of intrinsic magnetic tissue properties using MRI signal phase: an approach to in vivo brain iron metabolism? Neuroimage. 2011; 54:2789–2807.
Article33. Schenck JF. The role of magnetic susceptibility in magnetic resonance imaging: MRI magnetic compatibility of the first and second kinds. Med Phys. 1996; 23:815–850.
Article34. Yu H, McKenzie CA, Shimakawa A, et al. Multiecho reconstruction for simultaneous water-fat decomposition and T2* estimation. J Magn Reson Imaging. 2007; 26:1153–1161.
Article35. Yu H, Shimakawa A, McKenzie CA, Brodsky E, Brittain JH, Reeder SB. Multiecho water-fat separation and simultaneous R2* estimation with multifrequency fat spectrum modeling. Magn Reson Med. 2008; 60:1122–1134.36. Speier P, Trautwein F. A calibration for radial imaging with large inplane shifts. In Proceedings of the 13th Annual Meeting of ISMRM, Miami Beach, Florida, USA. 2005. 2295.37. Speier P, Trautwein F. Robust radial imaging with predetermined isotropic gradient delay correction. In Proceedings of the 14th Annual Meeting of ISMRM, Seattle, Washington, USA. 2006. 2379.
- Full Text Links
-
- Actions
-
Cited
- CITED
-
- Close
- Share
-
- Similar articles
-
- Water-Fat Imaging with Automatic Field Inhomogeneity Correction Using Joint Phase Magnitude Density Function at Low Field MRI
- Tâ‚‚* Mapping from Multi-Echo Dixon Sequence on Gadoxetic Acid-Enhanced Magnetic Resonance Imaging for the Hepatic Fat Quantification: Can It Be Used for Hepatic Function Assessment?
- Higher Order Shimming for Ultra-fast Spiral-Scan Imaging at 3 Tesla MRI System
- Healthcare Information Technology: A Systematic Mapping Study
- Using Local Flaps in a Chest Wall Reconstruction after Mastectomy for Locally Advanced Breast Cancer
