Feasibility of fully automated classification of whole slide images based on deep learning
- Affiliations
-
- 1Department of Pharmacology, Seoul St. Mary's Hospital, Seoul 06591, Korea.
- 2Department of Biomedicine & Health Sciences, Seoul St. Mary's Hospital, Seoul 06591, Korea. hjjang@catholic.ac.kr
- 3Catholic Neuroscience Institute, Seoul St. Mary's Hospital, Seoul 06591, Korea.
- 4Department of Hospital Pathology, Seoul St. Mary's Hospital, Seoul 06591, Korea. hakjjang@catholic.ac.kr
- 5Department of Physiology, College of Medicine, The Catholic University of Korea, Seoul 06591, Korea.
- KMID: 2466573
- DOI: http://doi.org/10.4196/kjpp.2020.24.1.89
Abstract
- Although microscopic analysis of tissue slides has been the basis for disease diagnosis for decades, intra- and inter-observer variabilities remain issues to be resolved. The recent introduction of digital scanners has allowed for using deep learning in the analysis of tissue images because many whole slide images (WSIs) are accessible to researchers. In the present study, we investigated the possibility of a deep learning-based, fully automated, computer-aided diagnosis system with WSIs from a stomach adenocarcinoma dataset. Three different convolutional neural network architectures were tested to determine the better architecture for tissue classifier. Each network was trained to classify small tissue patches into normal or tumor. Based on the patch-level classification, tumor probability heatmaps can be overlaid on tissue images. We observed three different tissue patterns, including clear normal, clear tumor and ambiguous cases. We suggest that longer inspection time can be assigned to ambiguous cases compared to clear normal cases, increasing the accuracy and efficiency of histopathologic diagnosis by pre-evaluating the status of the WSIs. When the classifier was tested with completely different WSI dataset, the performance was not optimal because of the different tissue preparation quality. By including a small amount of data from the new dataset for training, the performance for the new dataset was much enhanced. These results indicated that WSI dataset should include tissues prepared from many different preparation conditions to construct a generalized tissue classifier. Thus, multi-national/multi-center dataset should be built for the application of deep learning in the real world medical practice.
Keyword
Figure
-

Fig. 1 Work flow of a fully automated tissue classifier for whole slide images (WSIs). (A) IDs of The Cancer Genome Atlas Stomach Adenocarcinoma (TCGA-STAD) tissue slides containing normal/tumor discriminators. Left panel: normal tissue slide. Right panel: tumor tissue slide. All tissues were stained with haematoxylin and eosin. (B) Small patches were collected from WSIs at 20× magnification for training. (C) A simple convolutional neural network (CNN) was trained to classify improper tissue patches as non-tissue. (D) Three different CNNs, AlexNet, ResNet-50 or Inception-v3, were trained to delineate normal or tumor tissue patches. (E) Based on the classification results, a heatmap of the probability for tumor tissue was overlaid on the WSI. (F) Summary diagram of the experimental procedures.
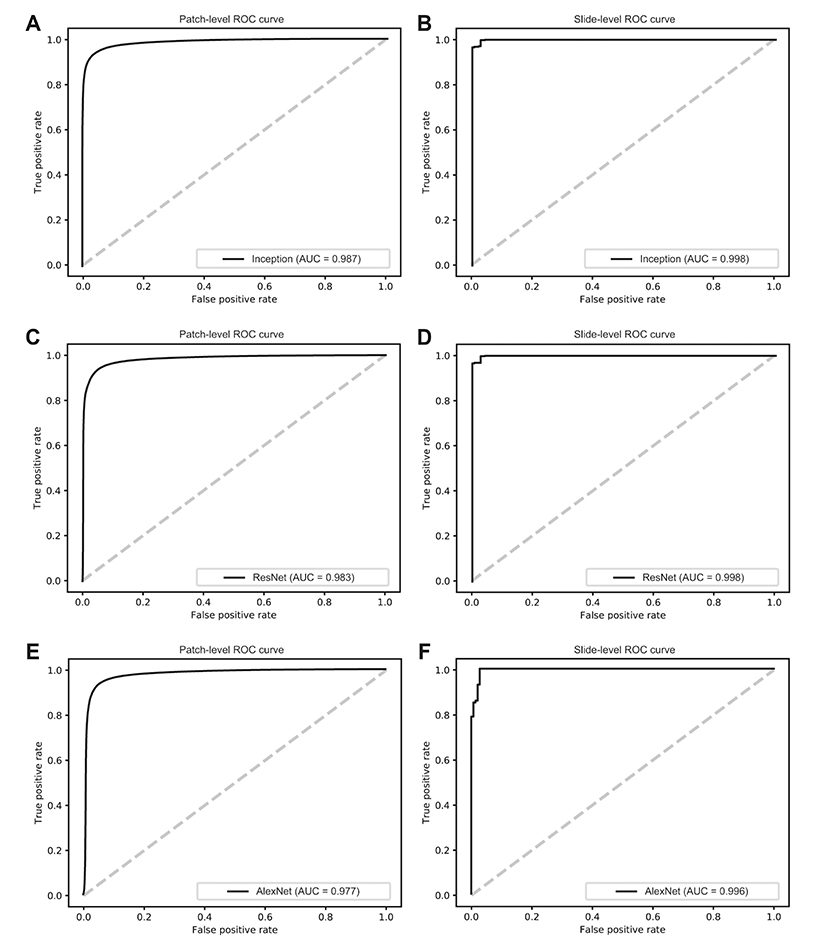
Fig. 2 Classification results for the three different networks on test sets. (A) Receiver operating characteristics (ROC) curve for the patch-level classification with Inception-v3. (B) ROC curve for the slide-level classification with Inception-v3. (C) ROC curve for the patch-level classification with ResNet-50. (D) ROC curve for the slide-level classification with ResNet-50. (E) ROC curve for the patch-level classification with AlexNet. (F) ROC curve for the slide-level classification with AlexNet. AUC, area under the curve.
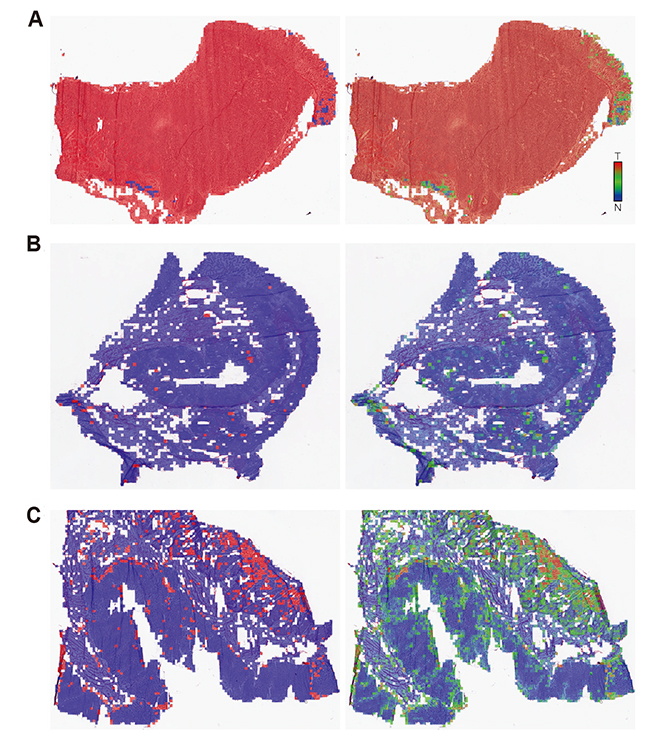
Fig. 3 Classification results overlaid on tissue images. Left panels are normal/tumor binary maps and right panels are probability heatmaps. Small rectangles represent 330 × 330 pixel patches. White spots are patches classified as non-tissue by the first convolutional neural network. Inset demonstrates color distribution between normal (N) and tumor (T).
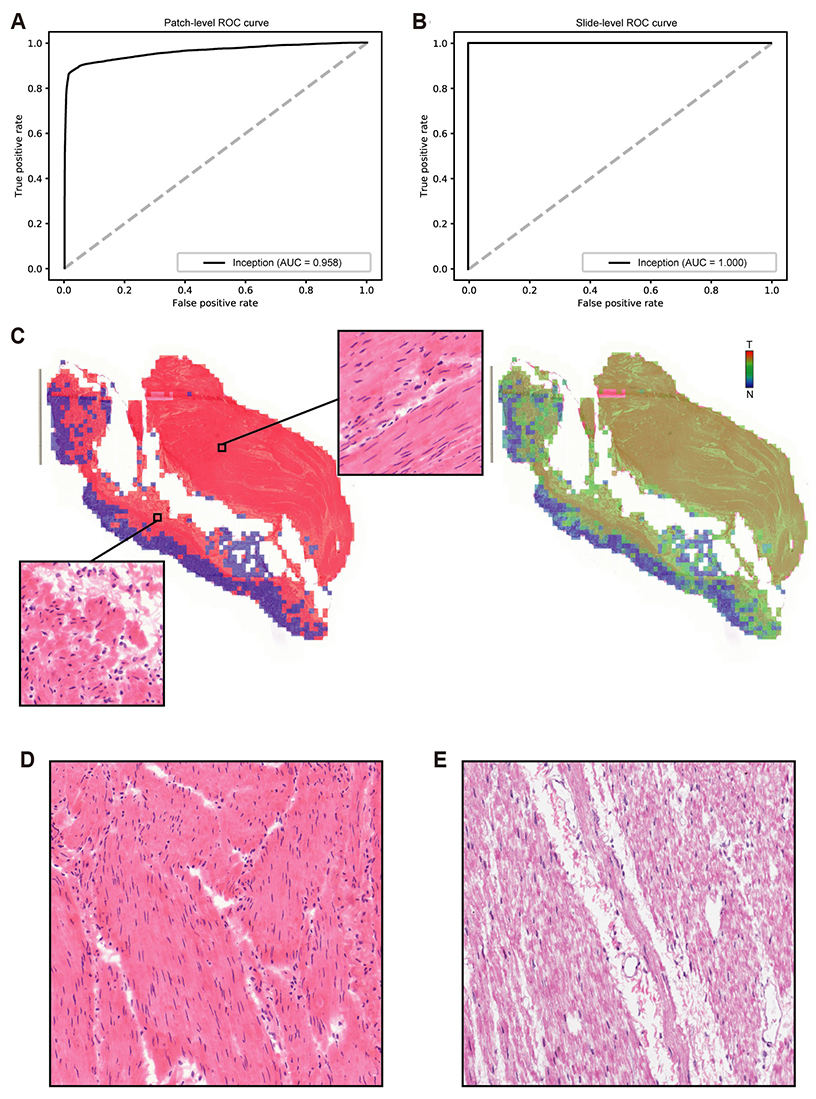
Fig. 4 Classification results of the Seoul St. Mary's Hospital Stomach Adenocarcinoma (SSMH-STAD) dataset by an Inception-v3 classifier trained with The Cancer Genome Atlas Stomach Adenocarcinoma (TCGA-STAD) dataset. (A) Receiver operating characteristics (ROC) curve for the patch-level classification. (B) ROC curve for the slide-level classification. (C) Exemplary normal tissue misclassified as tumor, overlaid with binary normal/tumor map (left panel) and probability heatmap (right panel). Insets were enlarged images (20×) for the indicated areas of the tissue stained with haematoxylin and eosin. (D) Example image of muscle tissue in the SSMH-STAD dataset. (E) Example image of muscle tissue in the TCGA-STAD dataset. AUC, area under the curve.
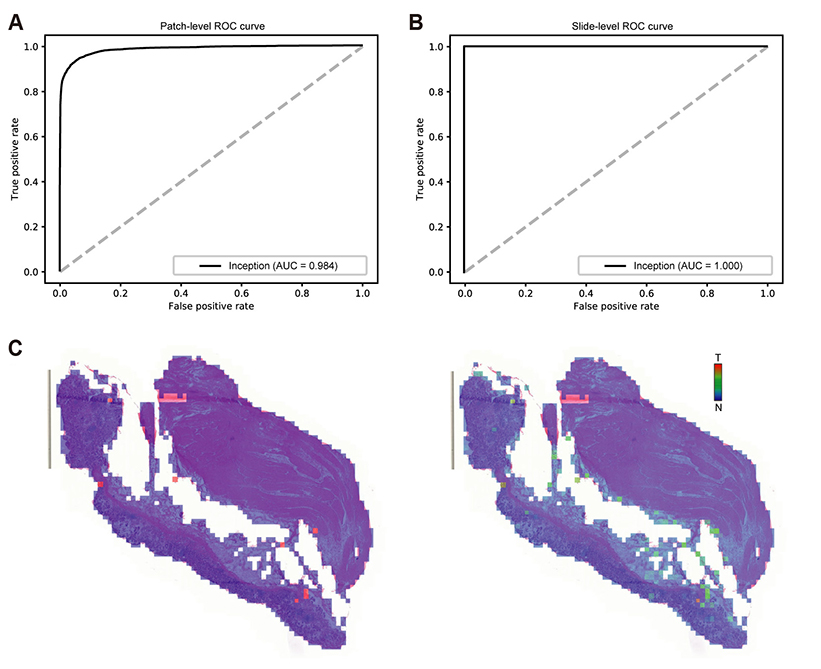
Fig. 5 Classification results of the Seoul St. Mary's Hospital Stomach Adenocarcinoma (SSMH-STAD) dataset by an Inception-v3 classifier trained with the mixed dataset of The Cancer Genome Atlas Stomach Adenocarcinoma (TCGA-STAD) and SSMH-STAD. (A) Receiver operating characteristics (ROC) curve for the patch-level classification. (B) ROC curve for the slide-level classification. (C) Exemplary tissue overlaid with binary normal/tumor map (left panel) and probability heatmap (right panel). AUC, area under the curve.
Reference
-
1. Fischer AH, Jacobson KA, Rose J, Zeller R. Hematoxylin and eosin staining of tissue and cell sections. CSH Protoc. 2008; 2008:pdb.prot4986.
Article2. Dalla Palma P, Giorgi Rossi P, Collina G, Buccoliero AM, Ghiringhello B, Gilioli E, Onnis GL, Aldovini D, Galanti G, Casadei G, Aldi M, Gomes VV, Giubilato P, Ronco G. NTCC Pathology Group. The reproducibility of CIN diagnoses among different pathologists: data from histology reviews from a multicenter randomized study. Am J Clin Pathol. 2009; 132:125–132.3. Hamilton PW, van Diest PJ, Williams R, Gallagher AG. Do we see what we think we see? The complexities of morphological assessment. J Pathol. 2009; 218:285–291.
Article4. Cheng J, Mo X, Wang X, Parwani A, Feng Q, Huang K. Identification of topological features in renal tumor microenvironment associated with patient survival. Bioinformatics. 2018; 34:1024–1030.
Article5. Djuric U, Zadeh G, Aldape K, Diamandis P. Precision histology: how deep learning is poised to revitalize histomorphology for personalized cancer care. NPJ Precis Oncol. 2017; 1:22.
Article6. Madabhushi A, Lee G. Image analysis and machine learning in digital pathology: challenges and opportunities. Med Image Anal. 2016; 33:170–175.
Article7. de Bruijne M. Machine learning approaches in medical image analysis: from detection to diagnosis. Med Image Anal. 2016; 33:94–97.
Article8. Chang HY, Jung CK, Woo JI, Lee S, Cho J, Kim SW, Kwak TY. Artificial Intelligence in Pathology. J Pathol Transl Med. 2019; 53:1–12.
Article9. LeCun Y, Bengio Y, Hinton G. Deep learning. Nature. 2015; 521:436–444.
Article10. Jang HJ, Cho KO. Applications of deep learning for the analysis of medical data. Arch Pharm Res. 2019; 42:492–504.
Article11. Gulshan V, Peng L, Coram M, Stumpe MC, Wu D, Narayanaswamy A, Venugopalan S, Widner K, Madams T, Cuadros J, Kim R, Raman R, Nelson PC, Mega JL, Webster DR. Development and validation of a deep learning algorithm for detection of diabetic retinopathy in retinal fundus photographs. JAMA. 2016; 316:2402–2410.
Article12. Lee JG, Jun S, Cho YW, Lee H, Kim GB, Seo JB, Kim N. Deep learning in medical imaging: general overview. Korean J Radiol. 2017; 18:570–584.
Article13. Janowczyk A, Madabhushi A. Deep learning for digital pathology image analysis: a comprehensive tutorial with selected use cases. J Pathol Inform. 2016; 7:29.
Article14. Kwon JM, Kim KH, Jeon KH, Kim HM, Kim MJ, Lim SM, Song PS, Park J, Choi RK, Oh BH. Development and validation of deep-learning algorithm for electrocardiography-based heart failure identification. Korean Circ J. 2019; 49:629–639.
Article15. Jang HJ, Cho KO. Dual deep neural network-based classifiers to detect experimental seizures. Korean J Physiol Pharmacol. 2019; 23:131–139.
Article16. Saltz J, Gupta R, Hou L, Kurc T, Singh P, Nguyen V, Samaras D, Shroyer KR, Zhao T, Batiste R, Van Arnam J, Shmulevich I, Rao AUK, Lazar AJ, Sharma A, Thorsson V. Cancer Genome Atlas Research Network. Spatial organization and molecular correlation of tumor-infiltrating lymphocytes using deep learning on pathology images. Cell Rep. 2018; 23:181–193.17. Cooper LA, Demicco EG, Saltz JH, Powell RT, Rao A, Lazar AJ. PanCancer insights from the cancer genome atlas: the pathologist's perspective. J Pathol. 2018; 244:512–524.
Article18. Senaras C, Niazi MKK, Lozanski G, Gurcan MN. DeepFocus: detection of out-of-focus regions in whole slide digital images using deep learning. PLoS One. 2018; 13:e0205387.
Article19. Kim JH, Hong JS, Park HJ. Prospects of deep learning for medical imaging. Precis Future Med. 2018; 2:37–52.
Article20. Cancer Genome Atlas Research Network. Comprehensive molecular profiling of lung adenocarcinoma. Nature. 2014; 511:543–550.21. Cancer Genome Atlas Research Network. Comprehensive genomic characterization of squamous cell lung cancers. Nature. 2012; 489:519–525.22. Khan A, Sohail A, Zahoora U, Qureshi AS. A survey of the recent architectures of deep convolutional neural networks. arXiv.1901.06032 [Preprint]. 2019. Available from: https://arxiv.org/abs/1901.06032.23. Glasziou P. The statistical evaluation of medical tests for classification and prediction. Stat Med. 2005; 24:2582.24. Venkatraman ES. A permutation test to compare receiver operating characteristic curves. Biometrics. 2000; 56:1134–1138.
Article25. Krizhevsky A, Sutskever I, Hinton G. Imagenet classification with deep convolutional neural networks. In : Bartlett P, Pereira FCN, Burges CJC, Bottou L, Weinberger KQ, editors. Advances in neural information processing systems 25: 26th annual conference on neural information processing systems 2012. Red Hook: Curran Associates Inc.;2012.26. Szegedy C, Liu W, Jia Y, Sermanet P, Reed S, Anguelov D, Erhan D, Vanhoucke V, Rabinovich A. Going deeper with convolutions. arXiv. 1409.4842 [Preprint]. 2014. Available from: https://arxiv.org/abs/1409.4842.27. Yu KH, Zhang C, Berry GJ, Altman RB, Ré C, Rubin DL, Snyder M. Predicting non-small cell lung cancer prognosis by fully automated microscopic pathology image features. Nat Commun. 2016; 7:12474.
Article28. Ehteshami Bejnordi B, Veta M, Johannes van Diest P, van Ginneken B, Karssemeijer N, Litjens G, van der Laak JAWM. the CAM-ELYON16 Consortium. Diagnostic assessment of deep learning algorithms for detection of lymph node metastases in women with breast cancer. JAMA. 2017; 318:2199–2210.29. Hamilton PW, Bankhead P, Wang Y, Hutchinson R, Kieran D, McArt DG, James J, Salto-Tellez M. Digital pathology and image analysis in tissue biomarker research. Methods. 2014; 70:59–73.
Article30. Kather JN, Pearson AT, Halama N, Jäger D, Krause J, Loosen SH, Marx A, Boor P, Tacke F, Neumann UP, Grabsch HI, Yoshikawa T, Brenner H, Chang-Claude J, Hoffmeister M, Trautwein C, Luedde T. Deep learning can predict microsatellite instability directly from histology in gastrointestinal cancer. Nat Med. 2019; 25:1054–1056.
Article
- Full Text Links
-
- Actions
-
Cited
- CITED
-
- Close
- Share
-
- Similar articles
-
- Deep learning approach for classification of chondrocytes in rats
- Classification of Mouse Lung Metastatic Tumor with Deep Learning
- Deep Learning in Dental Radiographic Imaging
- Deep-Learning-Based Molecular Imaging Biomarkers: Toward Data-Driven Theranostics
- Deep Learning Based Radiographic Classification of Morphology and Severity of Peri-implantitis Bone Defects: A Preliminary Pilot Study
