Quantitative Imaging in Pediatric Hepatobiliary Disease
- Affiliations
-
- 1Department of Radiology, Severance Hospital, Severance Pediatric Liver Disease Research Group, Research Institute of Radiological Science, Yonsei University College of Medicine, Seoul, Korea. mjl1213@yuhs.ac
- KMID: 2455763
- DOI: http://doi.org/10.3348/kjr.2019.0002
Abstract
- Pediatric hepatobiliary imaging is important for evaluation of not only congenital or structural disease but also metabolic or diffuse parenchymal disease and tumors. A variety of ultrasonography and magnetic resonance imaging (MRI) techniques can be used for these assessments. In ultrasonography, conventional ultrasound imaging as well as vascular imaging, elastography, and contrast-enhanced ultrasonography can be used, while in MRI, fat quantification, T2/T2* mapping, diffusion-weighted imaging, magnetic resonance elastography, and dynamic contrast-enhanced MRI can be performed. These techniques may be helpful for evaluation of biliary atresia, hepatic fibrosis, nonalcoholic fatty liver disease, sinusoidal obstruction syndrome, and hepatic masses in children. In this review, we discuss each tool in the context of management of hepatobiliary disease in children, and cover various imaging techniques in the context of the relevant physics and their clinical applications for patient care.
MeSH Terms
Figure
-
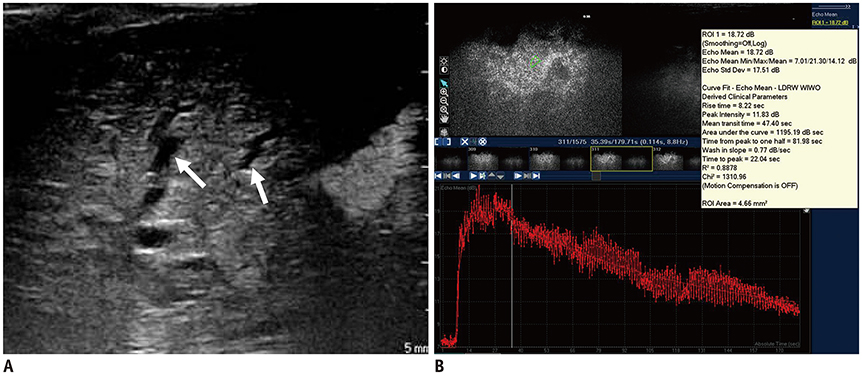
Fig. 1 Animal model of biliary obstruction for hepatic fibrosis evaluation. A. Liver ultrasonography after bile duct ligation in rabbit shows diffuse intrahepatic bile duct dilatation (arrows). B. Contrast-enhanced ultrasonography of liver shows perfusion curve of liver parenchymal enhancement. Peak signal intensity was 11.83 dB in this case and hepatic fibrosis grade was 2. LDRW WIWO = local density random walk wash in wash out, ROI = region of interest
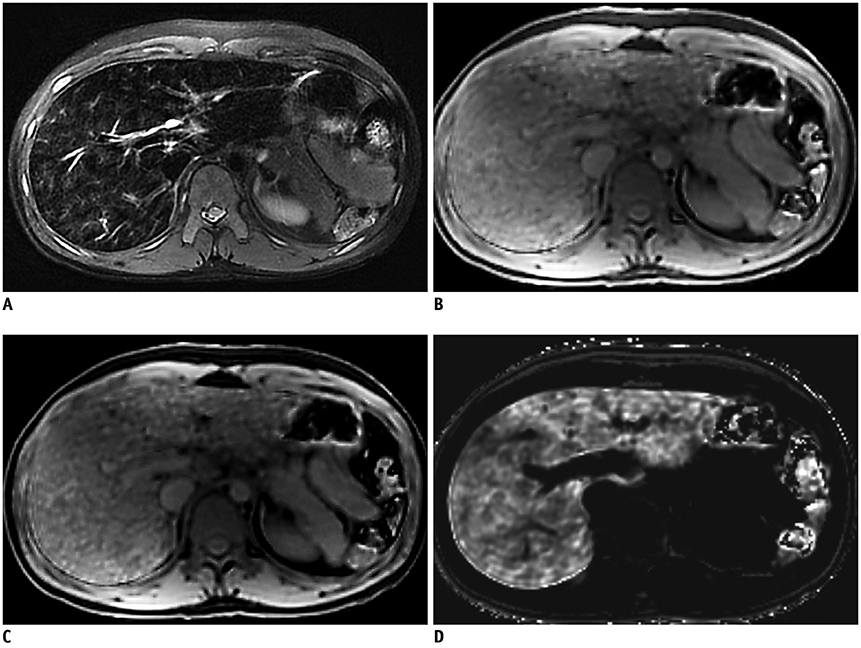
Fig. 2 16-year-old male with hemolytic anemia and diffuse siderosis after splenectomy. A. Axial T2-weighted MR image shows diffusely decreased T2 signal intensity of liver parenchyma. In-phase (B) and opposed-phase (C) T1-weighted gradient-recalled echo images show no remarkable signal decrease on opposed-phase image. D. R2* parametric map demonstrates mild degree of iron overload in liver with R2* value of 329 s-1 at 3T MRI. MR = magnetic resonance
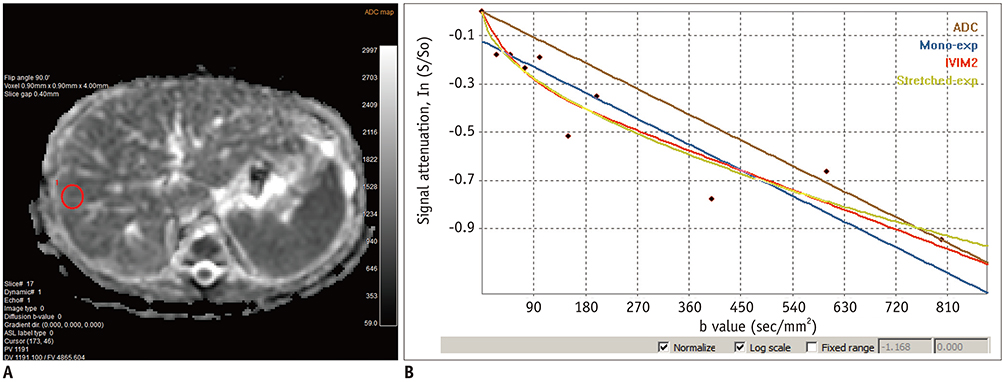
Fig. 3 2-month-old girl with biliary atresia. A. Liver MRI with mono-, bi-, and stretched exponential model DWI shows red circular ROI in liver parenchyma. B. Curves can be obtained according to models. From these models, ADC value was 1.2 × 10⁻³ mm2/s, D* value was 19.6 × 10⁻³ mm2/s, f value was 0.2, D was 0.9 × 10⁻³ mm2/s, distributed diffusion coefficient was 1.1 × 10⁻³ mm2/s, and α value was 0.5. ADC = apparent diffusion coefficient, D = true diffusion, D* = pseudo-diffusion, DWI = diffusion-weighted imaging, f = perfusion fraction, α = heterogeneity index
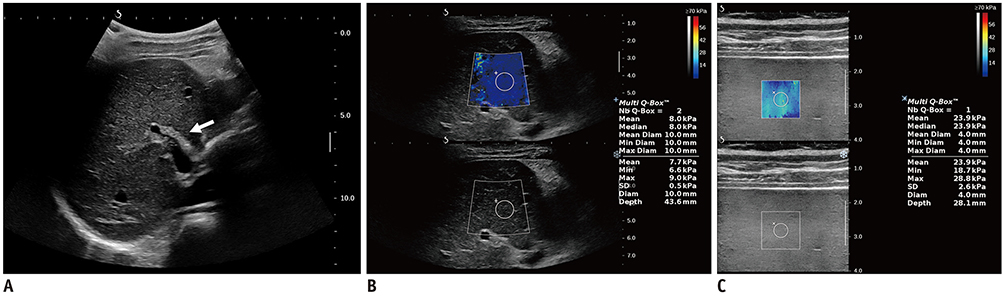
Fig. 4 12-year-old girl with liver fibrosis after Kasai operation for biliary atresia. A. Liver shows periportal hyperechogenicity (arrow) with left lobe atrophic change and lobulated contour. B. Shear wave elastography image of liver shows blue color in acquisition box with measured mean elasticity value of 8.0 kPa. Value in transient elastography was 7.7 kPa (not shown). C. Patient showed splenomegaly considering her age (more than 11.6 cm, not shown), and spleen shear wave elastography value was 23.9 kPa.
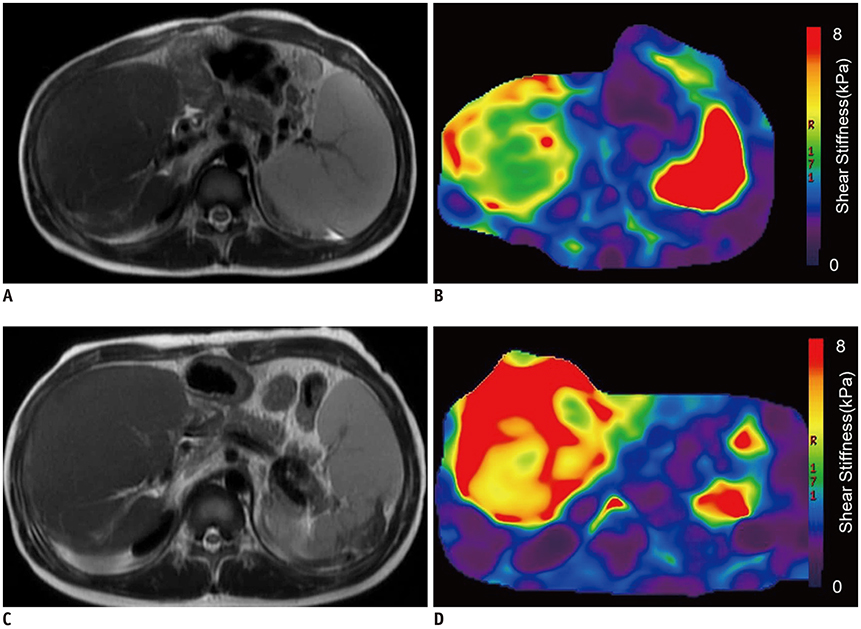
Fig. 5 9-year-old girl with biliary atresia after Kasai operation and grade 2 gastroesophageal varices. A. Axial T2-weighted imaging of liver shows hypertrophied right lobe and atrophic left lobe of liver with splenomegaly and engorged portal collateral vessels. B. Color map in MR elastography shows green to red color of liver, indicating increased stiffness. Measured mean liver elasticity was 4.1 kPa. C. Two years later, axial T2-weighted MR image shows aggravated liver cirrhosis with partial splenic artery embolization status in this patient. D. On follow-up MR elastography imaging, liver stiffness further increased, with mean value of 6.9 kPa. This patient underwent liver transplantation 2 months after last exam.
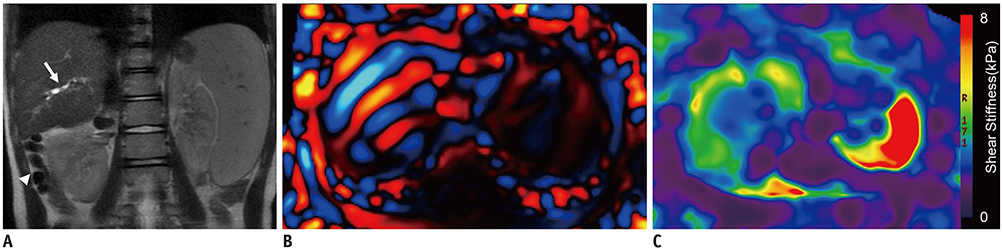
Fig. 6 9-year-old boy with biliary atresia and previous Kasai operation. A. Coronal single-shot fast spin-echo T2-weighted image shows multiple tiny intrahepatic biliary cysts (arrow) in liver and splenomegaly. Patient also showed engorged mesenteric veins (arrowhead) at right subhepatic area, suggesting portosystemic collateral pathways. B. MR elastography wave image shows thick blue and red waves within liver, consistent with elevated shear wave speed (increased wavelength), reflective of liver stiffness. C. MR elastogram color map shows blue to green color of liver and red color of spleen. Measured hepatic stiffness was 3.2 kPa and spleen stiffness was 10.7 kPa.
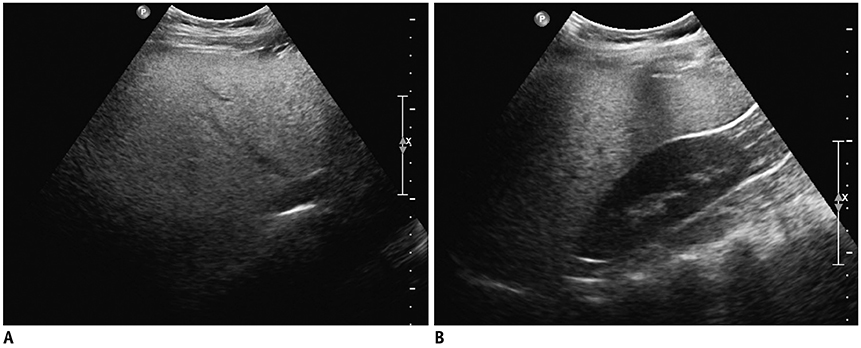
Fig. 7 10-year-old boy with fatty liver. A. Grayscale image obtained with liver ultrasonography demonstrates hepatomegaly with diffusely increased liver parenchymal echo, indistinct hepatic veins, and poor diaphragm visualization. B. Longitudinal scan of liver including right kidney shows echo difference and hepatorenal ratio of 2.3, which is above cutoff value of 1.5 in children. On liver MRI, hepatic fat fraction was 32%.
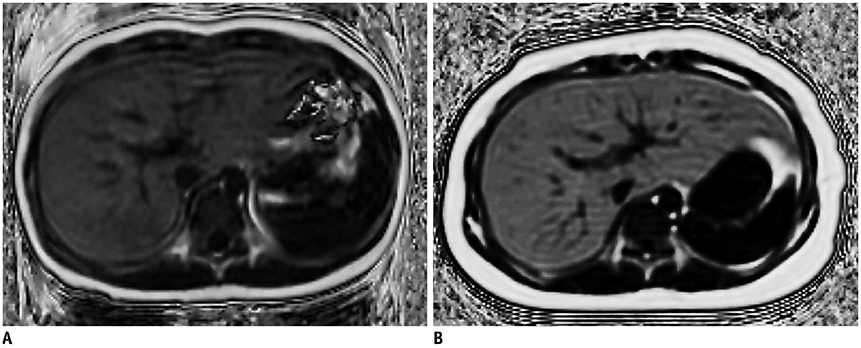
Fig. 8 11-year-old boy with hepatic steatosis. MR proton density fat fraction of liver was 31% when patient was 6 years old (A) and increased to 51%, 5 years later (B).
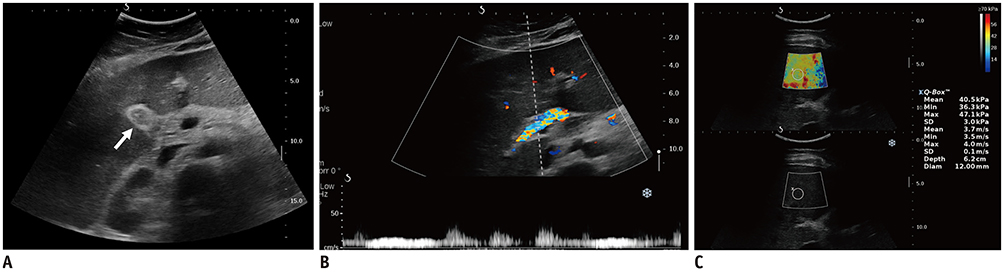
Fig. 9 13-year-old girl with sinusoidal obstruction syndrome or veno-occlusive disease. A. Transverse ultrasound image of liver shows hepatomegaly with periportal edema and collapsed gallbladder wall edema (arrow). There was moderate amount of ascites (not shown). B. Doppler image of liver hilum shows decreased portal vein flow. C. Shear wave elastography image of liver shows yellow to red color in acquisition box with measured mean elasticity value of 40.5 kPa.

Fig. 10 4-month-old girl with hepatic masses. A. Multiple high signal intensity masses are noted in liver on T2-weighted image. B. On DWI, masses show high signal intensity on high b-value. C. On ADC map, masses show low ADC value, indicating that they are malignant. Masses were confirmed as hepatoblastoma.
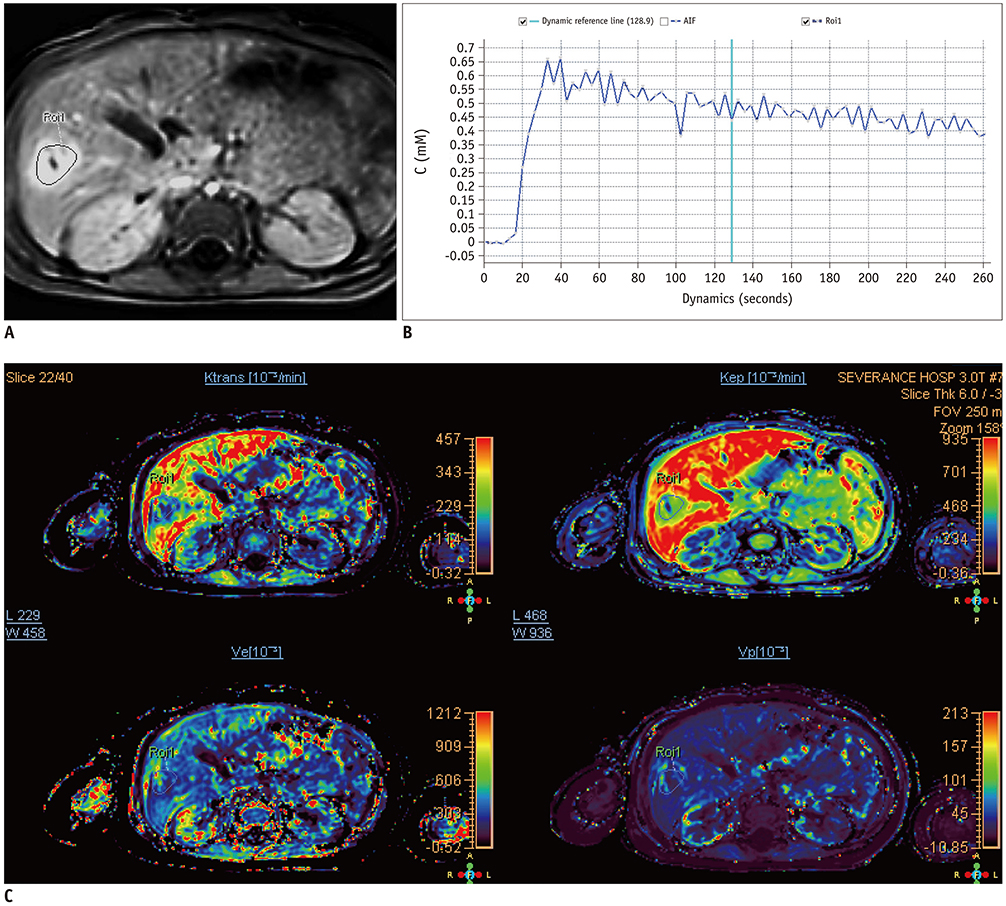
Fig. 11 3-month-old boy with liver hemangioma. A. DCE MRI of liver shows enhancing mass lesions in right lobe with central non-enhancing portion. B. When drawing ROI in mass lesion as in (A), slope showing early arterial and persistent enhancement was obtained. C. Values obtained from multi-parametric maps were as follows: Ktrans = 174.3 × 10⁻³/min, Kep = 490.9 × 10⁻³/min, Ve = 355.1 × 10⁻³, and Vp = 41.6 × 10⁻³. AIF = arterial input function, DCE = dynamic contrast-enhanced, Kep = rate constant (Ktrans/Ve), Ktrans = volume transfer constant between plasma and extravascular extracellular space, Ve = volume of extracellular compartment, Vp = volume of plasma compartment
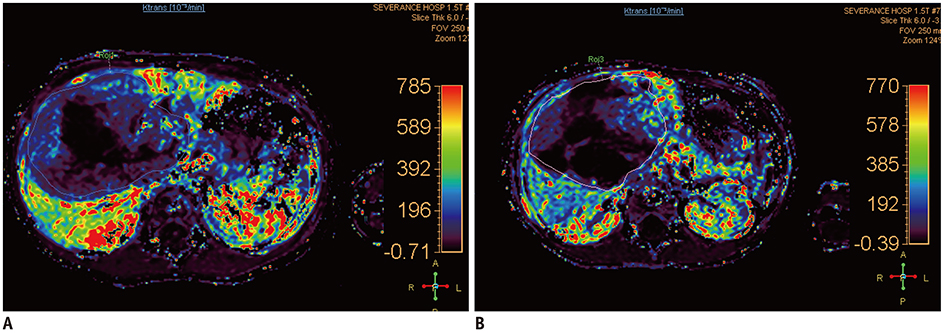
Fig. 12 4-year-old girl with hepatoblastoma. A. At initial liver DCE MRI of hepatoblastoma, Ktrans was 86.7 × 10⁻³/min. B. Follow-up DCE MRI shows treatment response. At 3 months after chemotherapy, tumor size had decreased and Ktrans had also decreased to 70.6 × 10⁻³/min.
Cited by 1 articles
-
Comparison of One- and Two-Region of Interest Strain Elastography Measurements in the Differential Diagnosis of Breast Masses
Hee Jeong Park, Sun Mi Kim, Bo La Yun, Mijung Jang, Bohyoung Kim, Soo Hyun Lee, Hye Shin Ahn
Korean J Radiol. 2020;21(4):431-441. doi: 10.3348/kjr.2019.0479.
Reference
-
1. Gubernick JA, Rosenberg HK, Ilaslan H, Kessler A. US approach to jaundice in infants and children. Radiographics. 2000; 20:173–195.
Article2. Ozturk A, Grajo JR, Gee MS, Benjamin A, Zubajlo RE, Thomenius KE, et al. Quantitative hepatic fat quantification in non-alcoholic fatty liver disease using ultrasound-based techniques: a review of literature and their diagnostic performance. Ultrasound Med Biol. 2018; 44:2461–2475.
Article3. Megremis SD, Vlachonikolis IG, Tsilimigaki AM. Spleen length in childhood with US: normal values based on age, sex, and somatometric parameters. Radiology. 2004; 231:129–134.
Article4. Lee YS, Kim MJ, Han SW, Lee HS, Im YJ, Shin HJ, et al. Superb microvascular imaging for the detection of parenchymal perfusion in normal and undescended testes in young children. Eur J Radiol. 2016; 85:649–656.
Article5. Dietrich CF, Trenker C, Fontanilla T, Görg C, Hausmann A, Klein S, et al. New ultrasound techniques challenge the diagnosis of sinusoidal obstruction syndrome. Ultrasound Med Biol. 2018; 44:2171–2182.
Article6. Chang S, Kim MJ, Kim J, Lee MJ. Variability of shear wave velocity using different frequencies in acoustic radiation force impulse (ARFI) elastography: a phantom and normal liver study. Ultraschall Med. 2013; 34:260–265.
Article7. Shin HJ, Kim MJ, Kim HY, Roh YH, Lee MJ. Comparison of shear wave velocities on ultrasound elastography between different machines, transducers, and acquisition depths: a phantom study. Eur Radiol. 2016; 26:3361–3367.
Article8. Shin HJ, Kim MJ, Kim HY, Roh YH, Lee MJ. Optimal acquisition number for hepatic shear wave velocity measurements in children. PLoS One. 2016; 11:e0168758.
Article9. Kim YY, Kim MJ, Shin HJ, Yoon H, Kim HY, Lee MJ. Interconversion of elasticity measurements between two-dimensional shear wave elastography and transient elastography. Med Ultrason. 2018; 20:127–133.
Article10. Galina P, Alexopoulou E, Zellos A, Grigoraki V, Siahanidou T, Kelekis NL, et al. Performance of two--dimensional ultrasound shear wave elastography: reference values of normal liver stiffness in children. Pediatr Radiol. 2019; 49:91–98.
Article11. Lee MJ, Kim MJ, Han KH, Yoon CS. Age-related changes in liver, kidney, and spleen stiffness in healthy children measured with acoustic radiation force impulse imaging. Eur J Radiol. 2013; 82:e290–e294.
Article12. Ntoulia A, Anupindi SA, Darge K, Back SJ. Applications of contrast-enhanced ultrasound in the pediatric abdomen. Abdom Radiol (NY). 2018; 43:948–959.
Article13. Sidhu PS, Cantisani V, Deganello A, Dietrich CF, Duran C, Franke D, et al. Role of contrast-enhanced ultrasound (CEUS) in paediatric practice: an EFSUMB position statement. Ultraschall Med. 2017; 38:33–43.
Article14. Laugesen NG, Nolsoe CP, Rosenberg J. Clinical applications of contrast-enhanced ultrasound in the pediatric work-up of focal liver lesions and blunt abdominal trauma: a systematic review. Ultrasound Int Open. 2017; 3:E2–E7.
Article15. Shin HJ, Chang EY, Lee HS, Hong JH, Park G, Kim HG, et al. Contrast-enhanced ultrasonography for the evaluation of liver fibrosis after biliary obstruction. World J Gastroenterol. 2015; 21:2614–2621.
Article16. Towbin AJ, Serai SD, Podberesky DJ. Magnetic resonance imaging of the pediatric liver: imaging of steatosis, iron deposition, and fibrosis. Magn Reson Imaging Clin N Am. 2013; 21:669–680.17. Ma X, Holalkere NS, Kambadakone RA, Mino-Kenudson M, Hahn PF, Sahani DV. Imaging-based quantification of hepatic fat: methods and clinical applications. Radiographics. 2009; 29:1253–1277.
Article18. Shin HJ, Kim HG, Kim MJ, Koh H, Kim HY, Roh YH, et al. Normal range of hepatic fat fraction on dual- and triple-echo fat quantification MR in children. PLoS One. 2015; 10:e0117480.
Article19. Wood JC. Magnetic resonance imaging measurement of iron overload. Curr Opin Hematol. 2007; 14:183–190.
Article20. Wood JC, Ghugre N. Magnetic resonance imaging assessment of excess iron in thalassemia, sickle cell disease and other iron overload diseases. Hemoglobin. 2008; 32:85–96.
Article21. McCarville MB, Hillenbrand CM, Loeffler RB, Smeltzer MP, Song R, Li CS, et al. Comparison of whole liver and small region-of-interest measurements of MRI liver R2* in children with iron overload. Pediatr Radiol. 2010; 40:1360–1367.22. Sirlin CB, Reeder SB. Magnetic resonance imaging quantification of liver iron. Magn Reson Imaging Clin N Am. 2010; 18:359–381. ix
Article23. Henninger B, Kremser C, Rauch S, Eder R, Zoller H, Finkenstedt A, et al. Evaluation of MR imaging with T1 and T2* mapping for the determination of hepatic iron overload. Eur Radiol. 2012; 22:2478–2486.24. Labranche R, Gilbert G, Cerny M, Vu KN, Soulières D, Olivié D, et al. Liver iron quantification with MR imaging: a primer for radiologists. Radiographics. 2018; 38:392–412.
Article25. Storey P, Thompson AA, Carqueville CL, Wood JC, de Freitas RA, Rigsby CK. R2* imaging of transfusional iron burden at 3T and comparison with 1.5T. J Magn Reson Imaging. 2007; 25:540–547.26. Chavhan GB, Alsabban Z, Babyn PS. Diffusion-weighted imaging in pediatric body MR imaging: principles, technique, and emerging applications. Radiographics. 2014; 34:E73–E88.
Article27. Malayeri AA, El Khouli RH, Zaheer A, Jacobs MA, Corona-Villalobos CP, Kamel IR, et al. Principles and applications of diffusion-weighted imaging in cancer detection, staging, and treatment follow-up. Radiographics. 2011; 31:1773–1791.
Article28. Courtier J, Rao AG, Anupindi SA. Advanced imaging techniques in pediatric body MRI. Pediatr Radiol. 2017; 47:522–533.
Article29. Kanematsu M, Goshima S, Watanabe H, Kondo H, Kawada H, Noda Y, et al. Diffusion/perfusion MR imaging of the liver: practice, challenges, and future. Magn Reson Med Sci. 2012; 11:151–161.
Article30. Bennett KM, Schmainda KM, Bennett RT, Rowe DB, Lu H, Hyde JS. Characterization of continuously distributed cortical water diffusion rates with a stretched-exponential model. Magn Reson Med. 2003; 50:727–734.
Article31. Mazaheri Y, Hötker AM, Shukla-Dave A, Akin O, Hricak H. Model selection for high b-value diffusion-weighted MRI of the prostate. Magn Reson Imaging. 2018; 46:21–27.
Article32. Seo N, Chung YE, Park YN, Kim E, Hwang J, Kim MJ. Liver fibrosis: stretched exponential model outperforms mono-exponential and bi-exponential models of diffusion-weighted MRI. Eur Radiol. 2018; 28:2812–2822.
Article33. Goo HW, Ra YS. Advanced MRI for pediatric brain tumors with emphasis on clinical benefits. Korean J Radiol. 2017; 18:194–207.
Article34. Saito K, Tajima Y, Harada TL. Diffusion-weighted imaging of the liver: current applications. World J Radiol. 2016; 8:857–867.
Article35. Jerome NP, Miyazaki K, Collins DJ, Orton MR, d'Arcy JA, Wallace T, et al. Repeatability of derived parameters from histograms following non-Gaussian diffusion modelling of diffusion-weighted imaging in a paediatric oncological cohort. Eur Radiol. 2017; 27:345–353.
Article36. Sui Y, Wang H, Liu G, Damen FW, Wanamaker C, Li Y, et al. Differentiation of low- and high-grade pediatric brain tumors with high b-value diffusion-weighted MR imaging and a fractional order calculus model. Radiology. 2015; 277:489–496.37. Binkovitz LA, El-Youssef M, Glaser KJ, Yin M, Binkovitz AK, Ehman RL. Pediatric MR elastography of hepatic fibrosis: principles, technique and early clinical experience. Pediatr Radiol. 2012; 42:402–409.
Article38. Serai SD, Towbin AJ, Podberesky DJ. Pediatric liver MR elastography. Dig Dis Sci. 2012; 57:2713–2719.
Article39. Venkatesh SK, Ehman RL. Magnetic resonance elastography of liver. Magn Reson Imaging Clin N Am. 2014; 22:433–446.40. Wagner M, Besa C, Bou Ayache J, Yasar TK, Bane O, Fung M, et al. Magnetic resonance elastography of the liver: qualitative and quantitative comparison of gradient echo and spin echo echoplanar imaging sequences. Invest Radiol. 2016; 51:575–581.41. Serai SD, Dillman JR, Trout AT. Spin-echo echo-planar imaging MR elastography versus gradient-echo MR elastography for assessment of liver stiffness in children and young adults suspected of having liver disease. Radiology. 2017; 282:761–770.
Article42. Manduca A, Oliphant TE, Dresner MA, Mahowald JL, Kruse SA, Amromin E, et al. Magnetic resonance elastography: non-invasive mapping of tissue elasticity. Med Image Anal. 2001; 5:237–254.
Article43. Yin M, Talwalkar JA, Glaser KJ, Venkatesh SK, Chen J, Manduca A, et al. Dynamic postprandial hepatic stiffness augmentation assessed with MR elastography in patients with chronic liver disease. AJR Am J Roentgenol. 2011; 197:64–70.
Article44. Serai SD, Obuchowski NA, Venkatesh SK, Sirlin CB, Miller FH, Ashton E, et al. Repeatability of MR elastography of liver: a meta-analysis. Radiology. 2017; 285:92–100.45. Joshi M, Dillman JR, Towbin AJ, Serai SD, Trout AT. MR elastography: high rate of technical success in pediatric and young adult patients. Pediatr Radiol. 2017; 47:838–843.
Article46. Trout AT, Serai S, Mahley AD, Wang H, Zhang Y, Zhang B, et al. Liver stiffness measurements with MR elastography: agreement and repeatability across imaging systems, field strengths, and pulse sequences. Radiology. 2016; 281:793–804.47. Gaddikeri S, Gaddikeri RS, Tailor T, Anzai Y. Dynamic contrast-enhanced MR imaging in head and neck cancer: techniques and clinical applications. AJNR Am J Neuroradiol. 2016; 37:588–595.
Article48. Khalifa F, Soliman A, El-Baz A, Abou El-Ghar M, El-Diasty T, Gimel'farb G, et al. Models and methods for analyzing DCE-MRI: a review. Med Phys. 2014; 41:124301.
Article49. Azahaf M, Haberley M, Betrouni N, Ernst O, Behal H, Duhamel A, et al. Impact of arterial input function selection on the accuracy of dynamic contrast-enhanced MRI quantitative analysis for the diagnosis of clinically significant prostate cancer. J Magn Reson Imaging. 2016; 43:737–749.
Article50. Jahng GH, Li KL, Ostergaard L, Calamante F. Perfusion magnetic resonance imaging: a comprehensive update on principles and techniques. Korean J Radiol. 2014; 15:554–577.
Article51. Do RK, Rusinek H, Taouli B. Dynamic contrast-enhanced MR imaging of the liver: current status and future directions. Magn Reson Imaging Clin N Am. 2009; 17:339–349.
Article52. Wu Z, Cheng ZL, Yi ZL, Xie MW, Zeng H, Lu LJ, et al. Assessment of nonalcoholic fatty liver disease in rats using quantitative dynamic contrast-enhanced MRI. J Magn Reson Imaging. 2017; 45:1485–1493.
Article53. Li Z, Sun J, Chen L, Huang N, Hu P, Hu X, et al. Assessment of liver fibrosis using pharmacokinetic parameters of dynamic contrast-enhanced magnetic resonance imaging. J Magn Reson Imaging. 2016; 44:98–104.
Article54. Paldino MJ, Barboriak DP. Fundamentals of quantitative dynamic contrast-enhanced MR imaging. Magn Reson Imaging Clin N Am. 2009; 17:277–289.
Article55. Hyodo T, Yada N, Hori M, Maenishi O, Lamb P, Sasaki K, et al. Multimaterial decomposition algorithm for the quantification of liver fat content by using fast-kilovolt-peak switching dual-energy CT: clinical evaluation. Radiology. 2017; 283:108–118.
Article56. Siegel MJ, Curtis WA, Ramirez-Giraldo JC. Effects of dual-energy technique on radiation exposure and image quality in pediatric body CT. AJR Am J Roentgenol. 2016; 207:826–835.
Article57. Leschied JR, Dillman JR, Bilhartz J, Heider A, Smith EA, Lopez MJ. Shear wave elastography helps differentiate biliary atresia from other neonatal/infantile liver diseases. Pediatr Radiol. 2015; 45:366–375.
Article58. Wang X, Qian L, Jia L, Bellah R, Wang N, Xin Y, et al. Utility of shear wave elastography for differentiating biliary atresia from infantile hepatitis syndrome. J Ultrasound Med. 2016; 35:1475–1479.
Article59. Zhou LY, Jiang H, Shan QY, Chen D, Lin XN, Liu BX, et al. Liver stiffness measurements with supersonic shear wave elastography in the diagnosis of biliary atresia: a comparative study with grey-scale US. Eur Radiol. 2017; 27:3474–3484.
Article60. Lee MJ, Kim MJ, Yoon CS, Han SJ, Park YN. Evaluation of liver fibrosis with T2 relaxation time in infants with cholestasis: comparison with normal controls. Pediatr Radiol. 2011; 41:350–354.
Article61. Mo YH, Jaw FS, Ho MC, Wang YC, Peng SS. Hepatic ADC value correlates with cirrhotic severity of patients with biliary atresia. Eur J Radiol. 2011; 80:e253–e257.
Article62. Peng SS, Jeng YM, Hsu WM, Yang JC, Ho MC. Hepatic ADC map as an adjunct to conventional abdominal MRI to evaluate hepatic fibrotic and clinical cirrhotic severity in biliary atresia patients. Eur Radiol. 2015; 25:2992–3002.
Article63. Shin HJ, Yoon H, Kim MJ, Han SJ, Koh H, Kim S, et al. Liver intravoxel incoherent motion diffusion-weighted imaging for the assessment of hepatic steatosis and fibrosis in children. World J Gastroenterol. 2018; 24:3013–3020.
Article64. Franchi-Abella S, Corno L, Gonzales E, Antoni G, Fabre M, Ducot B, et al. Feasibility and diagnostic accuracy of supersonic shear-wave elastography for the assessment of liver stiffness and liver fibrosis in children: a pilot study of 96 patients. Radiology. 2016; 278:554–562.
Article65. Kim DW, Yoon HM, Jung AY, Lee JS, Oh SH, Kim KM, et al. Diagnostic performance of ultrasound elastography for evaluating portal hypertension in children: a systematic review and meta-analysis. J Ultrasound Med. 2019; 38:747–759.
Article66. Hwang JY, Yoon HM, Kim JR, Lee JS, Jung AY, Kim KM, et al. Diagnostic performance of transient elastography for liver fibrosis in children: a systematic review and meta-analysis. AJR Am J Roentgenol. 2018; 211:W257–W266.
Article67. Burak Özkan M, Bilgici MC, Eren E, Caltepe G. Diagnostic accuracy of point shear wave elastography in the detection of portal hypertension in pediatric patients. Diagn Interv Imaging. 2018; 99:151–156.
Article68. Singh S, Venkatesh SK, Wang Z, Miller FH, Motosugi U, Low RN, et al. Diagnostic performance of magnetic resonance elastography in staging liver fibrosis: a systematic review and meta-analysis of individual participant data. Clin Gastroenterol Hepatol. 2015; 13:440–451.e6.
Article69. Xanthakos SA, Podberesky DJ, Serai SD, Miles L, King EC, Balistreri WF, et al. Use of magnetic resonance elastography to assess hepatic fibrosis in children with chronic liver disease. J Pediatr. 2014; 164:186–188.
Article70. Yoon H, Shin HJ, Kim MJ, Han SJ, Koh H, Kim S, et al. Predicting gastroesophageal varices through spleen magnetic resonance elastography in pediatric liver fibrosis. World J Gastroenterol. 2019; 25:367–377.
Article71. Erdem Toslak I, Lim-Dunham JE, Joyce C, Marbella ME. A practical approach to quantitative grayscale ultrasound analysis of hepatic steatosis in pediatric patients using a picture archiving and communication system-based tool. J Ultrasound Med. 2018; 37:2395–2403.
Article72. Schwimmer JB, Middleton MS, Behling C, Newton KP, Awai HI, Paiz MN, et al. Magnetic resonance imaging and liver histology as biomarkers of hepatic steatosis in children with nonalcoholic fatty liver disease. Hepatology. 2015; 61:1887–1895.
Article73. Achmad E, Yokoo T, Hamilton G, Heba ER, Hooker JC, Changchien C, et al. Feasibility of and agreement between MR imaging and spectroscopic estimation of hepatic proton density fat fraction in children with known or suspected nonalcoholic fatty liver disease. Abdom Imaging. 2015; 40:3084–3090.
Article74. Armstrong T, Ly KV, Murthy S, Ghahremani S, Kim GHJ, Calkins KL, et al. Free-breathing quantification of hepatic fat in healthy children and children with nonalcoholic fatty liver disease using a multi-echo 3-D stack-of-radial MRI technique. Pediatr Radiol. 2018; 48:941–953.
Article75. Koh H, Kim S, Kim MJ, Kim HG, Shin HJ, Lee MJ. Hepatic fat quantification magnetic resonance for monitoring treatment response in pediatric nonalcoholic steatohepatitis. World J Gastroenterol. 2015; 21:9741–9748.
Article76. Powell EE, Ali A, Clouston AD, Dixon JL, Lincoln DJ, Purdie DM, et al. Steatosis is a cofactor in liver injury in hemochromatosis. Gastroenterology. 2005; 129:1937–1943.
Article77. Yu H, Shimakawa A, McKenzie CA, Brodsky E, Brittain JH, Reeder SB. Multiecho water-fat separation and simultaneous R2* estimation with multifrequency fat spectrum modeling. Magn Reson Med. 2008; 60:1122–1134.78. Wang X, Hernando D, Reeder SB. Sensitivity of chemical shift-encoded fat quantification to calibration of fat MR spectrum. Magn Reson Med. 2016; 75:845–851.
Article79. Manning P, Murphy P, Wang K, Hooker J, Wolfson T, Middleton MS, et al. Liver histology and diffusion-weighted MRI in children with nonalcoholic fatty liver disease: a MAGNET study. J Magn Reson Imaging. 2017; 46:1149–1158.
Article80. Trout AT, Sheridan RM, Serai SD, Xanthakos SA, Su W, Zhang B, et al. Diagnostic performance of MR elastography for liver fibrosis in children and young adults with a spectrum of liver diseases. Radiology. 2018; 287:824–832.
Article81. Dillman JR, Trout AT, Costello EN, Serai SD, Bramlage KS, Kohli R, et al. Quantitative liver MRI-biopsy correlation in pediatric and young adult patients with nonalcoholic fatty liver disease: can one be used to predict the other? AJR Am J Roentgenol. 2018; 210:166–174.
Article82. Park SH, Lee SS, Sung JY, Na K, Kim HJ, Kim SY, et al. Noninvasive assessment of hepatic sinusoidal obstructive syndrome using acoustic radiation force impulse elastography imaging: a proof-of-concept study in rat models. Eur Radiol. 2018; 28:2096–2106.
Article83. Dietrich CF, Averkiou MA, Correas JM, Lassau N, Leen E, Piscaglia F. An EFSUMB introduction into dynamic contrast-enhanced ultrasound (DCE-US) for quantification of tumour perfusion. Ultraschall Med. 2012; 33:344–351.
Article84. Tian WS, Lin MX, Zhou LY, Pan FS, Huang GL, Wang W, et al. Maximum value measured by 2-D shear wave elastography helps in differentiating malignancy from benign focal liver lesions. Ultrasound Med Biol. 2016; 42:2156–2166.
Article85. Park HS, Kim YJ, Yu MH, Jung SI, Jeon HJ. Shear wave elastography of focal liver lesion: intraobserver reproducibility and elasticity characterization. Ultrasound Q. 2015; 31:262–271.86. Chiorean L, Cui XW, Tannapfel A, Franke D, Stenzel M, Kosiak W, et al. Benign liver tumors in pediatric patients - Review with emphasis on imaging features. World J Gastroenterol. 2015; 21:8541–8561.
Article87. Masand PM. Magnetic resonance imaging features of common focal liver lesions in children. Pediatr Radiol. 2018; 48:1234–1244.
Article88. Zhang W, Chen HJ, Wang ZJ, Huang W, Zhang LJ. Dynamic contrast enhanced MR imaging for evaluation of angiogenesis of hepatocellular nodules in liver cirrhosis in N-nitrosodiethylamine induced rat model. Eur Radiol. 2017; 27:2086–2094.
Article
- Full Text Links
-
- Actions
-
Cited
- CITED
-
- Close
- Share
-
- Similar articles
-
- Analysis of Hepatobiliary Disorders from a Nationwide Survey ofDischarge Data in Korean Children and Adolescents
- Erratum to "Histogram Analysis of Hepatobiliary Phase MR Imaging as a Quantitative Value for Liver Cirrhosis: Preliminary Observations" by Choi JY, et al. (Yonsei Med J 2014;55:651-9.)
- Structural MR Imaging in the Diagnosis of Alzheimer's Disease and Other Neurodegenerative Dementia: Current Imaging Approach and Future Perspectives
- Hilar Choledochal Cyst Mimicking Biliary Atresia on Hepatobiliary Scintigraphy: a Case Report
- Histogram Analysis of Hepatobiliary Phase MR Imaging as a Quantitative Value for Liver Cirrhosis: Preliminary Observations
