Korean J Ophthalmol.
2019 Aug;33(4):359-365. 10.3341/kjo.2018.0025.
Evaluation of Foveal Avascular Zone and Capillary Plexuses in Diabetic Patients by Optical Coherence Tomography Angiography
- Affiliations
-
- 1Department of Ophthalmology, Adana Training and Research City Hospital, Adana, Turkey. emine.ciloglu1@saglik.gov.tr
- KMID: 2454777
- DOI: http://doi.org/10.3341/kjo.2018.0025
Abstract
- PURPOSE
To investigate the foveal avascular zone (AVZ), superficial and deep foveal and parafoveal vessel density (VD) changes related to diabetic retinopathy.
METHODS
Forty-nine type 2 diabetes mellitus (DM) and 45 healthy control subjects were included in this study. The demographic data (age and sex), disease duration, and level of glycated hemoglobin were collected. Superficial VD (%), superficial AVZ area (mm2), deep VD (%) and deep AVZ area (mm2) were evaluated via optic coherence tomography angiography.
RESULTS
Superficial AVZ was 0.438 ± 0.05 mm2 in the DM group, 0.246 ± 0.022 mm2 in the control group (p < 0.001). Deep AVZ was 0.732 ± 0.06 mm2 in the DM group, and 0.342 ± 0.022 mm2 in the control group (p < 0.001). Superficial foveal VD was 29.45 ± 0.76 mm2 in the DM group, and 34.86 ± 0.75 mm2 in the control group (p < 0.001). Deep foveal VD was 24.85 ± 1.08 mm2 in the DM group, and 33.47 ± 0.56 mm2 in the control group (p < 0.001).
CONCLUSIONS
In this study, we demonstrated an enlargement in the foveal AVZ along with a reduction in the vascular density of the superficial and deep capillary network in the foveal and parafoveal area using optic coherence tomography angiography in patients with nonproliferative diabetic retinopathy. This technique can be used to monitor the progression of the disease and to evaluate the response to treatment.
Keyword
MeSH Terms
Figure
-
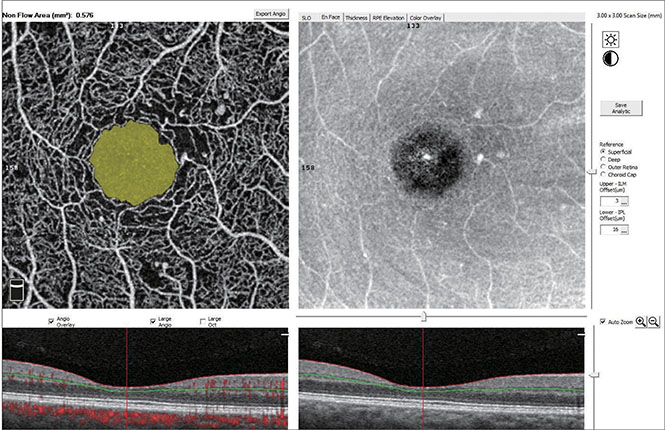
Fig. 1 Macular perfusion parameters of a 3 × 3 mm2 angiography scan size using optical coherence tomography angiography. The foveal avascular zone is automatically delineated by the software and represented by the color yellow.
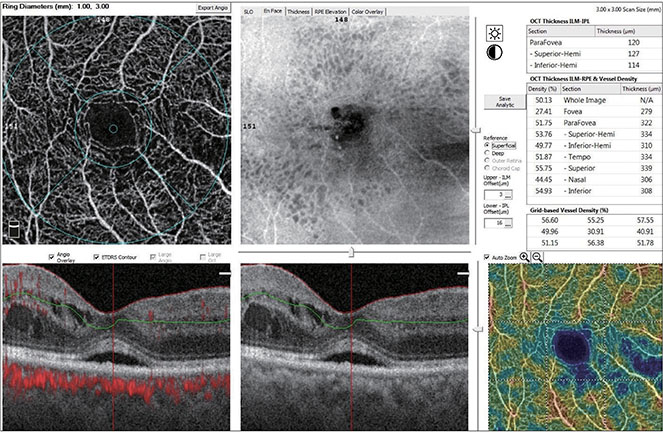
Fig. 2 Images of the macular region and the sections where vessel densities are calculated.
Reference
-
1. Wylegala A, Teper S, Dobrowolski D, Wylegala E. Optical coherence angiography: a review. Medicine (Baltimore). 2016; 95:e4907.2. Kim DY, Fingler J, Zawadzki RJ, et al. Optical imaging of the chorioretinal vasculature in the living human eye. Proc Natl Acad Sci U S A. 2013; 110:14354–14359.
Article3. Coscas G, Lupidi M, Coscas F. Heidelberg Spectralis optical coherence tomography angiography: technical aspects. Dev Ophthalmol. 2016; 56:1–5.
Article4. Jia Y, Bailey ST, Hwang TS, et al. Quantitative optical coherence tomography angiography of vascular abnormalities in the living human eye. Proc Natl Acad Sci U S A. 2015; 112:E2395–E2402.
Article5. Spaide RF, Klancnik JM Jr, Cooney MJ. Retinal vascular layers imaged by fluorescein angiography and optical coherence tomography angiography. JAMA Ophthalmol. 2015; 133:45–50.
Article6. de Carlo TE, Romano A, Waheed NK, Duker JS. A review of optical coherence tomography angiography (OCTA). Int J Retina Vitreous. 2015; 1:5.
Article7. Turgut B. Optical coherence tomography angiography: a general view. Eur Ophthalmic Rev. 2016; 10:39–42.8. Rahimy E, Sarraf D, Dollin ML, et al. Paracentral acute middle maculopathy in nonischemic central retinal vein occlusion. Am J Ophthalmol. 2014; 158:372–380.
Article9. Christenbury JG, Klufas MA, Sauer TC, Sarraf D. OCT angiography of paracentral acute middle maculopathy associated with central retinal artery occlusion and deep capillary ischemia. Ophthalmic Surg Lasers Imaging Retina. 2015; 46:579–581.
Article10. Hwang TS, Gao SS, Liu L, et al. Automated quantification of capillary nonperfusion using optical coherence tomography angiography in diabetic retinopathy. JAMA Ophthalmol. 2016; 134:367–373.
Article11. Di G, Weihong Y, Xiao Z, et al. A morphological study of the foveal avascular zone in patients with diabetes mellitus using optical coherence tomography angiography. Graefes Arch Clin Exp Ophthalmol. 2016; 254:873–879.
Article12. de Carlo TE, Chin AT, Bonini Filho MA, et al. Detection of microvascular changes in eyes of patients with diabetes but not clinical diabetic retinopathy using optical coherence tomography angiography. Retina. 2015; 35:2364–2370.
Article13. Takase N, Nozaki M, Kato A, et al. Enlargement of foveal avascular zone in diabetic eyes evaluated by en face optical coherence tomography angiography. Retina. 2015; 35:2377–2383.
Article14. Freiberg FJ, Pfau M, Wons J, et al. Optical coherence tomography angiography of the foveal avascular zone in diabetic retinopathy. Graefes Arch Clin Exp Ophthalmol. 2016; 254:1051–1058.
Article15. Lumbroso B, Huang D, Jia Y. Clinical guide to angio-OCT: non invasive, dyeless OCT angiography. 1st ed. New Delhi: Jaypee Brothers Medical Publishers;2015. p. 1–110.16. Nagaoka T, Sato E, Takahashi A, et al. Impaired retinal circulation in patients with type 2 diabetes mellitus: retinal laser Doppler velocimetry study. Invest Ophthalmol Vis Sci. 2010; 51:6729–6734.
Article17. Durham JT, Herman IM. Microvascular modifications in diabetic retinopathy. Curr Diab Rep. 2011; 11:253–264.
Article18. Kim AY, Chu Z, Shahidzadeh A, et al. Quantifying microvascular density and morphology in diabetic retinopathy using spectral-domain optical coherence tomography angiography. Invest Ophthalmol Vis Sci. 2016; 57:OCT362–OCT370.
Article19. Agemy SA, Scripsema NK, Shah CM, et al. Retinal vascular perfusion density mapping using optical coherence tomography angiography in normals and diabetic retinopathy patients. Retina. 2015; 35:2353–2363.
Article20. Al-Sheikh M, Akil H, Pfau M, Sadda SR. Swept-source OCT angiography imaging of the foveal avascular zone and macular capillary network density in diabetic retinopathy. Invest Ophthalmol Vis Sci. 2016; 57:3907–3913.
Article21. Tang FY, Ng DS, Lam A, et al. Determinants of quantitative optical coherence tomography angiography metrics in patients with diabetes. Sci Rep. 2017; 7:2575.
Article22. Lee J, Moon BG, Cho AR, Yoon YH. Optical coherence tomography angiography of DME and its association with anti-VEGF treatment response. Ophthalmology. 2016; 123:2368–2375.
Article23. Nakahara T, Hoshino M, Hoshino S, et al. Structural and functional changes in retinal vasculature induced by retinal ischemia-reperfusion in rats. Exp Eye Res. 2015; 135:134–145.
Article
- Full Text Links
-
- Actions
-
Cited
- CITED
-
- Close
- Share
-
- Similar articles
-
- Macular Microvasculature Features of the Eyes of Healthy Korean Children Using Optical Coherence Tomography Angiography
- Foveal Microvascular Changes Based on Optical Coherence Tomography Angiography in Mild Nonproliferative Diabetic Retinopathy
- Optical Coherence Tomography Angiography According to Severity of Diabetic Retinopathy
- Optical Coherence Tomography-angiography: Comparison of the Foveal Avascular Zone between Diabetic Retinopathy and Normal Subjects
- Analysis of Macular Capillary Plexuses after Cataract Surgery via Optical Coherence Tomography Angiography
