Additive Role of Optical Coherence Tomography Angiography Vessel Density Measurements in Glaucoma Diagnoses
- Affiliations
-
- 1Department of Ophthalmology, Asan Medical Center, University of Ulsan College of Medicine, Seoul, Korea. sungeye@gmail.com
- KMID: 2454772
- DOI: http://doi.org/10.3341/kjo.2019.0016
Abstract
- PURPOSE
This study compared the glaucoma diagnostic abilities of optical coherence tomography (OCT) and optical coherence tomography angiography (OCTA). In addition, the possibility of enhancing diagnostic capability by combining the two modalities was investigated.
METHODS
A total of 131 healthy eyes and 113 glaucomatous eyes were imaged by both OCT and OCTA. In OCT, glaucoma was defined as when the color of the superior or inferior quadrant of the peripapillary retinal nerve fiber layer thickness map was yellow (borderline, <5%) or red (outside normal limits, <1%). In OCTA, glaucoma was determined using the cut-off value of the superior or inferior peripapillary vessel density, calculated after receiver operating characteristic curve analysis. Sensitivity and specificity were determined by OCT alone, by OCTA alone, or by OCT and OCTA combined.
RESULTS
The sensitivity of OCT (86.7%) was better than that of OCTA (74.3%), whereas the specificity of OCTA (87.0%) was better than that of OCT (67.9%). When these two modalities were combined, both sensitivity and specificity were enhanced (90.3% and 92.4%, respectively). Among the 131 eyes, 32 were misdiagnosed as glaucomatous by OCT but accurately diagnosed as normal by OCTA. These eyes were myopic, with a longer axial length and a thinner and temporally displaced peak of peripapillary retinal nerve fiber layer thickness, causing the false positive result in OCT.
CONCLUSIONS
When OCTA was combined with OCT, the specificity of glaucoma diagnoses were enhanced. OCTA may compensate for the shortcomings of OCT in the diagnosis of glaucoma.
MeSH Terms
Figure
-
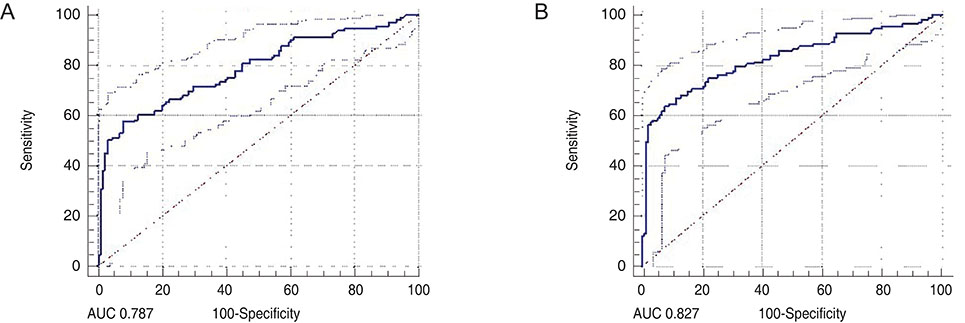
Fig. 1 Receiver operating characteristic curves for calculating the cut-off values of peripapillary vessel density in the (A) superior and (B) inferior regions. The cut-off value was (A) 55.70% for the superior region and (B) 54.85% for the inferior region. AUC = area under the curve.

Fig. 2 Receiver operating characteristic curves of optical coherence tomography (OCT) and optical coherence tomography angiography (OCTA). (A) The area under the curve (AUC) was 0.773 in OCT and 0.807 in OCTA in total. In each particular region, (B) AUC was 0.744 in OCT and 0.743 in OCTA for the superior region. (C) AUC was 0.797 in OCT and 0.782 in OCTA for the inferior region.
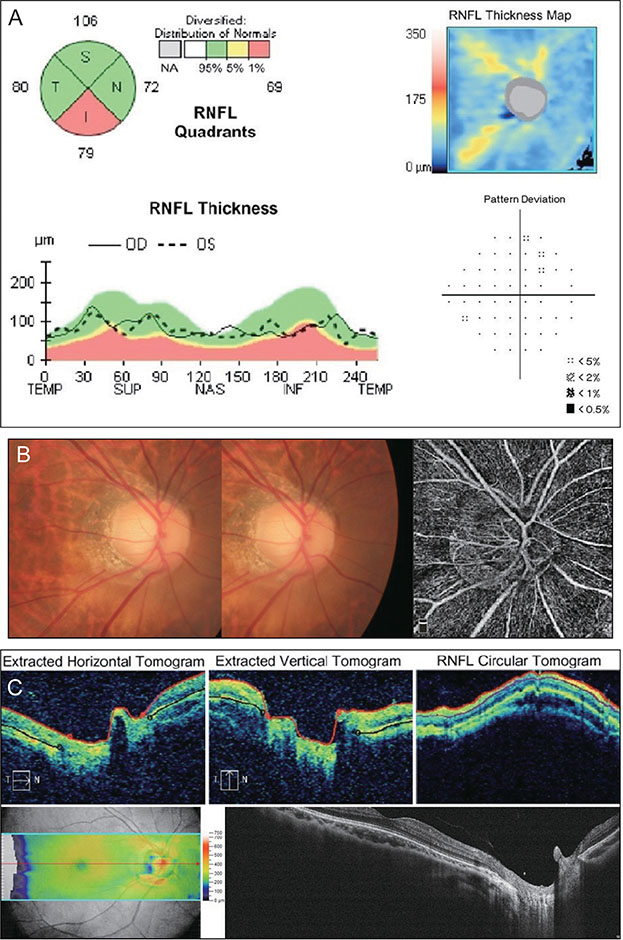
Fig. 3 Representative case of a normal control patient misdiagnosed by optical coherence tomography (OCT) as having glaucoma but diagnosed by optical coherence tomography angiography (OCTA) as not having glaucoma (normal). The axial length of this eye was 27.45 mm, corresponding to high myopia. In the TSNIT (temporal-superior-nasal-inferior-temporal) graph of peripapillary retinal nerve fiber layer thickness (pRNFLT), generalized thinning and temporal movement of pRNFLT peaks were noted. Therefore, the color of the inferior quadrant in the pRNFLT map was red (A). However, vessel density values calculated by OCTA, which included the radial peripapillary capillary layer, were 59.53% for the superior region and 58.66% for the inferior region, which were higher than the cut-off values (B). Circumpapillary B-scan image and macular OCT presents the absence of segmentation error or other retinal pathology (C).
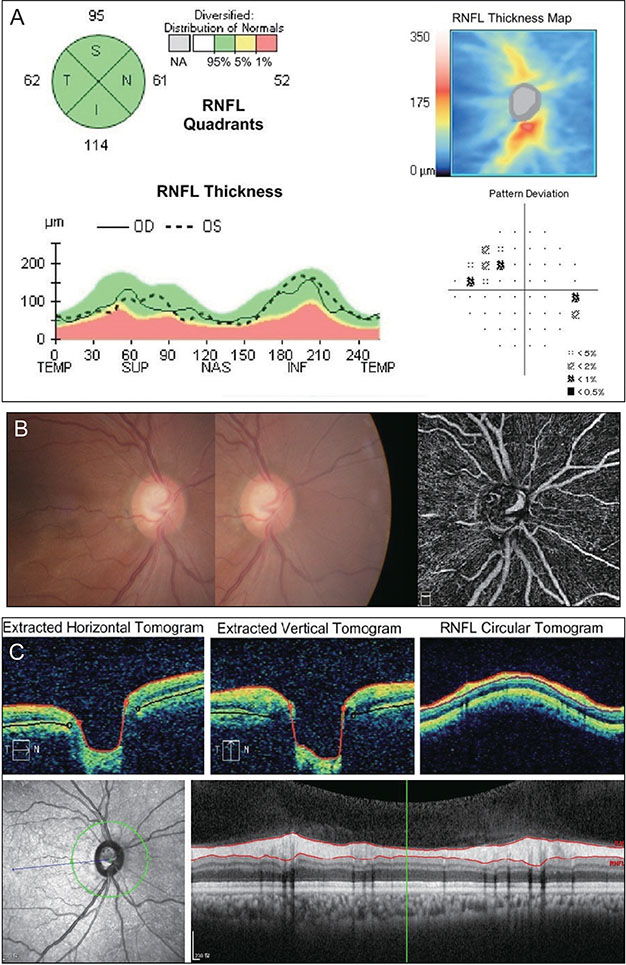
Fig. 4 A glaucoma patient with a false negative result following optical coherence tomography (OCT). On the peripapillary retinal nerve fiber layer thickness (pRNFLT) map, some wedge-shaped localized RNFL defects were observed both in the superior and inferior quadrants. In the TSNIT (temporal-superior-nasal-inferior-temporal) graph, the thinned area did not reach the yellow or red area (borderline or outside normal limits). The color of the 4-quadrant pRNFLT map was green (A). However, vessel density values calculated by optical coherence tomography angiography (OCTA) were 53.77% for the superior region and 53.94% for the inferior region, which were lower than the cut-off values (B). Circumpapillary B-scan image and macular OCT presents the absence of segmentation error or other retinal pathology (C).
Reference
-
1. Weinreb RN, Aung T, Medeiros FA. The pathophysiology and treatment of glaucoma: a review. JAMA. 2014; 311:1901–1911.2. Kountouras J, Zavos C, Chatzopoulos D. Primary open-angle glaucoma: pathophysiology and treatment. Lancet. 2004; 364:1311–1312.
Article3. Gemenetzi M, Yang Y, Lotery AJ. Current concepts on primary open-angle glaucoma genetics: a contribution to disease pathophysiology and future treatment. Eye (Lond). 2012; 26:355–369.
Article4. Jia Y, Morrison JC, Tokayer J, et al. Quantitative OCT angiography of optic nerve head blood flow. Biomed Opt Express. 2012; 3:3127–3137.
Article5. Jia Y, Wei E, Wang X, et al. Optical coherence tomography angiography of optic disc perfusion in glaucoma. Ophthalmology. 2014; 121:1322–1332.
Article6. Leveque PM, Zeboulon P, Brasnu E, et al. Optic disc vascularization in glaucoma: value of spectral-domain optical coherence tomography angiography. J Ophthalmol. 2016; 2016:6956717.7. Li J, Yang YQ, Yang DY, et al. Reproducibility of perfusion parameters of optic disc and macula in rhesus monkeys by optical coherence tomography angiography. Chin Med J (Engl). 2016; 129:1087–1090.
Article8. Liu L, Jia Y, Takusagawa HL, et al. Optical coherence tomography angiography of the peripapillary retina in glaucoma. JAMA Ophthalmol. 2015; 133:1045–1052.
Article9. Mammo Z, Heisler M, Balaratnasingam C, et al. Quantitative optical coherence tomography angiography of radial peripapillary capillaries in glaucoma, glaucoma suspect, and normal eyes. Am J Ophthalmol. 2016; 170:41–49.
Article10. Mansoori T, Sivaswamy J, Gamalapati JS, et al. Measurement of radial peripapillary capillary density in the normal human retina using optical coherence tomography angiography. J Glaucoma. 2017; 26:241–246.
Article11. Mo S, Phillips E, Krawitz BD, et al. Visualization of radial peripapillary capillaries using optical coherence tomography angiography: the effect of image averaging. PLoS One. 2017; 12:e0169385.
Article12. Rao HL, Kadambi SV, Weinreb RN, et al. Diagnostic ability of peripapillary vessel density measurements of optical coherence tomography angiography in primary open-angle and angle-closure glaucoma. Br J Ophthalmol. 2017; 101:1066–1070.
Article13. Yu J, Jiang C, Wang X, et al. Macular perfusion in healthy Chinese: an optical coherence tomography angiogram study. Invest Ophthalmol Vis Sci. 2015; 56:3212–3217.
Article14. Bojikian KD, Chen CL, Wen JC, et al. Optic disc perfusion in primary open angle and normal tension glaucoma eyes using optical coherence tomography-based microangiography. PLoS One. 2016; 11:e0154691.
Article15. Wang X, Jiang C, Ko T, et al. Correlation between optic disc perfusion and glaucomatous severity in patients with open-angle glaucoma: an optical coherence tomography angiography study. Graefes Arch Clin Exp Ophthalmol. 2015; 253:1557–1564.
Article16. Kwon J, Choi J, Shin JW, et al. Glaucoma diagnostic capabilities of foveal avascular zone parameters using optical coherence tomography angiography according to visual field defect location. J Glaucoma. 2017; 26:1120–1129.
Article17. Rao HL, Pradhan ZS, Weinreb RN, et al. regional comparisons of optical coherence tomography angiography vessel density in primary open-angle glaucoma. Am J Ophthalmol. 2016; 171:75–83.
Article18. Rao HL, Pradhan ZS, Weinreb RN, et al. A comparison of the diagnostic ability of vessel density and structural measurements of optical coherence tomography in primary open angle glaucoma. PLoS One. 2017; 12:e0173930.
Article19. Sung KR, Kim DY, Park SB, Kook MS. Comparison of retinal nerve fiber layer thickness measured by Cirrus HD and Stratus optical coherence tomography. Ophthalmology. 2009; 116:1264–1270.
Article20. Sung KR, Kim JS, Wollstein G, et al. Imaging of the retinal nerve fibre layer with spectral domain optical coherence tomography for glaucoma diagnosis. Br J Ophthalmol. 2011; 95:909–914.
Article21. Asrani S, Essaid L, Alder BD, Santiago-Turla C. Artifacts in spectral-domain optical coherence tomography measurements in glaucoma. JAMA Ophthalmol. 2014; 132:396–402.
Article22. Aykut V, Oner V, Tas M, et al. Influence of axial length on peripapillary retinal nerve fiber layer thickness in children: a study by RTVue spectral-domain optical coherence tomography. Curr Eye Res. 2013; 38:1241–1247.
Article23. Dhami A, Dhasmana R, Nagpal RC. Correlation of retinal nerve fiber layer thickness and axial length on Fourier domain optical coherence tomography. J Clin Diagn Res. 2016; 10:NC15–NC17.
Article24. Hirasawa K, Shoji N, Yoshii Y, Haraguchi S. Determination of axial length requiring adjustment of measured circumpapillary retinal nerve fiber layer thickness for ocular magnification. PLoS One. 2014; 9:e107553.
Article25. Oner V, Ozgur G, Turkyilmaz K, et al. Effect of axial length on retinal nerve fiber layer thickness in children. Eur J Ophthalmol. 2014; 24:265–272.26. Yamashita T, Sakamoto T, Yoshihara N, et al. Correlations between retinal nerve fiber layer thickness and axial length, peripapillary retinal tilt, optic disc size, and retinal artery position in healthy eyes. J Glaucoma. 2017; 26:34–40.
Article27. Suh MH, Zangwill LM, Manalastas PI, et al. Deep retinal layer microvasculature dropout detected by the optical coherence tomography angiography in glaucoma. Ophthalmology. 2016; 123:2509–2518.
Article28. Garway-Heath DF, Poinoosawmy D, Fitzke FW, Hitchings RA. Mapping the visual field to the optic disc in normal tension glaucoma eyes. Ophthalmology. 2000; 107:1809–1815.29. Chung JK, Hwang YH, Wi JM, et al. Glaucoma diagnostic ability of the optical coherence tomography angiography vessel density parameters. Curr Eye Res. 2017; 42:1458–1467.
Article30. Hwang YH, Yoo C, Kim YY. Characteristics of peripapillary retinal nerve fiber layer thickness in eyes with myopic optic disc tilt and rotation. J Glaucoma. 2012; 21:394–400.
Article31. Hwang YH, Yoo C, Kim YY. Myopic optic disc tilt and the characteristics of peripapillary retinal nerve fiber layer thickness measured by spectral-domain optical coherence tomography. J Glaucoma. 2012; 21:260–265.
Article32. Mauschitz MM, Bonnemaijer PW, Diers K, et al. Systemic and ocular determinants of peripapillary retinal nerve fiber layer thickness measurements in the European eye epidemiology (E3) population. Ophthalmology. 2018; 125:1526–1536.33. Lee EJ, Lee KM, Lee SH, Kim TW. OCT angiography of the peripapillary retina in primary open-angle glaucoma. Invest Ophthalmol Vis Sci. 2016; 57:6265–6270.
Article
- Full Text Links
-
- Actions
-
Cited
- CITED
-
- Close
- Share
-
- Similar articles
-
- Decreased Visual Acuity Accompanied with Central Scotomas in Normal Tension Glaucoma: Macular Optical Coherence Tomography Angiography Cases
- Effect of Reducing Intraocular Pressure on Vessel Density after Trabeculectomy Using Optical Coherence Tomography Angiography
- Optical Coherence Tomography Angiography Features of Idiopathic Epiretinal Membrane
- Availability of Optical Coherence Tomography in Diagnosis and Classification of Choroidal Neovascularization
- Change of Peripapillary Vessel Density after Ahmed Valve Implantation
