Clinical Efficacy of Custom-built Software for the Early Detection of Glaucoma: A Comparison of Axial-length and Major Retinal Artery Location Data
- Affiliations
-
- 1Department of Ophthalmology, Ajou University College of Medicine, Suwon, Korea.
- 2Department of Ophthalmology, CHA Bundang Medical Center, CHA University, Seongnam, Korea. harryrho@gmail.com
- KMID: 2442614
- DOI: http://doi.org/10.3341/kjo.2018.0060
Abstract
- PURPOSE
To assess the clinical efficacy for early detection of glaucoma using custom-built image software visualizing translucent retinal nerve fiber layer thickness (RNFLT) that is graphed based on a normative database.
METHODS
This prospective study was conducted using a normative database constructed with RNFLT data of 151 healthy Korean eyes. The reference lines of the mean, the lower 5%, and the lower 1% limit were visualized as a translucent RNFLT graph produced by our software after inputting each subject's major retinal artery position and overlaying the results onto the RNFLT measurements. Fifty-eight additional healthy control and 79 early-glaucoma eyes were collected for the validation group. If a subject's RNFLT graph was outside the reference line of the lower 1% limit, the graph was defined as abnormal. The lower 1% limit, which was generated by three criteria (criterion 1, built-in software; criterion 2, axial-length data; criterion 3, major retinal artery data), was used to address the difference of agreement with a standard answer.
RESULTS
For criteria 1, 2, and 3, the accuracy of our custom-built software was significantly higher than that of the manufacturer's database (kappa of 0.475 vs. 0.852 vs. 0.940; sensitivity of 62.0% vs. 91.1% vs. 97.5%, respectively) maintaining high specificity (87.9% vs. 94.8% vs. 96.6%, respectively).
CONCLUSIONS
The custom-built imaging software with the constructed RNFLT normative database showed high clinical efficiency for early detection of glaucoma with negligible user-related variability.
Keyword
MeSH Terms
Figure
-

Fig. 1 A demonstration of an overlaying function using our custom-built software. (A) The main window of the custom-built software shows the principal features including database management, artery information input window, and the graph visualization function key. (B,C) The background was seen using a manual adjustment cursor.

Fig. 2 A representative case of early glaucoma detection using our custom-built software. (A) A red-free photograph shows a localized retinal nerve fiber layer (RNFL) defect (arrows) in the inferotemporal region. (B) Early damage of the superior visual field was noted in the subject's right eye that corresponded to the inferotemporal RNFL defect. (C) The inferotemporal RNFL defect was not detected by the built-in software; (D) however, the defect was detected by our custom-built software. GHT = glaucoma hemifield test; VFI = visual-field index; MD = mean deviation; PSD = pattern standard deviation.
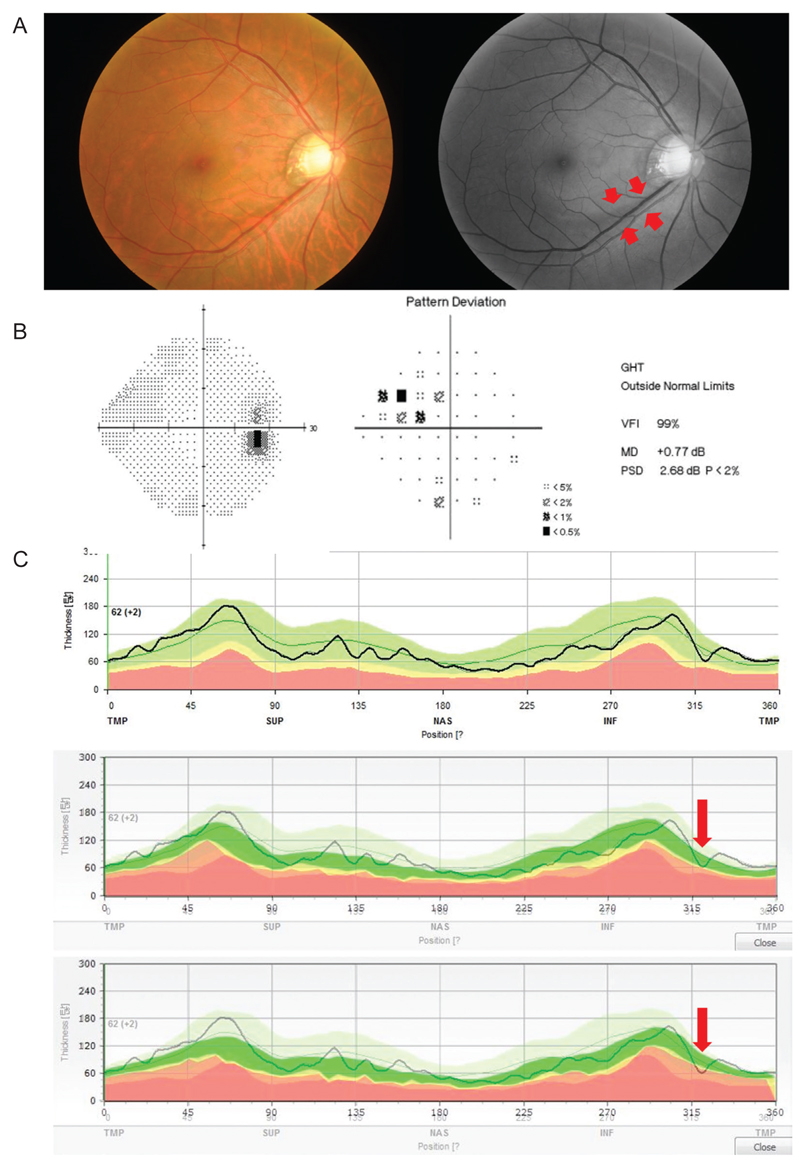
Fig. 3 A representative discordance case shows the detection ability of criterion 3 in the early diagnosis of glaucoma. (A) Red-free photography shows a wedge-shaped retinal nerve fiber layer (RNFL) defect in the inferotemporal region. The short red arrows indicate the margin of the defect. (B) Pattern deviation and global indices of visual-field tests demonstrate outside normal limit defects in the superonasal quadrant. (C) Criterion 1 (top) and criterion 2 (middle) cannot detect any RNFL defect based on the lower 1% limit of RNFL thickness. Only criterion 3 (bottom) detects the glaucomatous RNFL defect (long red arrow). GHT = glaucoma hemifield test; VFI = visual-field index; MD = mean deviation; PSD = pattern standard deviation.
Reference
-
1. Freeman EE, Munoz B, West SK, et al. Glaucoma and quality of life: the Salisbury Eye Evaluation. Ophthalmology. 2008; 115:233–238.2. Heijl A. The times they are a-changin': time to change glaucoma management. Acta Ophthalmol. 2013; 91:92–99.
Article3. Budenz DL, Michael A, Chang RT, et al. Sensitivity and specificity of the StratusOCT for perimetric glaucoma. Ophthalmology. 2005; 112:3–9.
Article4. Hood DC. Improving our understanding, and detection, of glaucomatous damage: an approach based upon optical coherence tomography (OCT). Prog Retin Eye Res. 2017; 57:46–75.
Article5. Rho S, Sung Y, Kang T, et al. Improvement of diagnostic performance regarding retinal nerve fiber layer defect using shifting of the normative database according to vessel position. Invest Ophthalmol Vis Sci. 2014; 55:5116–5124.
Article6. Budenz DL. Atlas of visual fields. Philadelphia: Lippincott-Raven;1997. p. 143–145.7. Sim J, Wright CC. The kappa statistic in reliability studies: use, interpretation, and sample size requirements. Phys Ther. 2005; 85:257–268.
Article8. Wang M, Jin Q, Wang H, et al. Quantifying positional variation of retinal blood vessels in glaucoma. PLoS One. 2018; 13:e0193555.
Article9. Forsman E, Kivela T, Vesti E. Lifetime visual disability in open-angle glaucoma and ocular hypertension. J Glaucoma. 2007; 16:313–319.
Article10. Grodum K, Heijl A, Bengtsson B. A comparison of glaucoma patients identified through mass screening and in routine clinical practice. Acta Ophthalmol Scand. 2002; 80:627–631.11. Kang SH, Park KH, Kim JM, et al. Korean normative database for time domain optical coherence tomography to detect localized retinal nerve fiber layer defects (preliminary study). Jpn J Ophthalmol. 2010; 54:144–150.
Article12. Hood DC, Fortune B, Arthur SN, et al. Blood vessel contributions to retinal nerve fiber layer thickness profiles measured with optical coherence tomography. J Glaucoma. 2008; 17:519–528.
Article13. Hood DC, Salant JA, Arthur SN, et al. The location of the inferior and superior temporal blood vessels and interindividual variability of the retinal nerve fiber layer thickness. J Glaucoma. 2010; 19:158–166.
Article14. Leung CK, Ye C, Weinreb RN, et al. Retinal nerve fiber layer imaging with spectral-domain optical coherence tomography a study on diagnostic agreement with Heidelberg Retinal Tomograph. Ophthalmology. 2010; 117:267–274.
- Full Text Links
-
- Actions
-
Cited
- CITED
-
- Close
- Share
-
- Similar articles
-
- The Relationship of Axial length and Peripheral Retinal Degeneration
- A Case of Bilateral Central Retinal Vein Occlusion
- Changes in Axial Length Following Trabeculectomy and Ahmed Glaucoma Valve Implantation
- Relationship between Central Retinal Vein Occlusion and Axial Length of Eye
- Intraocular Pressure and Axial Length in Children
