T1-Based MR Temperature Monitoring with RF Field Change Correction at 7.0T
- Affiliations
-
- 1Department of Electronics and Information Engineering and ICT Convergence Technology for Health & Safety, Korea University, Sejong, Korea. ohch@korea.ac.kr
- 2Korea Artificial Organ Center, Seoul, Korea.
- 3Bioimaging Research Team, Korea Basic Science Institute, Cheongju, Korea.
- 4Research Institute for Advanced Industrial Technology, Korea University, Sejong, Korea.
- 5Department of Thoracic and Cardiovascular Surgery, Korea University Medical College, Seoul, Korea.
- KMID: 2431106
- DOI: http://doi.org/10.13104/imri.2018.22.4.218
Abstract
- PURPOSE
The objective of this study is to determine the effect of physical changes on MR temperature imaging at 7.0T and to examine proton-resonance-frequency related changes of MR phase images and T1 related changes of MR magnitude images, which are obtained for MR thermometry at various magnetic field strengths.
MATERIALS AND METHODS
An MR-compatible capacitive-coupled radio-frequency hyperthermia system was implemented for heating a phantom and swine muscle tissue, which can be used for both 7.0T and 3.0T MRI. To determine the effect of flip angle correction on T1-based MR thermometry, proton resonance frequency, apparent T1, actual flip angle, and T1 images were obtained. For this purpose, three types of imaging sequences are used, namely, T1-weighted fast field echo with variable flip angle method, dual repetition time method, and variable flip angle method with radio-frequency field nonuniformity correction.
RESULTS
Signal-to-noise ratio of the proton resonance frequency shift-based temperature images obtained at 7.0T was five-fold higher than that at 3.0T. The T1 value increases with increasing temperature at both 3.0T and 7.0T. However, temperature measurement using apparent T1-based MR thermometry results in bias and error because B1 varies with temperature. After correcting for the effect of B1 changes, our experimental results confirmed that the calculated T1 increases with increasing temperature both at 3.0T and 7.0T.
CONCLUSION
This study suggests that the temperature-induced flip angle variations need to be considered for accurate temperature measurements in T1-based MR thermometry.
MeSH Terms
Figure
-

Fig. 1 Experimental set-up of MR-compatible RF hyperthermia and phantom. An MR-compatible capacitive-coupled RF hyperthermia system (a) was used with fields of 7.0T and 3.0T for heating experimental objects. MR-compatible RF hyperthermia system and RF coil for MRI setting are shown in (b). To compensate for unwanted phase drift in PRF-based MR thermometry, oil phantoms were attached nearby the human-tissue-mimicking phantom and swine muscle tissue (c). PRF = proton resonance frequency; RF = radio-frequency.

Fig. 2 Location of the fiber-optic sensor and experimental protocols. (a) Quantitative analysis was performed within 7 × 7 ROIs to estimate changes of temperature obtained from PRF-based MR thermometry, apparent T1, actual FA, and T1. ROIs in the water region of the phantom, water region of swine muscle tissue, and fat region of swine muscle tissue are shown in (b), (c), and (d), respectively. The MR-compatible fiber-optic temperature sensor is located in the center of the ROI marked as a solid line. FA = flip angle; FFE = fast field echo; PRF = proton resonance frequency; ROI = region-of-interest; TR = repetition time; VFA = variable flip angle.
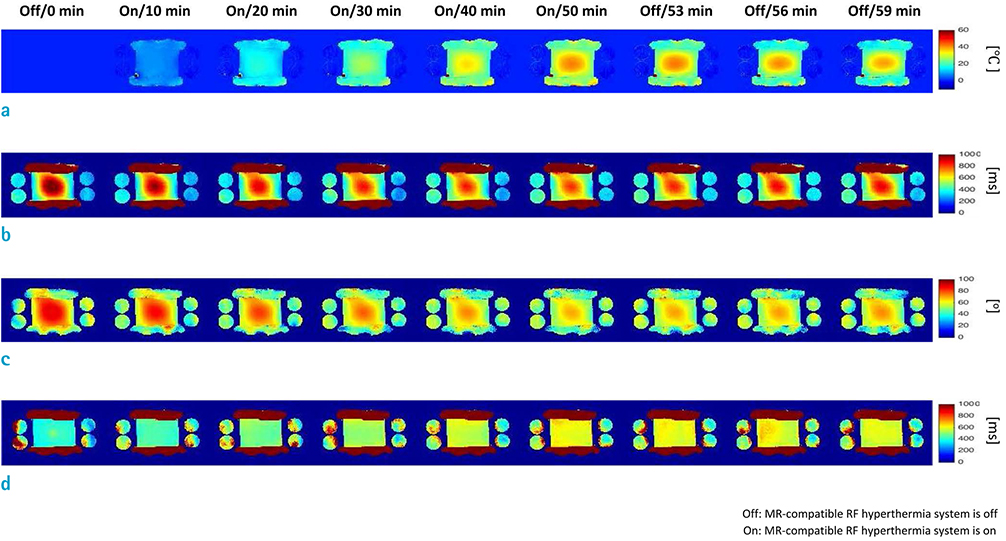
Fig. 3 Heat-induced parameter change maps of the human-tissue-mimicking phantom at 7.0T. Experimentally measured sequential changes of (a) temperature, (b) apparent T1, (c) actual FA, and (d) T1 for PRF-based MR thermometry of the human-tissue-mimicking phantom at 7.0T. With increasing temperature, apparent T1 decreased at 7.0T. The actual FA decreased with increasing temperature at 7.0T. After correcting for inaccurate FA, T1 was found to increase with increasing temperature at 7.0T. FA = flip angle; PRF = proton resonance frequency.
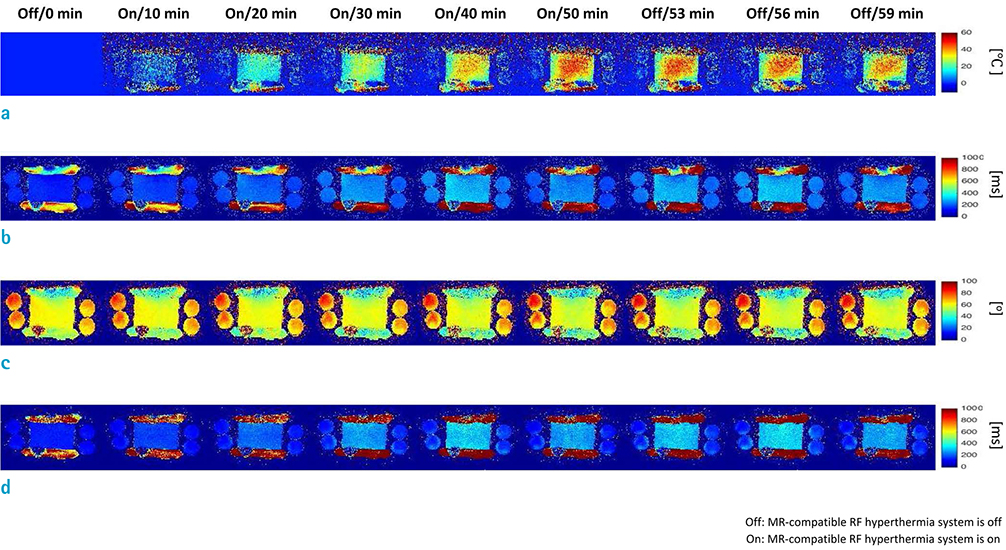
Fig. 4 Heat-induced parameter change maps of the human-tissue-mimicking phantom at 3.0T. Experimentally measured sequential changes of (a) temperature, (b) apparent T1, (c) actual FA, and (d) T1 for PRF-based MR thermometry of the human-tissue-mimicking phantom at 3.0T. With increasing temperature, apparent T1 and T1 increased at 3.0T. The actual FA decreased with increasing temperature at 3.0T. FA = flip angle; PRF = proton resonance frequency.
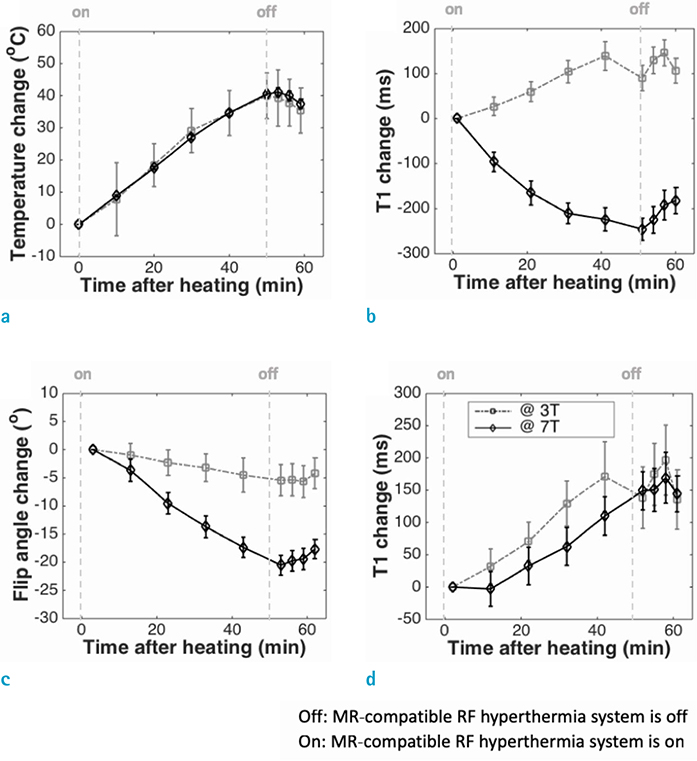
Fig. 5 Mean and standard deviation of different quantities over 7×7 ROIs of the human-tissue-mimicking phantom. (a) Temperature obtained by PRF-based MR thermometry. (b) Apparent T1 change. (c) Actual FA change. (d) T1 change. FA = flip angle; PRF = proton resonance frequency; ROI = region-of-interest.

Fig. 6 Scatter plots of tissue-mimicking phantom comparing temperature obtained by PRF-based MR thermometry and apparent T1 change, actual FA change, T1 change, and corresponding linear regressions for 3.0T and 7.0T. (a) Change in apparent T1 at 7.0T. (b) Change in actual FA at 7.0T. (c) Change in T1 at 7.0T. (d) Change in apparent T1 at 3.0T. (e) Change in actual FA at 3.0T. (f) Change in T1 at 3.0T. FA = flip angle; PRF = proton resonance frequency.
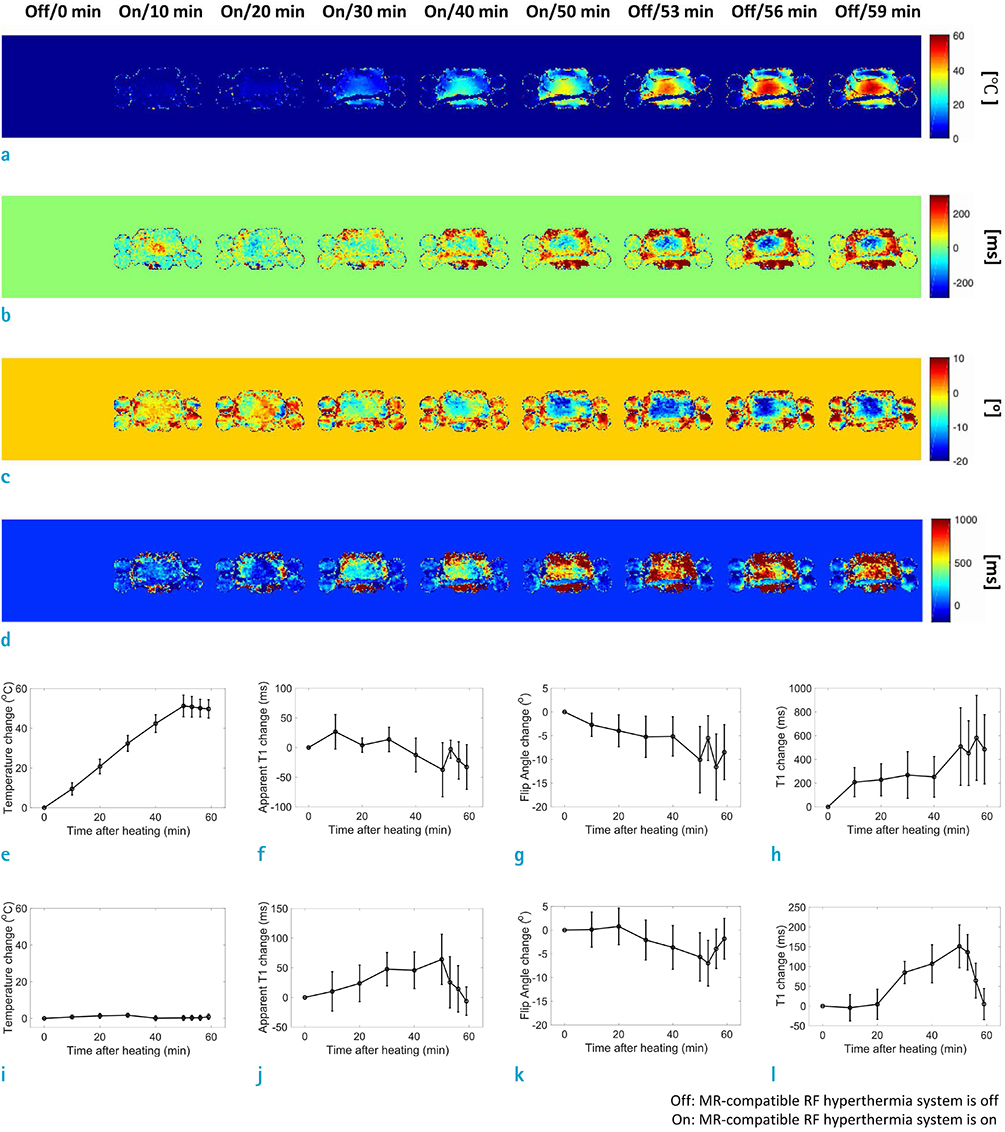
Fig. 7 Heat-induced parameter change maps of swine muscle tissue at 7.0T. (a) Temperature images obtained by PRF-based MR thermometry, (b) Changes of apparent T1, (c) Changes of actual FA, and (d) Changes of T1 for the experiment performed on swine muscle tissue at 7.0T. Mean and standard deviation of 7×7 ROIs of the swine muscle tissue for (e) temperature changes of PRF-based MR thermometry, (f) apparent T1 changes, (g) changes of actual FA, and (h) changes of T1. Mean and standard deviation of 7 × 7 ROIs of the swine muscle tissue in the fatty region for (i) temperature changes of PRF-based MR thermometry, (j) apparent T1 changes, (k) changes of actual FA, and (l) changes of T1. FA = flip angle; PRF = proton resonance frequency; ROI = region-of-interest.
Reference
-
1. Lewa CJ, Majewska Z. Temperature relationships of proton spin-lattice relaxation time T1 in biological tissues. Bull Cancer. 1980; 67:525–530.2. Graham SJ, Bronskill MJ, Henkelman RM. Time and temperature dependence of MR parameters during thermal coagulation of ex vivo rabbit muscle. Magn Reson Med. 1998; 39:198–203.3. Ishihara Y, Calderon A, Watanabe H, et al. A precise and fast temperature mapping using water proton chemical shift. Magn Reson Med. 1995; 34:814–823.
Article4. Kim JM, Lee C, Jo YS, et al. Monitoring and guidance on high-intensity focused ultrasound treatment by multiple fast field echo at 3.0 T MRI: ex-vivo studies with multiparametric mapping. In : In Proceedings of the 26th Annual Meeting ISMRM; Paris, France. 2018. p. 1485.5. Moseley ME, Cohen Y, Mintorovitch J, et al. Early detection of regional cerebral ischemia in cats: comparison of diffusion- and T2-weighted MRI and spectroscopy. Magn Reson Med. 1990; 14:330–346.
Article6. Young IR, Hand JW, Oatridge A, Prior MV. Modeling and observation of temperature changes in vivo using MRI. Magn Reson Med. 1994; 32:358–369.7. Langereis S, Keupp J, van Velthoven JL, et al. A temperature-sensitive liposomal 1H CEST and 19F contrast agent for MR image-guided drug delivery. J Am Chem Soc. 2009; 131:1380–1381.
Article8. Schwan HP, Kay CF. The conductivity of living tissues. Ann N Y Acad Sci. 1957; 65:1007–1013.
Article9. Yeo SY, Katscher U, Kim YS, Gruell H. Conductivity imaging for assessing the treatment outcome of MR-HIFU ablation of uterine fibroids. In : In Proceedings of the 25th Annual Meeting ISMRM; Honolulu, Hawaii, USA. 2017. p. 2102.10. Kwon DH, Kim JM, Oh SH, et al. Seven-Tesla magnetic resonance images of the substantia nigra in Parkinson disease. Ann Neurol. 2012; 71:267–277.
Article11. Goelman G, Liu S, Fleysher R, Fleysher L, Grossman RI, Gonen O. Chemical-shift artifact reduction in Hadamard-encoded MR spectroscopic imaging at high (3T and 7T) magnetic fields. Magn Reson Med. 2007; 58:167–173.
Article12. Rieke V, Butts Pauly K. MR thermometry. J Magn Reson Imaging. 2008; 27:376–390.
Article13. Wang P. Evaluation of MR thermometry with proton resonance frequency method at 7T. Quant Imaging Med Surg. 2017; 7:259–266.
Article14. Fite BZ, Liu Y, Kruse DE, et al. Magnetic resonance thermometry at 7T for real-time monitoring and correction of ultrasound induced mild hyperthermia. PLoS One. 2012; 7:e35509.
Article15. Henderson E, McKinnon G, Lee TY, Rutt BK. A fast 3D look-locker method for volumetric T1 mapping. Magn Reson Imaging. 1999; 17:1163–1171.
Article16. Zhu DC, Penn RD. Full-brain T1 mapping through inversion recovery fast spin echo imaging with time-efficient slice ordering. Magn Reson Med. 2005; 54:725–731.17. Cheng HL, Wright GA. Rapid high-resolution T(1) mapping by variable flip angles: accurate and precise measurements in the presence of radiofrequency field inhomogeneity. Magn Reson Med. 2006; 55:566–574.18. Liberman G, Louzoun Y, Ben Bashat D. T(1) mapping using variable flip angle SPGR data with flip angle correction. J Magn Reson Imaging. 2014; 40:171–180.19. Lee Y, Callaghan MF, Nagy Z. Analysis of the precision of variable flip angle T1 mapping with emphasis on the noise propagated from RF transmit field maps. Front Neurosci. 2017; 11:106.
Article20. Yarnykh VL. Actual flip-angle imaging in the pulsed steady state: a method for rapid three-dimensional mapping of the transmitted radiofrequency field. Magn Reson Med. 2007; 57:192–200.
Article21. Helms G, Dathe H, Dechent P. Quantitative FLASH MRI at 3T using a rational approximation of the Ernst equation. Magn Reson Med. 2008; 59:667–672.
Article22. Kim HJ, Kim JM, Jo YS, et al. Experiment study of MR compatible RF hyperthermia system. In : In Proceedings of the 24th Annual Meeting ISMRM; Singapore. 2016. p. 1644.23. Kim JM, Kumar S, Jo YS, et al. Temperature-range-dependent optimization of noninvasive MR thermometry methods. J Biomed Eng Res. 2015; 36:241–250.
Article24. Kim JM, Lee C, Hong SD, et al. Comparison of temperature mapping methods using proton resonance frequency shift and T1 in 3-T and 7-T MRI. In : In Proceedings of the 25th Annual Meeting ISMRM; Honolulu, Hawaii, USA. 2017. p. 2588.
- Full Text Links
-
- Actions
-
Cited
- CITED
-
- Close
- Share
-
- Similar articles
-
- Comparison of Proton T1 and T2 Relaxation Times of Cerebral Metabolites between 1.5T and 3.0T MRI using a Phantom
- An experimental study on MRI signal intensity of albumin solution
- A study of artifacts in MR imaging induced by metalic aneurysm clips
- Analysis of Endcap Effect for MRI Birdcage RF Coil by FDTD Method
- Perioperative Temperature Changes Observed in Cases of Lumbar Sympathectomy Using RF Thermocoagulation
