Korean J Community Nutr.
2018 Apr;23(2):116-127. 10.5720/kjcn.2018.23.2.116.
Study of the Coverage of Nutrition Labeling System on the Nutrient Intake of Koreans - using the 2013 Korea National Health and Nutrition Examination Survey (KNHANES) Data
- Affiliations
-
- 1Department of Nutrition Research Team, R&D Center, Nongshim, Seoul 07057, Korea.
- 2Department of Lifecare Industry, Korea Health Industry Development Institute, Chungbuk 28159, Korea.
- 3Department of Food and nutrition, Shingu College, Seongnam 13174, Korea. ynlee@shingu.ac.kr
- KMID: 2428675
- DOI: http://doi.org/10.5720/kjcn.2018.23.2.116
Abstract
OBJECTIVES
The purpose of this study was to examine the coverage of the current mandatory nutrition labeling system on the nutrient intake of Koreans.
METHODS
KNHANES dietary intake data (2013) of 7,242 subjects were used in the analysis. KNHANES dietary intake data were collected by a 24-hour recall method by trained dietitians. For analysis, all food items consumed by the subjects were classified into two groups (foods with mandatory labeling and other foods). In the next step, all food items were reclassified into four groups according to the food type and nutrition labeling regulations: raw material food, processed food of raw material characteristics, processed foods without mandatory labeling, and processed foods with mandatory labeling. The intake of energy and five nutrients (carbohydrate, protein, fat, saturated fat, and sodium) of subjects from each food group were analyzed to determine the coverage of the mandatory nutrition labeling system among the total nutrient intake of Koreans.
RESULTS
The average intake of foods with mandatory labeling were 384g/day, which was approximately one quarter of the total daily food intake (1,544 g/day). The proportion of energy and five nutrients intake from foods with mandatory labeling was 18.1%~47.4%. The average food intake from the 4 food groups were 745 g/day (48.3%) for the raw food materials, 54 g/day (3.5%) for the processed food of raw material characteristics, 391 g/day (25.3%) for the processed foods without mandatory labeling, and 354 g/day (22.9%) for the processed foods with mandatory labeling.
CONCLUSIONS
Although nutrition labeling is a useful tool for providing nutritional information to consumers, the coverage of current mandatory nutrition labeling system on daily nutrient intake of the Korean population is not high. To encourage informed choices and improve healthy eating habits of the Korean population, the nutrition labeling system should be expanded to include more food items and foodservice menus.
Keyword
MeSH Terms
Figure
-
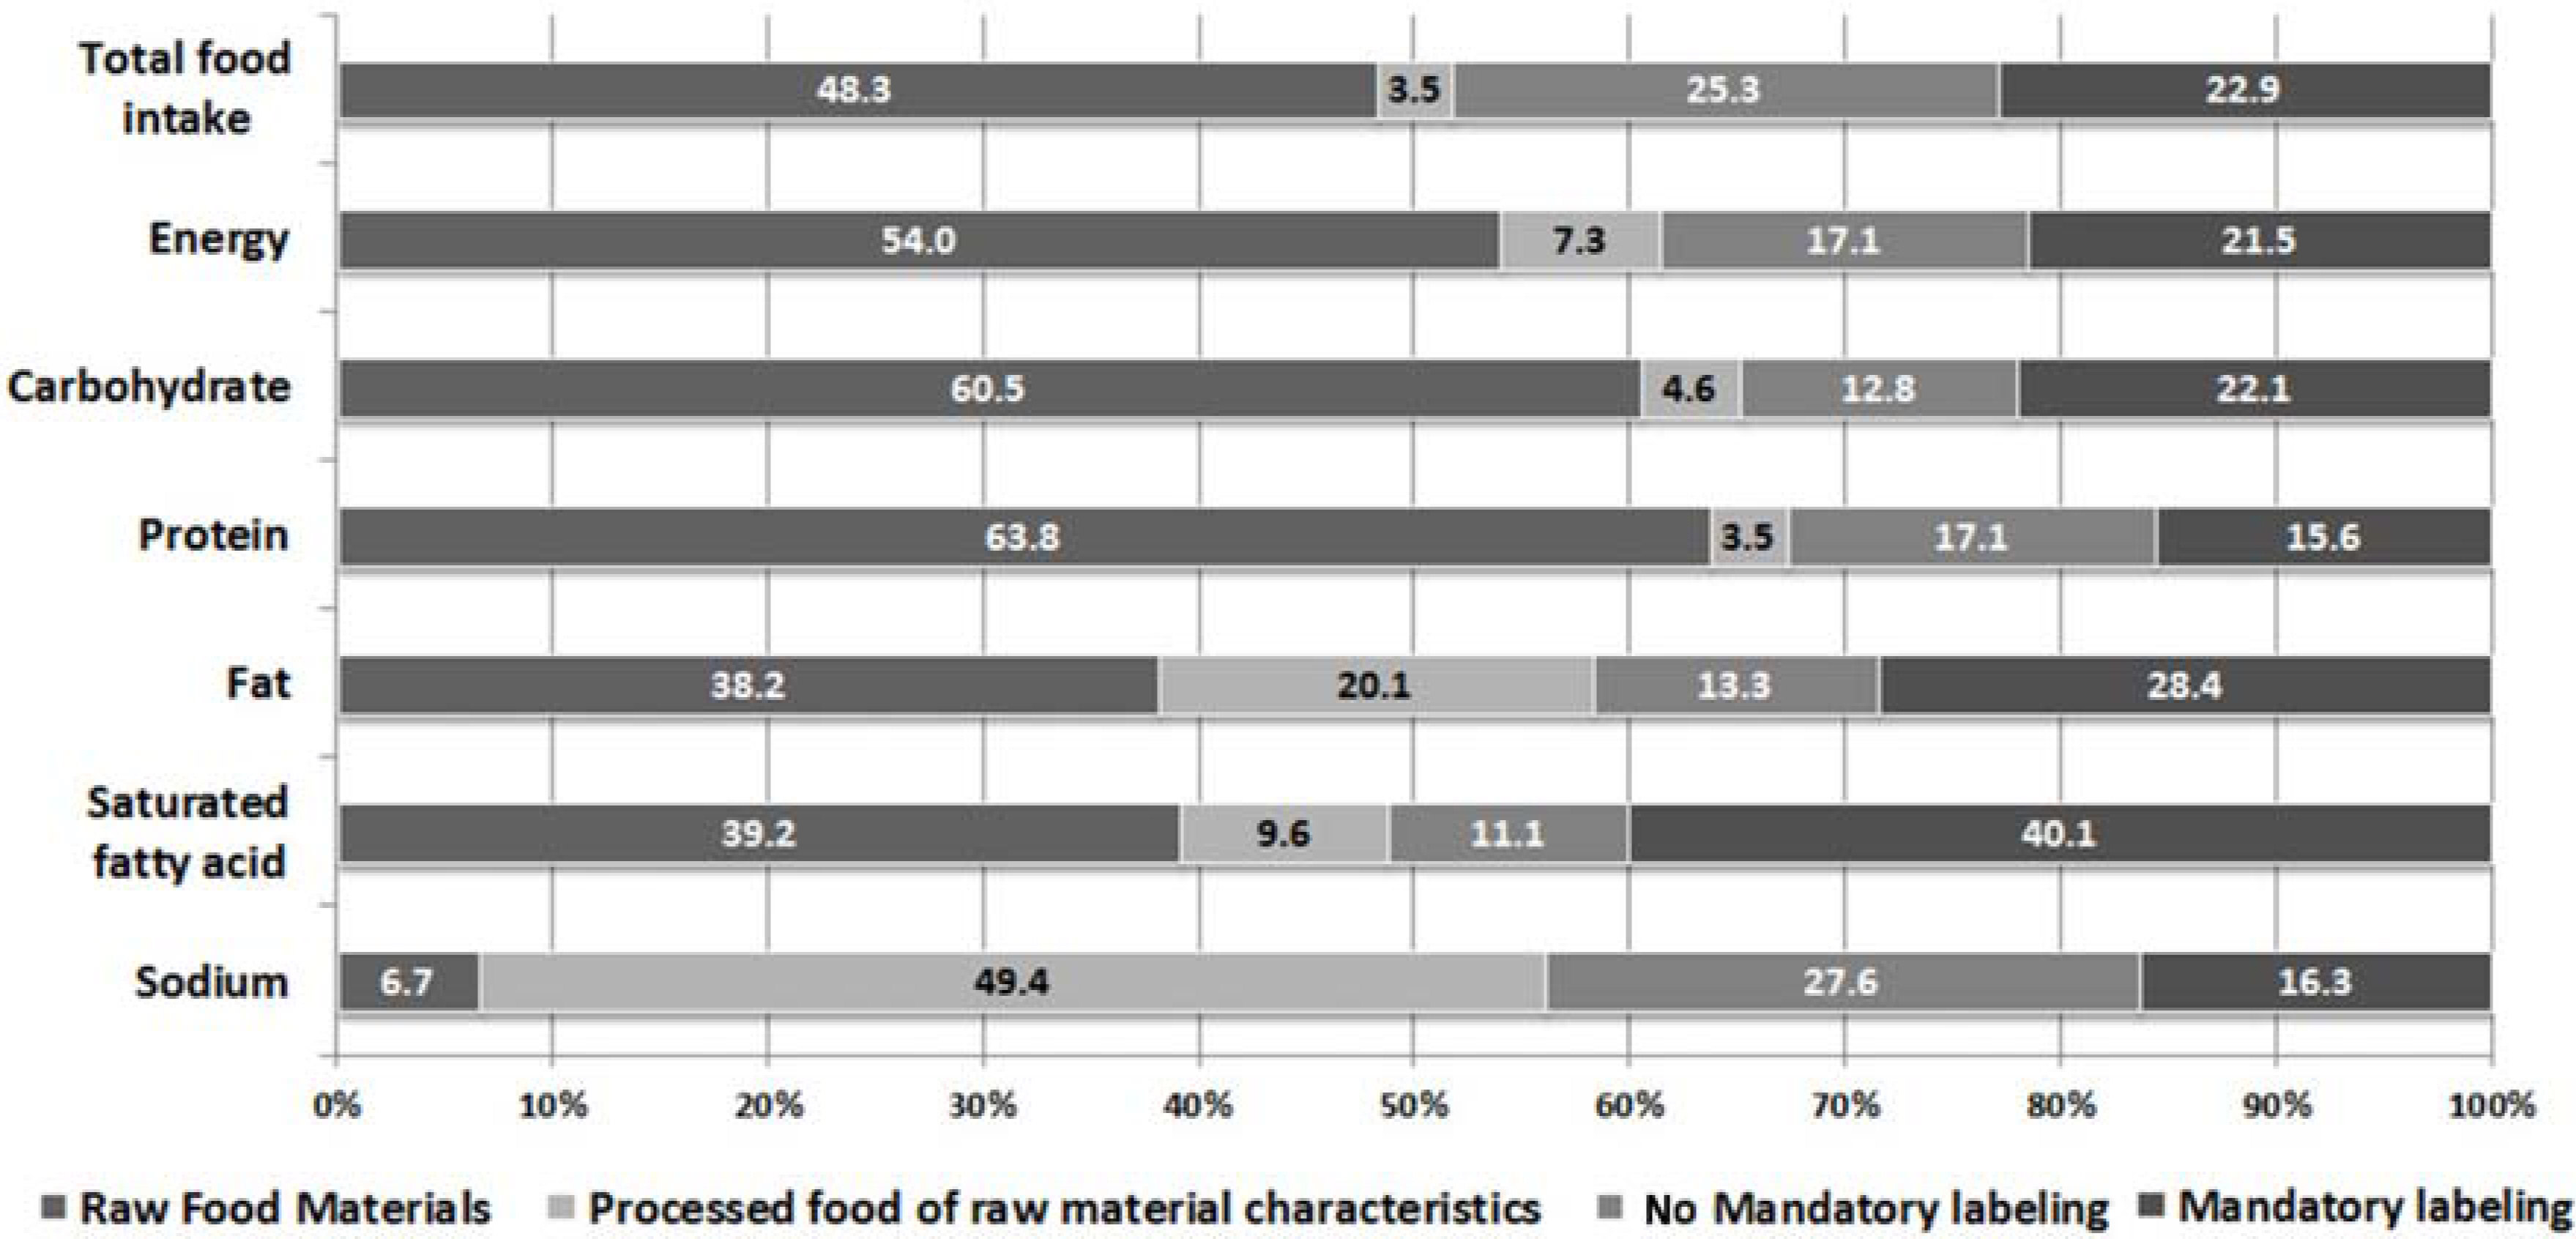
Fig. 1. Proportion of food and nutrient intake from 4 food groups according to the food type and nutrition labeling regulation
Reference
-
References
1. Korea Agro-Fisheries and Food Trade Corporation. 2016 Report of food industry information survey (4): Analysis of processed food consumer. Naju: Korea Agro-Fisheries and Food Trade Corporation;2016.2. Korea Health Industry Development Institute. 2013 food industry analysis report. Cheongju: Korea Health Industry Development Institute;2013.3. Ministry of Food and Drug Safety. The report on the nutrition labeling standardization. Cheongju: Ministry of Food and Drug Safety;1999.4. Korea Consumer Agency. A study on foods labelling standardization. Seoul: Korea Consumer Agency;1998.5. Neuhouser ML, Kristal AR, Patterson RE. Use of food nutrition labels is associated with lower fat intake. J Am Diet Assoc. 1999; 99(1):45–53.
Article6. Graham DJ, Laska MN. Nutrition label use partially mediates the relationship between attitude toward healthy eating and overall dietary quality among college students. J Acad Nutr Diet. 2012; 112(3):414–418.
Article7. Bae YJ. Evaluation of nutrient and food intake status, and dietary quality in Korean adults according to nutrition label utilization: Based on 2010–2011 Korean National Health and Nutrition Examination Survey. J Nutr Health. 2014; 47(3):193–205.
Article8. Park HJ, Lee JS, Kim EK. Assessment of nutrition label education in sixth grade elementary school students. J Korean Diet Assoc. 2010; 16(3):226–238.9. Chung EJ, Jeon JS, Ahn HS. Reading and understanding of food & nutrition labels and dietary behaviors of female middle and high school students. J Korean Diet Assoc. 2010; 16(3):239–254.10. Lee KA, Lee HJ, Park EJ. The effect of use of nutrition labelling on knowledge and perception of nutrition labelling, and awareness of nutrition labelling usefulness with among college students. J Korean Soc Food Sci Nutr. 2010; 39(2):253–266.
Article11. European Food Information Council. EUFIC's Global Update on Nutrition Labelling. Belgium: European Food Information Council;2015.12. Ministry of Health and Welfare. Korea Health Promotion Foundation, The 4th Health Plan 2016∼2020. Sejong: Ministry of Health and Welfare;2015.13. Ministry of Health and Welfare. The 2nd National Nutrition Management Plan 2017∼2021. Sejong: Ministry of Health and Welfare;2017.14. Ministry of Food and Drug Safety. Nutrition labeling of restaurant menu [Internet]. Ministry of Food and Drug Safety;2015. [cited 2018 Feb 3]. Available from:. https://www.mfds.go.kr/nutrition/index.do.15. Ministry of Health and Welfare, Korea Centers for Disease Control and Prevention. Korea Health Statistics 2013: Korea National Health and Nutrition Examination Survey (KNHANES VI-1). Cheongju: Korea Centers for Disease Control and Prevention;2014.16. Na MO. Palm oil in food industry: Thermal stability and processing quality. Food J. 2007; 120(1):40.17. Gapor AB, Ong ASH, Kato A, Watanabe H, Kawada T. Antioxidant activities of palm vitamin E with special reference to tocotrienols. Elaeis. 1989; 1(1):63–67.18. Anderson CA, Appel LJ, Okuda N, Brown IJ, Chan Q, Zhao L, et al. Dietary sources of sodium in China, Japan, the United Kingdom, and the United States, women and men aged 40 to 59 years: the INTERMAP study. J Am Diet Assoc. 2010; 110(5):736–745.
Article19. Song DY, Park JE, Shim JE, Lee JE. Trends in the major dish groups and food groups contributing to sodium intake in the Korea National Health and Nutrition Examination Survey 1998–2010. Korean J Nutr. 2013; 46(1):72–85.
Article20. Lee HS, Kwon SO, Yon MY, Kim DH, Lee JY, Nam JW, et al. Dietary total sugar intake of Koreans: Based on the Korea National Health and Nutrition Examination Survey (KNHANES), 2008–2011. J Nutr Health. 2014; 47(4):268–276.
Article
- Full Text Links
-
- Actions
-
Cited
- CITED
-
- Close
- Share
-
- Similar articles
-
- The Current Status and the Perspectives of Nutrition Survey
- Analysis of the Difference in Nutrients Intake, Dietary Behaviors and Food Intake Frequency of Single- and Non Single-Person Households: The Korea National Health and Nutrition Examination Survey (KNHANES), 2014–2016
- Utilization of Nutrition Labels and Its Relation to Nutrient Intake among Cancer Survivors: The 2019–2021 Korea National Health and Nutrition Examination Survey
- Development of a Dietary Fiber Composition Table and Intakes of Dietary Fiber in Korea National Health and Nutrition Examination Survey (KNHANES)
- Dietary Cholesterol Intake in the Korea National Health and Nutrition Examination Survey (KNHANES) VI (2013–2015)
