Hemoglobin A1c Levels Are Slightly but Significantly Lower in Normoglycemic Subjects With the Hemoglobin E Phenotype
- Affiliations
-
- 1Department of Clinical Pathology, Faculty of Medicine Siriraj Hospital, Mahidol University, Bangkok, Thailand. busadee.pra@mahidol.ac.th
- 2Division of Clinical Epidemiology, Faculty of Medicine Siriraj Hospital, Mahidol University, Bangkok, Thailand.
- 3Point-of-Care Testing Center for Teaching and Research (POCT·CTR), School of Medicine, University of California, Davis, California, USA.
- 4Department of Laboratory Medicine, National University Hospital, Singapore.
- KMID: 2425978
- DOI: http://doi.org/10.3343/alm.2019.39.2.209
Abstract
- Hb mutations can alter the structure, behavior, stability, or quantity of the globin chain produced. Some Hb variants shorten the erythrocyte life span, resulting in physiologically lower hemoglobin A1c (HbA1c) levels. The hemoglobin E (HbE) phenotype involves a single-nucleotide polymorphism that reduces β-globin chain synthesis. We compared the HbA1c levels of subjects with normal Hb (HbAA; N=131) and HbE (N=148) phenotypes, examining potential hematological and biochemical factors contributing to differences in HbA1c levels. All had normal fasting plasma glucose ( < 5.6 mmol/L), AST, ALT, and creatinine levels. Mean±SD HbA1c levels differed between HbAA and HbE subjects: 5.5±0.3% and 5.3±0.3% (P < 0.001) according to an immunoassay, and 5.5±0.3% and 5.3±0.3% (P < 0.001) according to cation-exchange HPLC, respectively. In multiple logistic regression, only mean corpuscular volume (P < 0.001) contributed to the difference in HbA1c levels between groups. Although a 0.2% difference in HbA1c is relatively small and unlikely to alter clinical decisions, epidemiologically, this can lead to misclassification of a significant proportion of the population, especially since the threshold of non-diabetes HbA1c (≤5.6%) falls very close to the HbA1c median of the general population.
Keyword
MeSH Terms
Figure
-
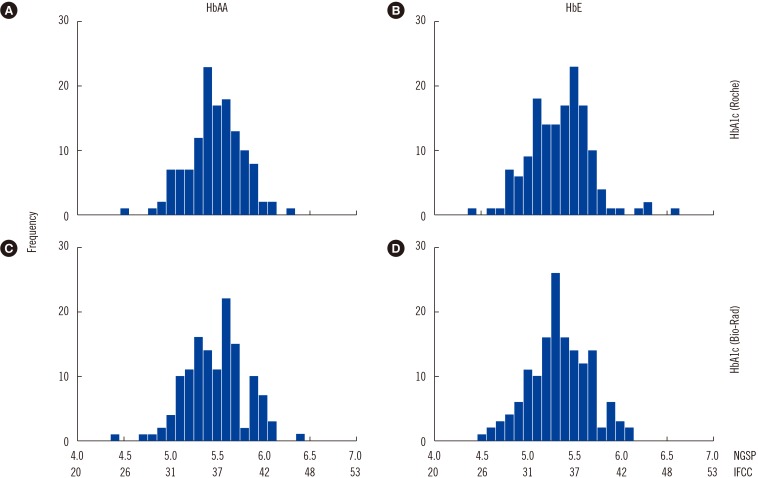
Fig. 1 Histogram of HbA1c results in the study population. (A) and (B) show HbA1c levels measured by the Roche Integra 800CTS immunoassay (Roche Diagnostics, Mannheim, Germany). (C) and (D) show HbA1c levels measured by Bio-Rad D10 HPLC (Bio-Rad Laboratories, Hercules, CA, USA).
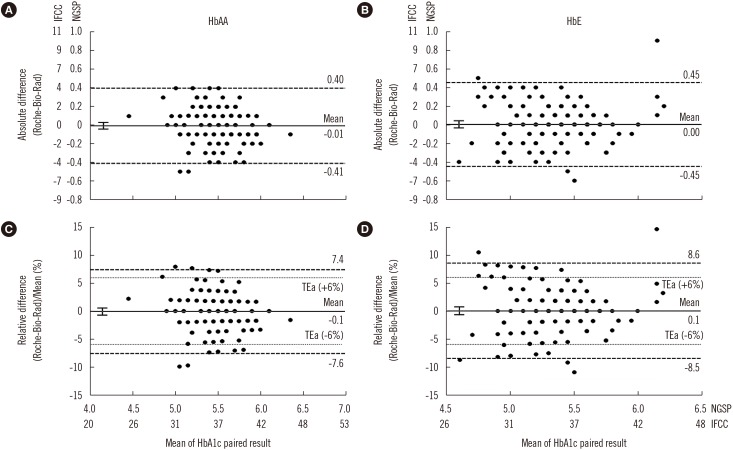
Fig. 2 Bland-Altman plots of HbA1c results for HbAA and HbE subjects. (A) and (B) show the absolute differences in HbA1c results between the immunoassay (Roche Integra 800CTS; Roche Diagnostics, Mannheim, Germany) and cation-exchange HPLC (Bio-Rad D-10; Bio-Rad Laboratories, Hercules, CA, USA). (C) and (D) show percentage of the mean differences in HbA1c results. Left panels are for HbAA subjects (N=131) and right panels are for HbE subjects (N=148). The bold solid lines denote mean bias and 95% confidence intervals. The dashed lines denote the 95% limits of agreement of the difference, and the dotted lines denote the College of American Pathologists allowable total error (TEa, ±6%) [17].
Reference
-
1. Borg R, Kuenen JC, Carstensen B, Zheng H, Nathan DM, Heine RJ, et al. Associations between features of glucose exposure and A1C: the A1C-Derived Average Glucose (ADAG) study. Diabetes. 2010; 59:1585–1590. PMID: 20424232.2. Loh TP, Sethi SK, Wong MS, Tai ES, Kao SL. Relationship between measured average glucose by continuous glucose monitor and HbA1c measured by three different routine laboratory methods. Clin Biochem. 2015; 48:514–518. PMID: 25738920.3. American Diabetes Association. 2. Classification and diagnosis of diabetes: standards of medical care in Diabetes-2018. Diabetes Care. 2018; 41(S1):S13–S27. PMID: 29222373.4. Forget BG, Bunn HF. Classification of the disorders of hemoglobin. Cold Spring Harb Perspect Med. 2013; 3:a011684. PMID: 23378597.5. Kohne E. Hemoglobinopathies: clinical manifestations, diagnosis, and treatment. Dtsch Arztebl Int. 2011; 108:532–540. PMID: 21886666.6. Rhea JM, Molinaro R. Pathology consultation on HbA(1c) methods and interferences. Am J Clin Pathol. 2014; 141:5–16. PMID: 24343732.7. Vichinsky E. Hemoglobin E syndromes. Hematology Am Soc Hematol Educ Program. 2007; 79–83. PMID: 18024613.8. Modell B, Darlison M. Global epidemiology of haemoglobin disorders and derived service indicators. Bull World Health Organ. 2008; 86:480–487. PMID: 18568278.9. Little RR, Rohlfing CL, Hanson S, Connolly S, Higgins T, Weykamp CW, et al. Effects of hemoglobin (Hb) E and HbD traits on measurements of glycated Hb (HbA1c) by 23 methods. Clin Chem. 2008; 54:1277–1282. PMID: 18556332.10. Sthaneshwar P, Shanmugam H, Swan VG, Nasurdin N, Tanggaiah K. Effect of HbE heterozygosity on the measurement of HbA1c. Pathology. 2013; 45:417–419. PMID: 23635828.11. Azizi A, Sthaneshwar P, Shanmugam H, Arumugam S. Effect of HbE trait on measurement of HbA1c by three different methods. Pathology. 2015; 47:495–497. PMID: 26126045.12. Loh TP, Cheng WL, Kao SL, Thai AC, Sethi SK. Effects of haemoglobin E traits on HbA1c measurement by two cation-exchange HPLC and two immunoturbidimetric methods. Pathology. 2014; 46:265–266. PMID: 24614710.13. Paisooksantivatana K, Kongsomgan A, Banyatsuppasin W, Khupulsup K. Influence of hemoglobin E on measurement of hemoglobin A1c by immunoassays. Diabetes Res Clin Pract. 2009; 83:e84–e85. PMID: 19110335.14. Friedewald WT, Levy RI, Fredrickson DS. Estimation of the concentration of low-density lipoprotein cholesterol in plasma, without use of the preparative ultracentrifuge. Clin Chem. 1972; 18:499–502. PMID: 4337382.15. Weykamp C. HbA1c: a review of analytical and clinical aspects. Ann Lab Med. 2013; 33:393–400. PMID: 24205486.16. Fucharoen S, Tanphaichitr V, Torcharus K, Viprakasit V, Meekaewkunchorn A. Clinical practice guidelines for diagnosis and management of thalassemia syndromes. Bangkok: PALiving;2014. p. 9–18.17. Little RR, Rohlfing CL. Assessing quality from an accuracy-based HbA1c proficiency survey. Clin Chem Lab Med. 2016; 54:e75–e76. PMID: 26650077.18. Loh TP, Ma S, Heng D, Khoo CM. Age-related changes in the cardiometabolic profiles in Singapore resident adult population: findings from the National Health survey 2010. PLoS One. 2016; 11:e0162102. PMID: 27570971.19. Saaddine JB, Fagot-Campagna A, Rolka D, Narayan KM, Geiss L, Eberhardt M, et al. Distribution of HbA(1c) levels for children and young adults in the U.S.: third National Health and Nutrition Examination Survey. Diabetes Care. 2002; 25:1326–1330. PMID: 12145229.20. Charuruks N, Milintagas A, Watanaboonyoungcharoen P, Ariyaboonsiri C. Determination of reference intervals of HbA1c (DCCT/NGSP) and HbA1c (IFCC) in adults. J Med Assoc Thai. 2005; 88:810–816. PMID: 16083221.
- Full Text Links
-
- Actions
-
Cited
- CITED
-
- Close
- Share
-
- Similar articles
-
- Relationship between Glycemic Control and Diabetic Retinopathy
- Performance Evaluation of the ARKRAY ADAMS A1c HA-8180
- Factors Associated with Hemoglobin A1c among Patient Aged 40 years over with Diabetes Mellitus: 2012 Korea Health and Nutrition Examination Survey
- Effect of Iron Deficiency Anemia on Hemoglobin A1c Levels
- The Study Related to Perceived Stress, Stress Coping Method, Self-Care Behavior and Hemoglobin A1c of Elderly Diabetic Mellitus Patients
