Cell-in-Cell Death Is Not Restricted by Caspase-3 Deficiency in MCF-7 Cells
- Affiliations
-
- 1The State Key Clinical Specialty in Allergy, the Second Affiliated Hospital of Guangzhou Medical University, Guangzhou, China. taoailin@gzhmu.edu.cn
- 2Guangdong Provincial Key Laboratory of Allergy & Clinical Immunology, Guangzhou Medical University, Guangzhou, China.
- 3The State Key Laboratory of Respiratory Disease, Guangzhou Medical University, Guangzhou, China.
- 4Department of Gastroenterology, The First Affiliated Hospital, Sun Yat-Sen University, Guangzhou, China.
- KMID: 2413947
- DOI: http://doi.org/10.4048/jbc.2016.19.3.231
Abstract
- PURPOSE
Cell-in-cell structures are created by one living cell entering another homotypic or heterotypic living cell, which usually leads to the death of the internalized cell, specifically through caspase-dependent cell death (emperitosis) or lysosome-dependent cell death (entosis). Although entosis has attracted great attention, its occurrence is controversial, because one cell line used in its study (MCF-7) is deficient in caspase-3.
METHODS
We investigated this issue using MCF-7 and A431 cell lines, which often display cell-in-cell invasion, and have different levels of caspase-3 expression. Cell-in-cell death morphology, microstructures, and signaling pathways were compared in the two cell lines.
RESULTS
Our results confirmed that MCF-7 cells are caspase-3 deficient with a partial deletion in the CASP-3 gene. These cells underwent cell death that lacked typical apoptotic properties after staurosporine treatment, whereas caspase-3-sufficient A431 cells displayed typical apoptosis. The presence of caspase-3 was related neither to the lysosome-dependent nor to the caspase-dependent cell-in-cell death pathway. However, the existence of caspase-3 was associated with a switch from lysosome-dependent cell-in-cell death to the apoptotic cell-in-cell death pathway during entosis. Moreover, cellular hypoxia, mitochondrial swelling, release of cytochrome C, and autophagy were observed in internalized cells during entosis.
CONCLUSION
The occurrence of caspase-independent entosis is not a cell-specific process. In addition, entosis actually represents a cellular self-repair system, functioning through autophagy, to degrade damaged mitochondria resulting from cellular hypoxia in cell-in-cell structures. However, sustained autophagy-associated signal activation, without reduction in cellular hypoxia, eventually leads to lysosome-dependent intracellular cell death.
Keyword
MeSH Terms
Figure
-
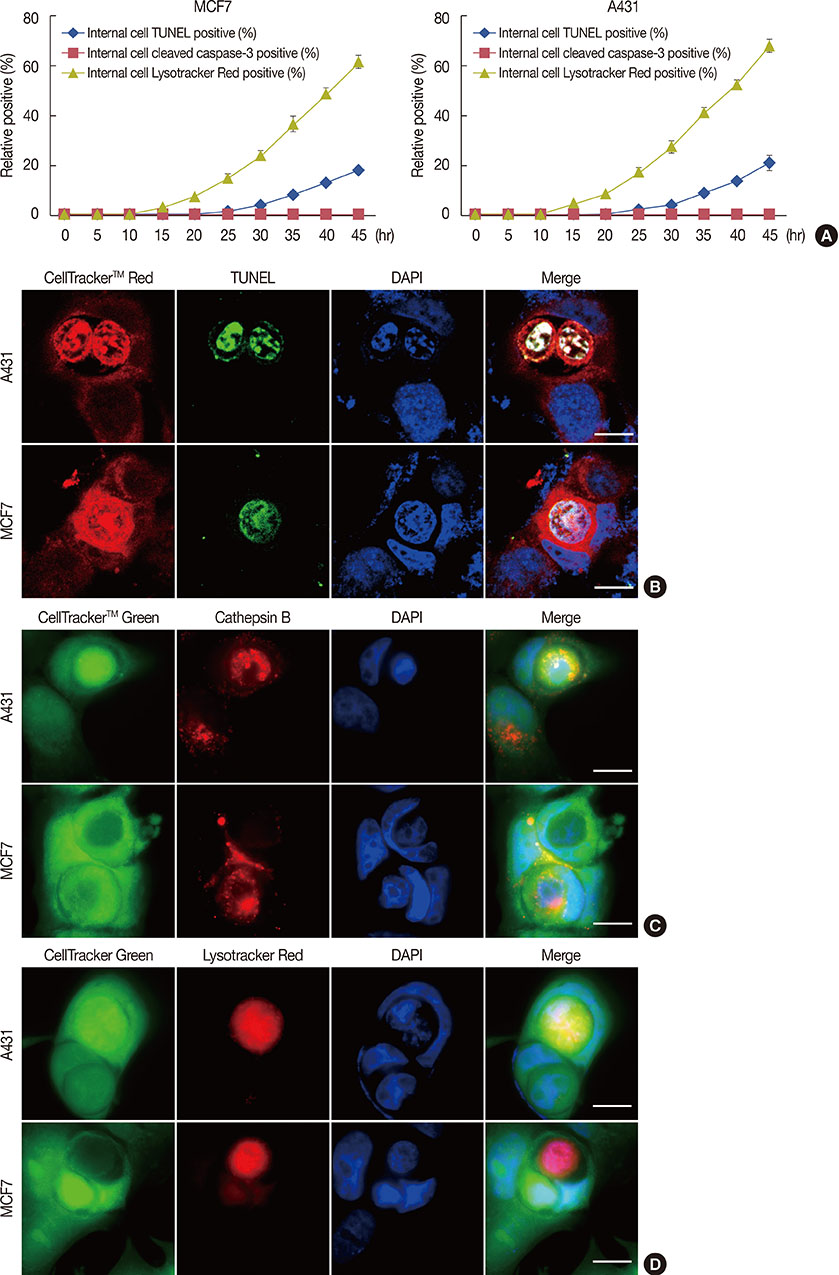
Figure 1 Lysosome-dependent cell-in-cell death of A431 and MCF-7 cell lines. (A) Kinetic quantification of internalized terminal-deoxynucleotidyl transferase mediated nick end labeling (TUNEL) positive cells, internalized cells containing cleaved caspase-3 and internalized cells demonstrating lysosome activation in cell-in-cell structures of A431 cells and MCF-7 cells. One representative experiment of three independent experiments is shown. Data are presented as means±SD. (B) Confocal images show TUNEL positive (green) and DNA fragmentation (blue) of internalized A431 cells (red) and MCF-7 cells (red) at 48 hours. Both internalized A431 and MCF-7 showed inconspicuous changes in cell size and gradual nuclei degradation after entosis. Nuclei were labeled with 4',6-diamidino-2-phenylindole (DAPI). The scale bars are 10 µm. (C) As early as 6 hours after cell engulfment, the release of active cathepsin B (red) from the lysosomes into the plasma of the internalized cells was detected and was also seen in the surrounding cytoplasm of outer cells. Cells were stained with CellTracker™ Green and cell nuclei were labeled with DAPI. The scale bars are 10 µm. (D) A431 cells (green) and MCF-7 (green) cells are stained for lysosomes using LysoTracker™ Red (red), which binds to acidified compartments after 30 hours of culture. Confocal images show positive staining for cathepsin B in the cytoplasm of internalized cells. Scale bars are 10 µm.
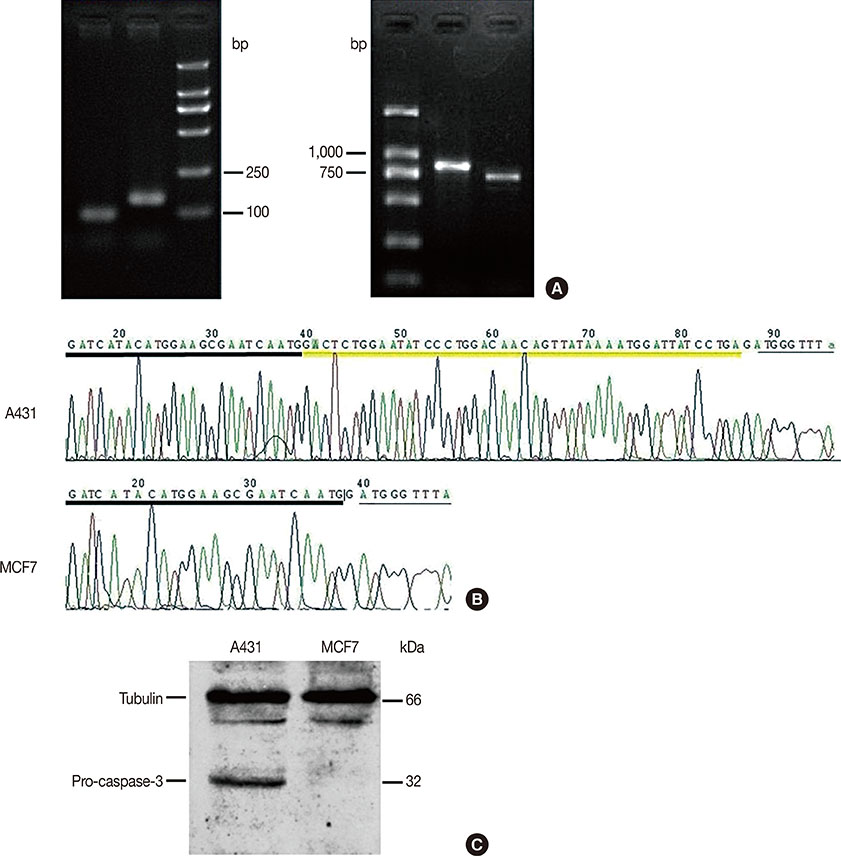
Figure 2 Deletion of partial CASP-3 genomic DNA in MCF-7 cells. (A) Images of DNA electrophoresis of the polymerase chain reaction (PCR) products for the CASP-3 genomic DNA and cDNA, respectively. Both PCR products from MCF-7 cells are shorter than those from A431 cells, resulting from a 47-base pair deletion within exon 4 of the human CASP-3 genomic DNA. (B) Sequencing results of the PCR products from the two cell lines. The yellow underline indicates the sequence of the deleted fragment. (C) Results of Western blotting analysis show expression of pro-caspase-3 protein in A431 cells but not in MCF-7 cells. Tubulin was used as loading control.

Figure 3 Absence of caspase-3 protein in MCF-7 cells leading to an atypical apoptosis. (A) Expression of cleaved caspase-3 protein in A431 cells but not in MCF-7 cells. Both tumor cell lines were treated with (+) or without (–) staurosporine (staurosp.) for 16 hours and the cell lysates were analyzed by Western blotting. β-Actin was used as loading control. (B) Cytotoxicity assays of A431 and MCF-7 cells using the LDH method after treatment with staurosporine for 16 hours. Cells treated with the solvent dimethyl sulphoxide (DMSO) were used as negative controls. (C) Terminal-deoxynucleoitidyl transferase mediated nick end labeling (TUNEL) assay showed similar mortalities of the two cell lines following treatment with staurosporine for 16 hours. (D) Confocal images show positive TUNEL staining in both A431 and MCF-7 cells after treatment with staurosporine. Nuclear pyknosis was obvious in dying A431 cells but not in dying MCF-7 cells. Cells were labeled with CellTracker™ Red, and cell nuclei were stained with 4',6-diamidino-2-phenylindole (DAPI). The scale bars are 10 µm. (E) Cell cycle analysis of A431 and MCF-7 cells treated with or without staurosporine for 8 hours. The sub-G1 apoptotic peak demonstrating nuclear pyknosis in apoptotic cells is seen before the G0/G1 peak in A431 cells but not in MCF-7 cells after apoptosis induction. (F) DNA was prepared from cells untreated or treated for 8 hours or 16 hours with staurosporine and analyzed using a 1.6% agarose gel. There was obvious DNA ladder formation in A431 but not in MCF-7 cells after apoptosis induction. Lane M: DNA ladder.
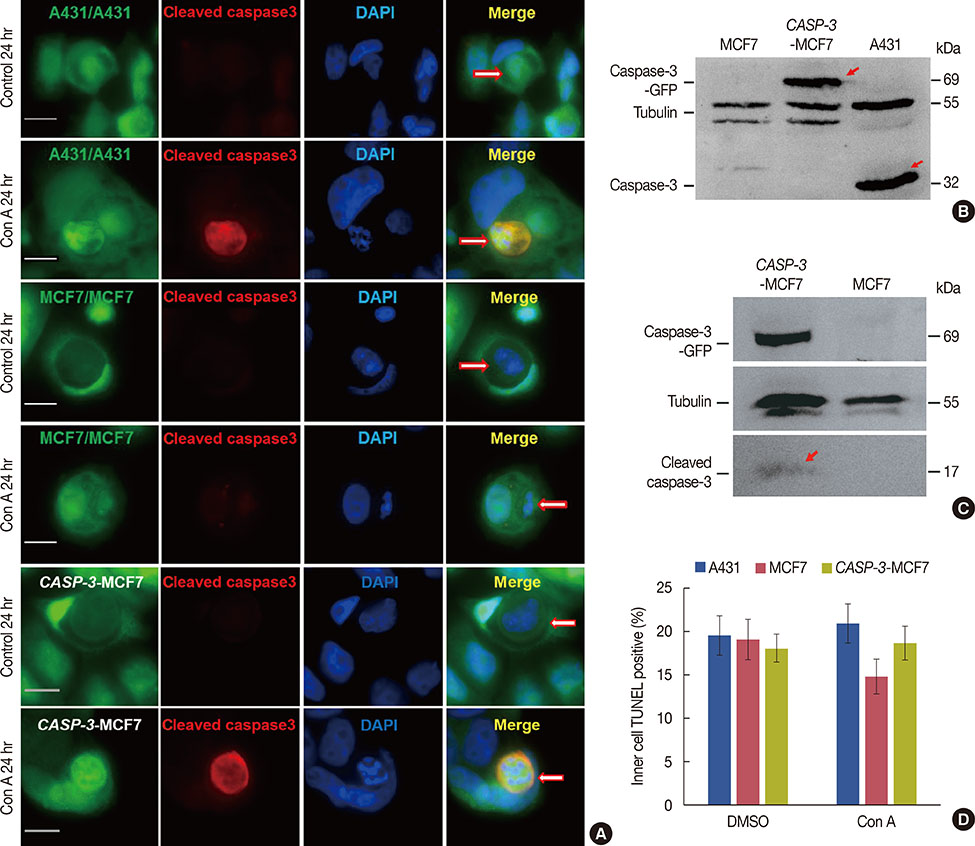
Figure 4 Entosis converting to apoptosis in the presence of caspase-3. (A) Immunofluorescence of cleaved caspase-3 activity in A431 cells, caspase-3 expressing MCF-7 cells and MCF-7 cells with or without concanamycin A (con A) treatment. The three kinds of cells showed typical lysosomal cell-in-cell death before treatment. After treatment we could see clear caspase-3 activation, nuclear shrinkage, nuclear pyknosis and other apoptotic forms in A431 and caspase-3 expressing MCF-7 cells. In contrast, no caspase-3 activity or other apoptosis characteristics was detected in MCF-7 cells after the same treatment. These pictures were taken after 24 hours of cell incubation. The scale bars are 10 µm. Arrows point to entosis cells. (B) Result of Western blot showed fusion protein caspase-3-green fluorescent protein (GFP) (arrows marked) expressed in caspase-3 expressing MCF-7 cells which was about 69 kDa. (C) Result of Western blotting showed caspase-3-GFP (69 kDa) and cleaved caspase-3 (17 kDa, arrow marked) were detected in caspase-3 expressing MCF-7 cells but not in MCF-7 cells. Both of the cells were treated with staurosporine for 16 hours. (D) Statistical analysis of cell-in-cell death of A431 cells, caspase-3 expressing MCF-7 cells and MCF-7 cells with or without Concanamycin A treatment for 48 hours determined by terminal-deoxynucleotidyl transferase mediated nick end labeling (TUNEL) assay. Data are presented as means±SD.
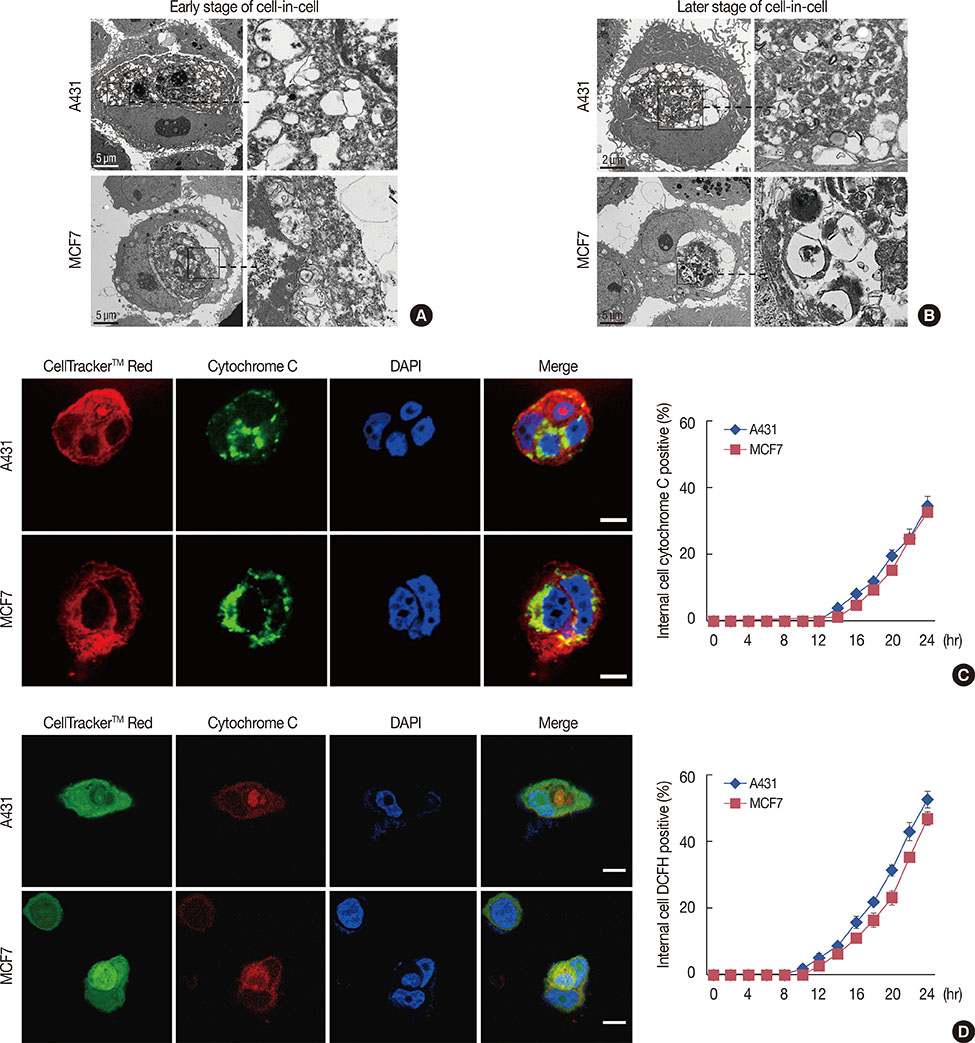
Figure 5 Cell autophagy against hypoxia leading to entosis. (A) Transmission electron microscope images show the ultrastructures of A431 and MCF-7 cells undergoing entosis. Right panels show greater details of left panels. Images show mitochondria swelling and DNA degradation of internalized cells at the early stage of cell-in-cell formation. (B) Images show internal cells completely losing their morphology with a large number of autophagic vacuoles and autophagic lysosomes at a later stage of cell-in-cell formation. (C) We used anticytochrome C antibody, which can only bind to cytochrome C released from mitochondria and indicates mitochondrial injury. Confocal images show strong fluorescence (green) in the cytoplasm of the internalized cells. Cells were labeled with CellTracker™ Red and cell nuclei were stained with DAPI. The scale bars are 10 µm. The right diagram shows the kinetics of cytochrome C release in the internalized tumor cells. (D) 2',7'-Dichlorofluorescin diacetate (DCFI-DA) was used to detect reactive oxygen species (ROS) in internalized cells of cell-in-cell structure. Confocal images show clear ROS (red) in the cytoplasm of internalized cells. Cells were labeled with CellTracker™ Green, and cell nuclei were stained with 4',6-diamidino-2-phenylindole (DAPI). The scale bars are 10 µm, which has been described in the legend in Figure 5. The right diagram displayed the kinetics of ROS positive internalized cells in cell-in-cell structures.
Reference
-
1. Kroemer G, Galluzzi L, Vandenabeele P, Abrams J, Alnemri ES, Baehrecke EH, et al. Classification of cell death: recommendations of the Nomenclature Committee on Cell Death 2009. Cell Death Differ. 2009; 16:3–11.
Article2. Overholtzer M, Mailleux AA, Mouneimne G, Normand G, Schnitt SJ, King RW, et al. A nonapoptotic cell death process, entosis, that occurs by cell-in-cell invasion. Cell. 2007; 131:966–979.
Article3. Wang S, Guo Z, Xia P, Liu T, Wang J, Li S, et al. Internalization of NK cells into tumor cells requires ezrin and leads to programmed cell-in-cell death. Cell Res. 2009; 19:1350–1362.
Article4. Overholtzer M, Brugge JS. The cell biology of cell-in-cell structures. Nat Rev Mol Cell Biol. 2008; 9:796–809.
Article5. Wang S, He MF, Chen YH, Wang MY, Yu XM, Bai J, et al. Rapid reuptake of granzyme B leads to emperitosis: an apoptotic cell-in-cell death of immune killer cells inside tumor cells. Cell Death Dis. 2013; 4:e856.
Article6. Fais S. Cannibalism: a way to feed on metastatic tumors. Cancer Lett. 2007; 258:155–164.
Article7. Benseler V, Warren A, Vo M, Holz LE, Tay SS, Le Couteur DG, et al. Hepatocyte entry leads to degradation of autoreactive CD8 T cells. Proc Natl Acad Sci U S A. 2011; 108:16735–16740.
Article8. Florey O, Kim SE, Sandoval CP, Haynes CM, Overholtzer M. Autophagy machinery mediates macroendocytic processing and entotic cell death by targeting single membranes. Nat Cell Biol. 2011; 13:1335–1343.
Article9. Chen YH, Wang S, He MF, Wang Y, Zhao H, Zhu HY, et al. Prevalence of heterotypic tumor/immune cell-in-cell structure in vitro and in vivo leading to formation of aneuploidy. PLoS One. 2013; 8:e59418.
Article10. Jänicke RU. MCF-7 breast carcinoma cells do not express caspase-3. Breast Cancer Res Treat. 2009; 117:219–221.
Article11. Feng FF, Zhang DR, Tian KL, Lou HY, Qi XL, Wang YC, et al. Growth inhibition and induction of apoptosis in MCF-7 breast cancer cells by oridonin nanosuspension. Drug Deliv. 2011; 18:265–271.
Article12. Chen JS, Konopleva M, Andreeff M, Multani AS, Pathak S, Mehta K. Drug-resistant breast carcinoma (MCF-7) cells are paradoxically sensitive to apoptosis. J Cell Physiol. 2004; 200:223–234.
Article13. Jänicke RU, Sprengart ML, Wati MR, Porter AG. Caspase-3 is required for DNA fragmentation and morphological changes associated with apoptosis. J Biol Chem. 1998; 273:9357–9360.
Article14. Langford MP, Chen D, Gosslee J, Misra RP, Redens TB, Texada DE. Intracameral toxicity of bacterial components muramyl dipeptide and staurosporine: ciliary cyst formation, epithelial cell apoptosis and necrosis. Cutan Ocul Toxicol. 2006; 25:85–101.
Article15. Li M, Khambu B, Zhang H, Kang JH, Chen X, Chen D, et al. Suppression of lysosome function induces autophagy via a feedback down-regulation of MTOR complex 1 (MTORC1) activity. J Biol Chem. 2013; 288:35769–35780.
Article16. Lugini L, Matarrese P, Tinari A, Lozupone F, Federici C, Iessi E, et al. Cannibalism of live lymphocytes by human metastatic but not primary melanoma cells. Cancer Res. 2006; 66:3629–3638.
Article17. Rausch V, Liu L, Apel A, Rettig T, Gladkich J, Labsch S, et al. Autophagy mediates survival of pancreatic tumour-initiating cells in a hypoxic microenvironment. J Pathol. 2012; 227:325–335.
Article18. Wojtkowiak JW, Gillies RJ. Autophagy on acid. Autophagy. 2012; 8:1688–1689.
Article19. Garg AD, Dudek AM, Ferreira GB, Verfaillie T, Vandenabeele P, Krysko DV, et al. ROS-induced autophagy in cancer cells assists in evasion from determinants of immunogenic cell death. Autophagy. 2013; 9:1292–1307.
Article20. Macintosh RL, Ryan KM. Autophagy in tumour cell death. Semin Cancer Biol. 2013; 23:344–351.
Article21. Denton D, Nicolson S, Kumar S. Cell death by autophagy: facts and apparent artefacts. Cell Death Differ. 2012; 19:87–95.
Article22. Minina EA, Bozhkov PV, Hofius D. Autophagy as initiator or executioner of cell death. Trends Plant Sci. 2014; 19:692–697.
Article
- Full Text Links
-
- Actions
-
Cited
- CITED
-
- Close
- Share
-
- Similar articles
-
- Apoptotic Effects of 6-Gingerol in Human Breast Cancer Cells
- Effects of Triterpenoids from Luvunga scandens on Cytotoxic, Cell Cycle Arrest and Gene Expressions in MCF-7 Cells
- Cell Death Induction Mechanism of Non-small Cell Lung Cancer Cell Line, NCI-H1703 by Docetaxel
- Caspase is Regulated by ROS in CT Induced Neuronal Cell Death
- Cell Death and Immunity
