Molecular Signature for Lymphatic Invasion Associated with Survival of Epithelial Ovarian Cancer
- Affiliations
-
- 1Department of Obstetrics and Gynecology, Samsung Medical Center, Sungkyunkwan University School of Medicine, Seoul, Korea. chelhun.choi@samsung.com
- KMID: 2411135
- DOI: http://doi.org/10.4143/crt.2017.104
Abstract
- PURPOSE
We aimed to develop molecular classifier that can predict lymphatic invasion and their clinical significance in epithelial ovarian cancer (EOC) patients.
MATERIALS AND METHODS
We analyzed gene expression (mRNA, methylated DNA) in data from The Cancer Genome Atlas. To identify molecular signatures for lymphatic invasion, we found differentially expressed genes. The performance of classifier was validated by receiver operating characteristics analysis, logistic regression, linear discriminant analysis (LDA), and support vector machine (SVM). We assessed prognostic role of classifier using random survival forest (RSF) model and pathway deregulation score (PDS). For external validation, we analyzed microarray data from 26 EOC samples of Samsung Medical Center and curatedOvarianData database.
RESULTS
We identified 21 mRNAs, and seven methylated DNAs from primary EOC tissues that predicted lymphatic invasion and created prognostic models. The classifier predicted lymphatic invasion well, which was validated by logistic regression, LDA, and SVM algorithm (C-index of 0.90, 0.71, and 0.74 for mRNA and C-index of 0.64, 0.68, and 0.69 for DNA methylation). Using RSF model, incorporating molecular data with clinical variables improved prediction of progression-free survival compared with using only clinical variables (p < 0.001 and p=0.008). Similarly, PDS enabled us to classify patients into high-risk and low-risk group, which resulted in survival difference in mRNA profiles (log-rank p-value=0.011). In external validation, gene signature was well correlated with prediction of lymphatic invasion and patients' survival.
CONCLUSION
Molecular signature model predicting lymphatic invasion was well performed and also associated with survival of EOC patients.
MeSH Terms
Figure
-

Fig. 1. Flowchart of analysis. TCGA, The Cancer Genome Atlas.
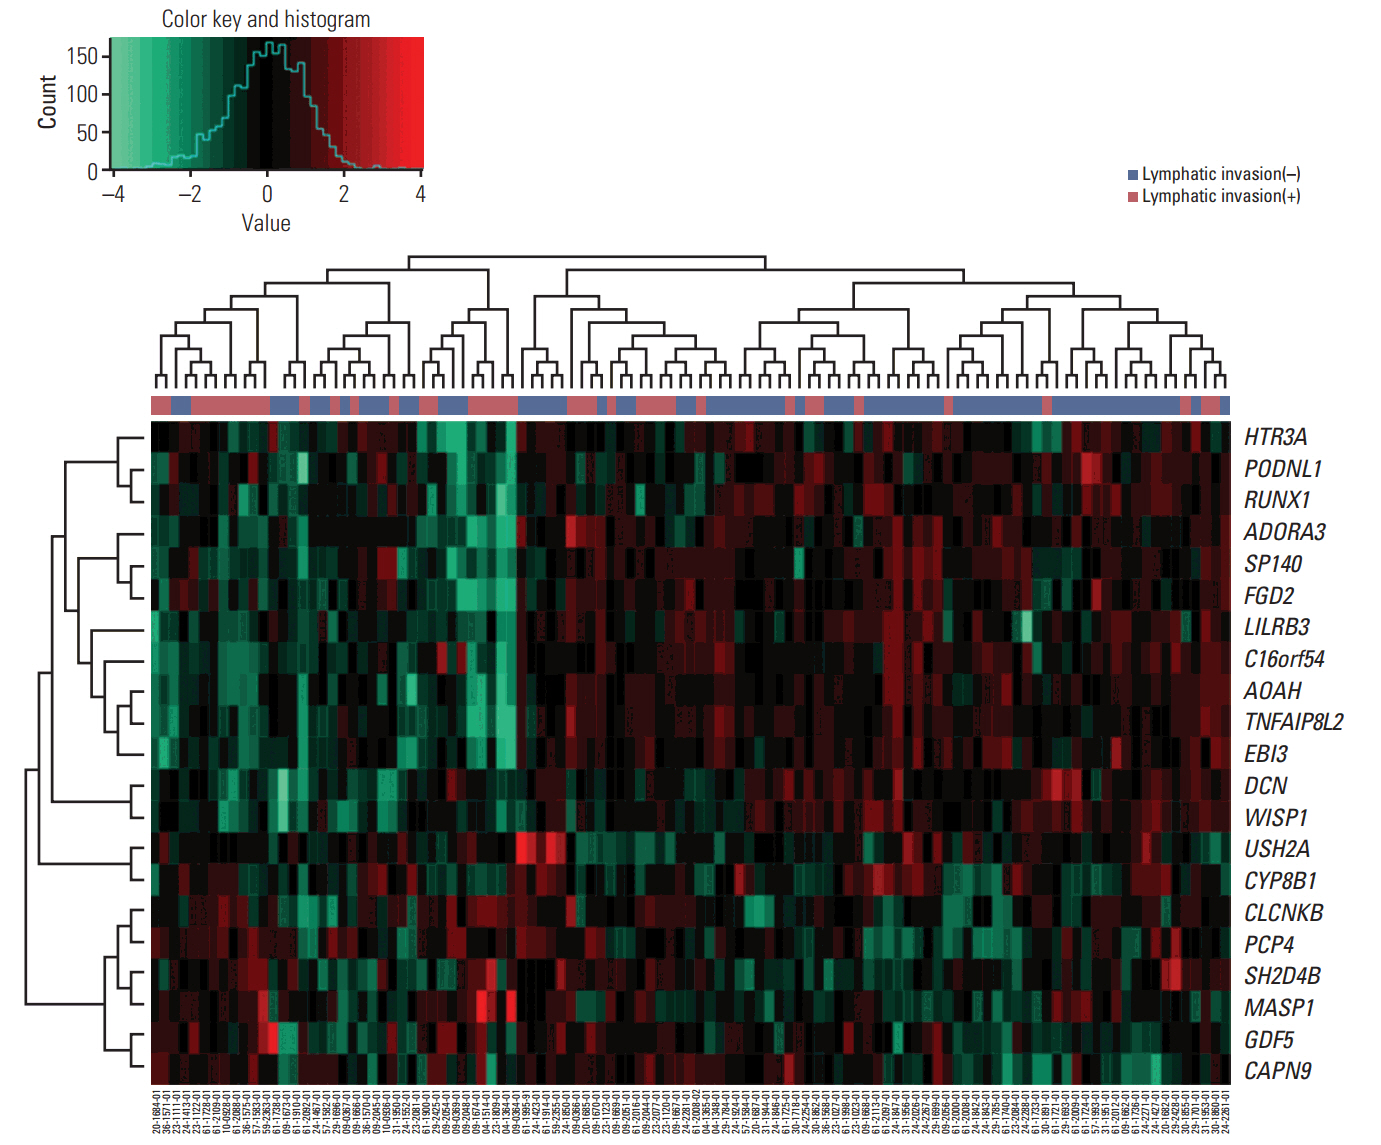
Fig. 2. Expression heat map of mRNAs included in the predictive model. Each column represents one patient and each row represents an mRNA included in the model (n=21), sorted on the basis of the established prognostic index. The plot above the heat map shows the specific risk score index for each sample. In the heatmap, green represents low expression and red represents high expression.

Fig. 3. Accuracy of predicting lymphatic invasion. (A, B) Receiver operating characteristic curve of the prediction of lymphatic invasion using molecular signatures. (C, D) Logistic regression with C-index. (E) Linear discrimination analysis (LDA). (F) Supporter vector machine (SVM). The Y-axis represents the accuracy of the C-index. AUC, area under the curve.

Fig. 4. Random survival forest model for prediction of survival. (A, B) Progression-free survival. (C, D) Overall survival.
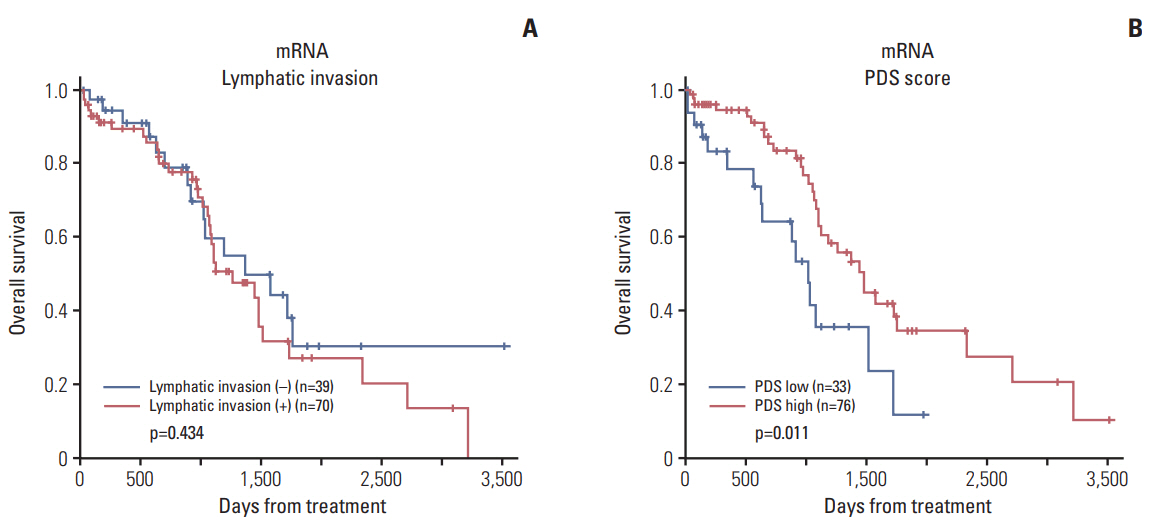
Fig. 5. Kaplan-Meier survival curve according to lymphatic invasion (A) and pathway deregulation score (PDS) (B). The graph according to PDS shows Kaplan-Meier plots of two groups defined by the level of deregulation (high and low) of primary tumor samples. High deregulation scores are associated with better prognosis.

Fig. 6. Validation with microarray data from 26 ovarian cancer samples from Samsung Medical Center. (A) Hierarchical clustering of gene expression according to lymphatic invasion. (B) Prediction accuracy of magnetic resonance imaging (MRI), molecular signature, and combination. (C, D) Random survival forest model showing incorporating molecular data and clinical variables improved the prediction of progression-free survival and overall survival.
Reference
-
References
1. Siegel RL, Miller KD, Jemal A. Cancer statistics, 2015. CA Cancer J Clin. 2015; 65:5–29.
Article2. Lim MC, Moon EK, Shin A, Jung KW, Won YJ, Seo SS, et al. Incidence of cervical, endometrial, and ovarian cancer in Korea, 1999-2010. J Gynecol Oncol. 2013; 24:298–302.
Article3. Jayson GC, Kohn EC, Kitchener HC, Ledermann JA. Ovarian cancer. Lancet. 2014; 384:1376–88.
Article4. Ahluwalia A, Yan P, Hurteau JA, Bigsby RM, Jung SH, Huang TH, et al. DNA methylation and ovarian cancer. I. Analysis of CpG island hypermethylation in human ovarian cancer using differential methylation hybridization. Gynecol Oncol. 2001; 82:261–8.5. Cannistra SA. Cancer of the ovary. N Engl J Med. 2004; 351:2519–29.
Article6. Rubin SC, Randall TC, Armstrong KA, Chi DS, Hoskins WJ. Ten-year follow-up of ovarian cancer patients after secondlook laparotomy with negative findings. Obstet Gynecol. 1999; 93:21–4.
Article7. Vaidya AP, Curtin JP. The follow-up of ovarian cancer. Semin Oncol. 2003; 30:401–12.
Article8. Matsuo K, Sheridan TB, Yoshino K, Miyake T, Hew KE, Im DD, et al. Significance of lymphovascular space invasion in epithelial ovarian cancer. Cancer Med. 2012; 1:156–64.
Article9. Lim MC, Lee JS, Nam BH, Seo SS, Kang S, Park SY. Lower extremity edema in patients with early ovarian cancer. J Ovarian Res. 2014; 7:28.
Article10. Kim SI, Lim MC, Lee JS, Lee Y, Park K, Joo J, et al. Impact of lower limb lymphedema on quality of life in gynecologic cancer survivors after pelvic lymph node dissection. Eur J Obstet Gynecol Reprod Biol. 2015; 192:31–6.
Article11. Swanton C, Caldas C. Molecular classification of solid tumours: towards pathway-driven therapeutics. Br J Cancer. 2009; 100:1517–22.
Article12. Cardin V, Friston KJ, Zeki S. Top-down modulations in the visual form pathway revealed with dynamic causal modeling. Cereb Cortex. 2011; 21:550–62.
Article13. Chin L, Gray JW. Translating insights from the cancer genome into clinical practice. Nature. 2008; 452:553–63.
Article14. Hanash S. Integrated global profiling of cancer. Nat Rev Cancer. 2004; 4:638–44.
Article15. Dettling M, Buhlmann P. Boosting for tumor classification with gene expression data. Bioinformatics. 2003; 19:1061–9.
Article16. Vapnik VN. An overview of statistical learning theory. IEEE Trans Neural Netw. 1999; 10:988–99.
Article17. Furey TS, Cristianini N, Duffy N, Bednarski DW, Schummer M, Haussler D. Support vector machine classification and validation of cancer tissue samples using microarray expression data. Bioinformatics. 2000; 16:906–14.
Article18. Ishwaran H, Kogalur UB. Consistency of random survival forests. Stat Probab Lett. 2010; 80:1056–64.
Article19. Drier Y, Sheffer M, Domany E. Pathway-based personalized analysis of cancer. Proc Natl Acad Sci U S A. 2013; 110:6388–93.
Article20. Hastie T, Stuetzle W. Principal curves. J Am Stat Assoc. 1989; 84:502–16.
Article21. Choi CH, Choi JJ, Park YA, Lee YY, Song SY, Sung CO, et al. Identification of differentially expressed genes according to chemosensitivity in advanced ovarian serous adenocarcinomas: expression of GRIA2 predicts better survival. Br J Cancer. 2012; 107:91–9.
Article22. Ganzfried BF, Riester M, Haibe-Kains B, Risch T, Tyekucheva S, Jazic I, et al. curatedOvarianData: clinically annotated data for the ovarian cancer transcriptome. Database (Oxford). 2013; 2013:bat013.
Article23. Harrell FE Jr, Lee KL, Mark DB. Multivariable prognostic models: issues in developing models, evaluating assumptions and adequacy, and measuring and reducing errors. Stat Med. 1996; 15:361–87.
Article24. Cancer Genome Atlas Research Network. Comprehensive genomic characterization defines human glio-blastoma genes and core pathways. Nature. 2008; 455:1061–8.25. Bibikova M, Lin Z, Zhou L, Chudin E, Garcia EW, Wu B, et al. High-throughput DNA methylation profiling using universal bead arrays. Genome Res. 2006; 16:383–93.
Article26. Riggio AI, Blyth K. The enigmatic role of RUNX1 in female-related cancers: current knowledge & future perspectives. FEBS J. 2017; 284:2345–62.27. Gurbuz I, Chiquet-Ehrismann R. CCN4/WISP1 (WNT1 inducible signaling pathway protein 1): a focus on its role in cancer. Int J Biochem Cell Biol. 2015; 62:142–6.
Article28. Davies SR, Watkins G, Mansel RE, Jiang WG. Differential expression and prognostic implications of the CCN family members WISP-1, WISP-2, and WISP-3 in human breast cancer. Ann Surg Oncol. 2007; 14:1909–18.
Article29. Riccardo F, Arigoni M, Buson G, Zago E, Iezzi M, Longo D, et al. Characterization of a genetic mouse model of lung cancer: a promise to identify non-small cell lung cancer therapeutic targets and biomarkers. BMC Genomics. 2014; 15 Suppl 3:S1.
Article30. Feng N, Ching T, Wang Y, Liu B, Lin H, Shi O, et al. Analysis of microarraydata on gene expression and methylation to identify long non-coding RNAs in non-small cell lung cancer. Sci Rep. 2016; 6:37233.
Article
- Full Text Links
-
- Actions
-
Cited
- CITED
-
- Close
- Share
-
- Similar articles
-
- Signature of arylacetamide deacetylase expression is associated with prognosis and immune infiltration in ovarian cancer
- Clinicopathologic Characteristics in Node-negative Gastric Cancer Patients According to the Presence of Lymphatic Invasion
- A Case of Recurrent Early-stage Epithelial Ovarian Cancer Presenting as Bone Metastasis
- p53, HER-2/neu Oncoprotein, and DNA Analysis in Epithelial Ovarian Cancer
- The relationship between serum p53 autoantibodies and prognostic relevance of epithelial ovarian cancer
