J Korean Ophthalmol Soc.
2017 Mar;58(3):321-326. 10.3341/jkos.2017.58.3.321.
The Effectiveness of Visual Field C10-2 in the Early Detection of Glaucoma with Parafoveal Scotoma
- Affiliations
-
- 1Department of Ophthalmology, Seoul St. Mary's Hospital, College of Medicine, The Catholic University of Korea, Seoul, Korea. lopilly@hanmail.net
- KMID: 2371913
- DOI: http://doi.org/10.3341/jkos.2017.58.3.321
Abstract
- PURPOSE
To identify the correspondence between the central sensitivity of several visual field (VF) tests and ganglion cell inner plexiform layer (GC-IPL) thickness in early glaucoma patients with parafoveal scotoma.
METHODS
Fifty-seven eyes from 57 patients with glaucomatous optic neuropathy and parafoveal scotoma were analyzed using the standard automated perimetry (SAP) C10-2 test, the SAP C24-2 test, and the frequency doubling technology perimetry (FDT) C24-2 test. The correlation between the VF central sensitivity and the GC-IPL thickness from macular scans via optical coherence tomography was analyzed.
RESULTS
The central sensitivity was 27.51 ± 5.43 dB, 27.39 ± 5.05 dB, and 22.09 ± 5.08 dB for SAP C24-2, SAP C10-2, and FDT C24-2, respectively. Mean GC-IPL thickness was 70.2 ± 8.5 µm. Using regression analysis, the value of log R² between the logarithmic central sensitivity and GC-IPL thickness was 0.498, and the linear R2 between the antilogarithmic central sensitivity and GC-IPL thickness in SAP C10-2 was 0.486, and both were statistically significant (p < 0.05). This relationship was stronger in early glaucoma patients compared to late glaucoma patients using SAP C10-2.
CONCLUSIONS
The structure-function relationship between GC-IPL thickness and central sensitivity was better with SAP C10-2, especially in early glaucoma patients, compared to other VF modalities.
Keyword
MeSH Terms
Figure
-
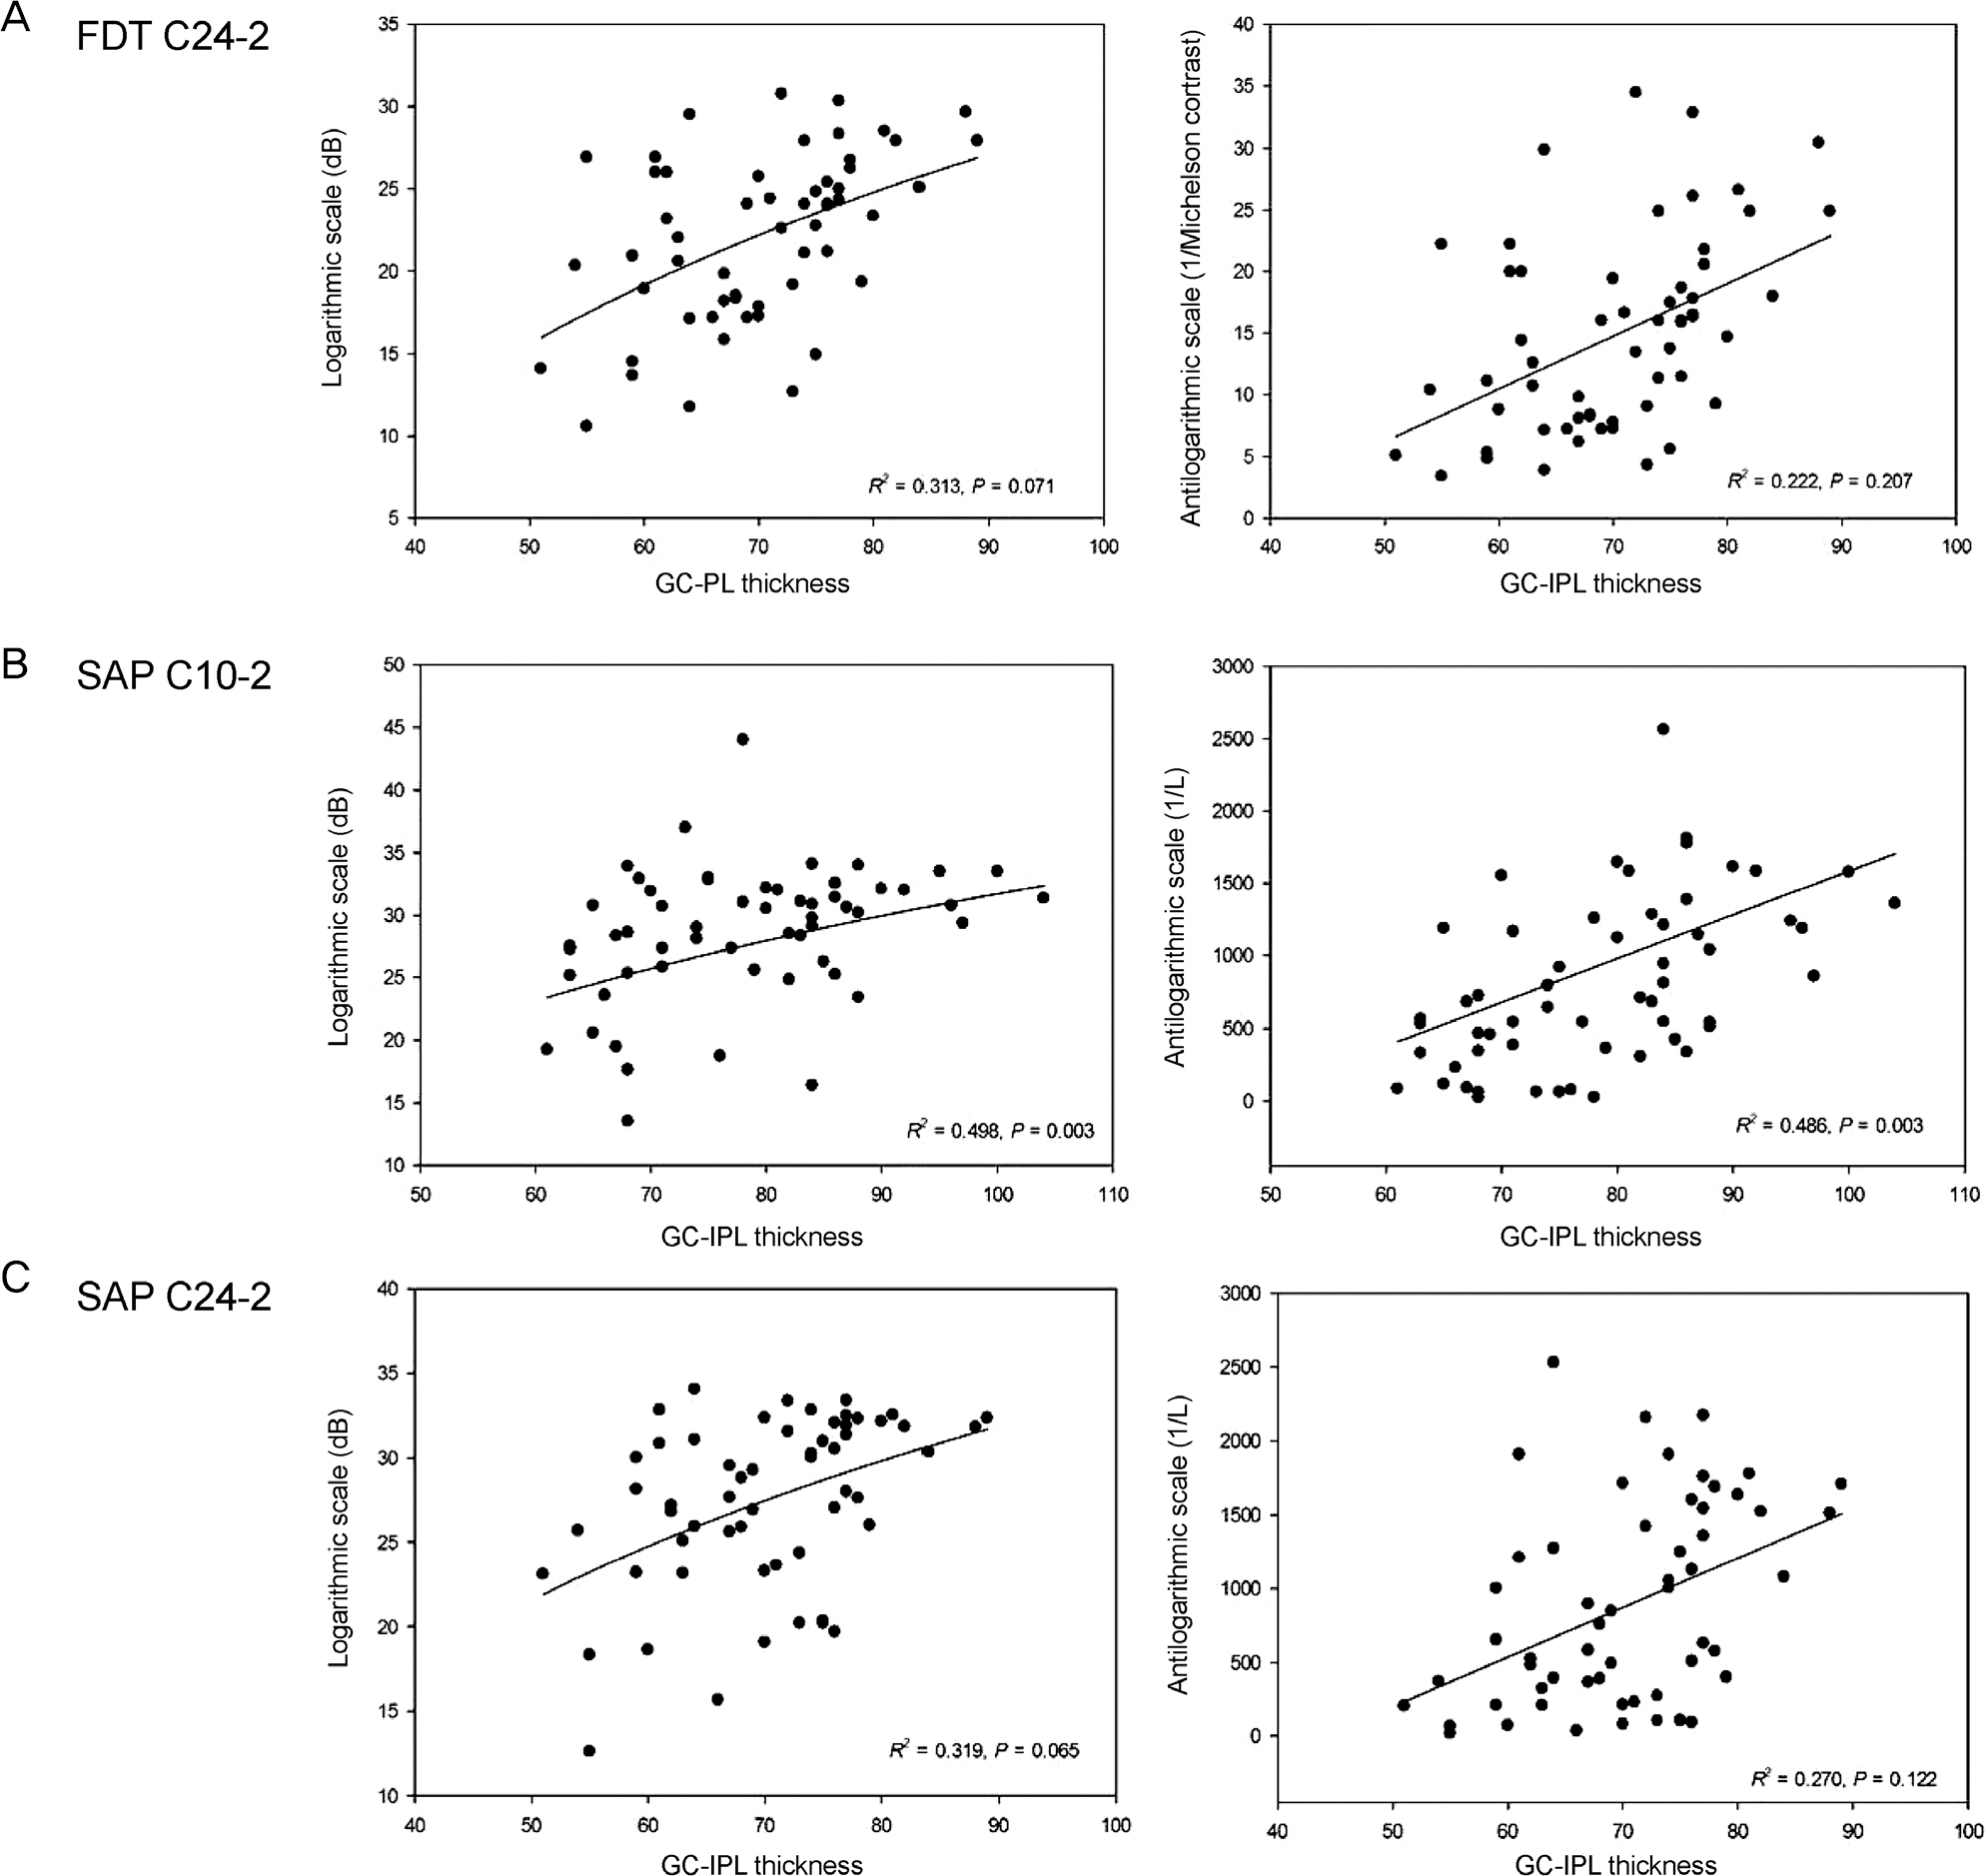
Figure 1. Correlation between average GC-IPL thickness and central mean sensitivity. (A) FDT C24-2. (B) SAP C10-2. (C) SAP C24-2. Logarithmic and linear coefficient of determination values (R2) corresponding to each scale(logarithmic scale, anti-logarithmic scale). GC-IPL = ganglion cell inner plexiform layer; FDT = frequency doubling technology perimetry; SAP = stand-ard automated perimetry.
Reference
-
References
1. Hood DC, Kardon RH. A framework for comparing structural and functional measures of glaucomatous damage. Prog Retin Eye Res. 2007; 26:688–710.
Article2. Quigley HA, Addicks EM, Green WR. Optic nerve damage in hu-man glaucoma. III. Quantitative correlation of nerve fiber loss and visual field defect in glaucoma, ischemic neuropathy, papilledema, and toxic neuropathy. Arch Ophthalmol. 1982; 100:135–46.3. Quigley HA, Dunkelberger GR, Green WR. Retinal ganglion cell atrophy correlated with automated perimetry in human eyes with glaucoma. Am J Ophthalmol. 1989; 107:453–64.
Article4. Anderson RS. The psychophysics of glaucoma: improving the structure/function relationship. Prog Retin Eye Res. 2006; 25:79–97.
Article5. . . Number of ganglion cells in glaucoma eyes compared with threshold visual field tests in the same persons. Invest Ophthalmol Vis Sci. 2000; 41:741–8.6. Johnson CA. Selective versus nonselective losses in glaucoma. J Glaucoma. 1994; (3 Suppl 1):S32–44.
Article7. Johnson CA. The Glenn A. Fry Award Lecture. Early losses of vis-ual function in glaucoma. Optom Vis Sci. 1995; 72:359–70.
Article8. Jung KI, Park HY, Park CK. Characteristics of optic disc morphol-ogy in glaucoma patients with parafoveal scotoma compared to pe-ripheral scotoma. Invest Ophthalmol Vis Sci. 2012; 53:4813–20.
Article9. Traynis I, De Moraes CG, Raza AS. . Prevalence and nature of early glaucomatous defects in the central 10° of the visual field. JAMA Ophthalmol. 2014; 132:291–7.
Article10. Shin HY, Park HY, Jung KI. . Glaucoma diagnostic ability of ganglion cell-inner plexiform layer thickness differs according to the location of visual field loss. Ophthalmology. 2014; 121:93–9.
Article11. Park HY, Hwang BE, Shin HY, Park CK. Clinical clues to predict the presence of parafoveal scotoma on humphrey 10-2 visual field using a humphrey 24-2 visual field. Am J Ophthalmol. 2016; 161:150–9.
Article12. Park SC, Kung Y, Su D. . Parafoveal scotoma progression in glaucoma: humphrey 10-2 versus 24-2 visual field analysis. Ophthalmology. 2013; 120:1546–50.13. Hangai M, Ikeda HO, Akagi T, Yoshimura N. Paracentral scotoma in glaucoma detected by 10-2 but not by 24-2 perimetry. Jpn J Ophthalmol. 2014; 58:188–96.
Article14. Brusini P, Salvetat ML, Zeppieri M, Parisi L. Frequency doubling technology perimetry with the Humphrey Matrix 30-2 test. J Glaucoma. 2006; 15:77–83.
Article15. Medeiros FA, Sample PA, Zangwill LM. . A statistical ap-proach to the evaluation of covariate effects on the receiver operat-ing characteristic curves of diagnostic tests in glaucoma. Invest Ophthalmol Vis Sci. 2006; 47:2520–7.
Article16. Racette L, Medeiros FA, Zangwill LM. . Diagnostic accuracy of the Matrix 24-2 and original N-30 frequency-doubling technol-ogy tests compared with standard automated perimetry. Invest Ophthalmol Vis Sci. 2008; 49:954–60.
Article17. Jung KI, Kang MK, Choi JA. . Structure-function relationship in glaucoma patients with parafoveal versus peripheral nasal scotoma. Invest Ophthalmol Vis Sci. 2016; 57:420–8.
Article18. Park SC, De Moraes CG, Teng CC. . Initial parafoveal versus peripheral scotomas in glaucoma: risk factors and visual field characteristics. Ophthalmology. 2011; 118:1782–9.
Article
- Full Text Links
-
- Actions
-
Cited
- CITED
-
- Close
- Share
-
- Similar articles
-
- Visual Field Change in Normal Tension Glaucoma
- The Influence of Miotics on Visual Field in Glaucoma
- A Clinical Study on Glaucoma
- Early Detection of Glaucoma with Retinal Nerve Fiber Layer Photograph
- Visual Field Progression in Patients with Primary Open Angle Glaucoma, Normal Tension Glaucoma, and Primary Angle Closure Glaucoma
