Limits to Economic Growth: Why Direct Investments Are Needed to Address Child Undernutrition in India
- Affiliations
-
- 1Department of Social and Behavioral Sciences, Harvard T.H.Chan School of Public Health, Boston, MA, and Harvard Center for Population and Development Studies, Cambridge, MA, USA. svsubram@hsph.harvard.edu
- 2Social Epidemiology, Indian Institute of Technology Gandhinagar, VGEC Campus, Chandkheda, Ahmedabad, Gujarat, India.
- KMID: 2351149
- DOI: http://doi.org/10.3346/jkms.2015.30.S2.S131
Abstract
- About two of every five undernourished young children of the world live in India. These high levels of child undernutrition have persisted in India for several years, even in its relatively well-developed states. Moreover, this pattern was observed during a period of rapid economic growth. Evidence from India and other developing countries suggests that economic growth has little to no impact on reducing child undernutrition. We argue that a growth-mediated strategy is unlikely to be effective in tackling child undernutrition unless growth is pro-poor and leads to investment in programs addressing the root causes of this persistent challenge.
MeSH Terms
-
Adolescent
Child
Child Nutrition Disorders/*economics/epidemiology/*prevention & control
Child, Preschool
Cost of Illness
Developing Countries/economics
*Economic Development
Female
Humans
India/epidemiology
Infant
Infant, Newborn
Investments/*economics
Male
Malnutrition/*economics/epidemiology/*prevention & control
Nutritional Status
Prevalence
Figure
-
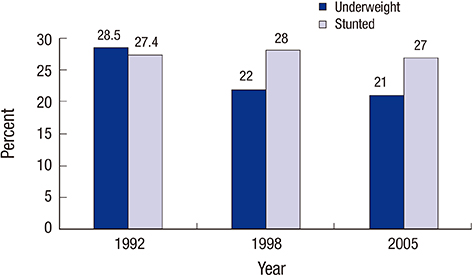
Fig. 1 Prevalence of childhood underweight and stunting in Kerala for 1992-1993 (<48 months), 1998-1999 (<36 months), and 2005-2006 (<36 months) (from NFHS-1, -2, and -3 respectively).

Fig. 2 Association of state-level economic growth (change in per capita net state domestic product) and change in state-level prevalence of childhood (<36 months) underweight in India for children from the poorest and richest quintile of household wealth as well as all children, during the 1992 to 2005 period. Each point in the scatter plot denotes change in prevalence of underweight for a state in India. The data are stratified by household wealth of the population, with red squares representing children from the poorest households (lowest quintile of wealth), blue rhomboids children from the richest households (top wealth quintile) and the green triangles children from all households. The Y axis depicts percentage change in prevalence per year. It was calculated using the formula: [(prevalence weighted for sampling design in 2005-2006 minus weighted prevalence in 1992) divided by weighted prevalence in 1992] multiplied by 100. The X axis depicts percentage change in per capita net state domestic product (PCNSDP), calculated using the formula: [(PCNSDP in 2005 minus PCNSDP in 1993) divided by PCNSDP in 1993] multiplied by 100. Data for underweight are from NFHS-1, -2, and -3 (http://www.rchiips.org/nfhs/index.shtml). Data for PCNSDP are from the 2008 Handbook of statistics on Indian economy published by the Reserve Bank of India (http://www.rbi.org.in/scripts/AnnualPublications.aspx?head=Handbook%20of%20Statistics%20on%20Indian%20Economy). P values for the correlations of percent change in PCNSDP and percent change in weighted prevalence are P=0.6 (poorest), 0.2 (richest), and 0.9 (overall).
Reference
-
1. UNICEF. State of the word's children report. accessed on 15 December 2014. Available at http://www.data.unicef.org/resources/the-state-of-the-world-s-children-report-2015-statistical-tables.2. International Institute for Population Sciences and Macro International. National family health survey, 2005-06: India, nutrition and anemia. Mumbai: 2007. accessed on 15 December 2014. Available at http://www.rchiips.org/nfhs/NFHS-3%20Data/VOL-1/Chapter%2010%20-%20Nutrition%20and%20Anaemia%20(608K).pdf.3. UNICEF. Improving child nutrition: the achievable imperative for global progress. New York: United Nations Children's Fund;2013.4. Subramanyam MA, Kawachi I, Berkman LF, Subramanian SV. Socioeconomic inequalities in childhood undernutrition in India: analyzing trends between 1992 and 2005. PLoS One. 2010; 5:e11392.5. Dreze J SA. Hunger and public action. Oxford: Clarenden Press;1989.6. Thiruvananthapuram. State planning board government of Kerala. accessed on 15 December 2014. Available at http://planningcommission.nic.in/plans/stateplan/sdr_pdf/shdr_kerala05.pdf.7. Organization for Economic Co-operation and Development. StatExtracts: health status. Paris, France: OECD;2014. accessed on 15 December 2014. Available at http://stats.oecd.org/Index.aspx?DataSetCode=HEALTH_STAT).8. Basu K, Maertens A. The pattern and causes of economic growth in India. Oxf Rev Econ Policy. 2007; 23:143–167.9. Pritchett L, Summers LH. Wealthier is healthier. J Hum Resour. 1996; 31:841–868.10. Smith LC, Haddad L. How potent is economic growth in reducing undernutrition? What are the pathways of impact? New cross-country evidence. Econ Dev Cult Change. 2002; 51:55–76.11. Subramanyam MA, Kawachi I, Berkman LF, Subramanian SV. Is economic growth associated with reduction in child undernutrition in India? PLoS Med. 2011; 8:e1000424.12. Subramanian SV, Subramanyam MA. Economic growth & health of poor children in India. Indian J Med Res. 2011; 133:685–686.13. Vollmer S, Harttgen K, Subramanyam MA, Finlay J, Klasen S, Subramanian SV. Association between economic growth and early childhood undernutrition: evidence from 121 Demographic and Health Surveys from 36 low-income and middle-income countries. Lancet Glob Health. 2014; 2:e225–e234.14. Vollmer S, Harttgen K, Subramanyam MA, Finlay J, Klasen S, Subramanian SV. Association between economic growth and early childhood nutrition--authors' reply. Lancet Glob Health. 2015; 3:e81.15. Dev SM, Ravi C. Poverty and Inequality: All-India and States, 1983-2005. Econ Polit Wkly. 2007; 42:509–521.16. Sen A. The rich get hungrier. The New York Times. 2008. 28.17. Deaton A, Drèze J. Food and nutrition in India: facts and interpretations. Econ Polit Wkly. 2009; 42–65.18. Johri M, Chandra D, Subramanian SV, Sylvestre MP, Pahwa S. MDG 7c for safe drinking water in India: an illusive achievement. Lancet. 2014; 383:1379.19. Subramanian SV, Ackerson LK, Davey Smith G, John NA. Association of maternal height with child mortality, anthropometric failure, and anemia in India. JAMA. 2009; 301:1691–1701.20. Ozaltin E, Subramanian SV. Why we need to rethink the strategy and time frame for achieving health-related Millennium Development Goals. Int Health. 2011; 3:246–250.21. Ozaltin E, Hill K, Subramanian SV. Association of maternal stature with offspring mortality, underweight, and stunting in low- to middle-income countries. JAMA. 2010; 303:1507–1516.22. Subramanian SV, Ozaltin E. Progress towards Millennium Development Goal 4. Lancet. 2012; 379:1193–1194.
- Full Text Links
-
- Actions
-
Cited
- CITED
-
- Close
- Share
-
- Similar articles
-
- The Pattern of Malnutrition in Cerebral Palsy and Relating Factors
- BPTF-Associated Neurodevelopmental Disorder Masquerading as Leukodystrophy
- The Nutritional Status and the Clinical Outcomes of Patients With a Spinal Cord Injury Using Nutritional Screening Tools
- The Potential of ChatGPT to Transform Healthcare and Address Ethical Challenges in Artificial Intelligence-Driven Medicine
- Re: Comments on “The Potential of ChatGPT to Transform Healthcare and Address Ethical Challenges in Artificial Intelligence-Driven Medicine”: Author Response
