The Effect of Pattern Scan Laser Photocoagulation on Peripapillary Retinal Nerve Fiber Layer Thickness and Optic Nerve Morphology in Diabetic Retinopathy
- Affiliations
-
- 1Department of Ophthalmology, Hanyang University Guri Hospital, Hanyang University College of Medicine, Guri, Korea. goddns76@hanyang.ac.kr
- 2Department of Ophthalmology, Samsung Medical Center, Sungkyunkwan University School of Medicine, Seoul, Korea.
- KMID: 2344265
- DOI: http://doi.org/10.3341/kjo.2014.28.5.408
Abstract
- PURPOSE
To evaluate the effect of pattern scan laser (PASCAL) photocoagulation on peripapillary retinal nerve fiber layer (RNFL) thickness, central macular thickness (CMT), and optic nerve morphology in patients with diabetic retinopathy.
METHODS
Subjects included 35 eyes for the PASCAL group and 49 eyes for a control group. Peripapillary RNFL thickness, cup-disc area ratio and CMT were measured before PASCAL photocoagulation and at 2 and 6 months after PASCAL photocoagulation in the PASCAL or control groups.
RESULTS
The average RNFL thickness had increased by 0.84 microm two months after and decreased by 0.4 microm six months after PASCAL photocoagulation compared to baseline, but these changes were not significant (p = 0.83, 0.39). The cup-disc area ratio was unchanged after PASCAL photocoagulation. CMT increased by 18.11 microm (p = 0.048) at two months compared to baseline thickness, and partially recovered to 11.82 microm (p = 0.11) at six months in the PASCAL group.
CONCLUSIONS
PASCAL photocoagulation may not cause significant change in the peripapillary RNFL thickness, CMT, and optic nerve morphology in patients with diabetic retinopathy.
Keyword
MeSH Terms
-
Adult
Aged
Aged, 80 and over
Diabetic Retinopathy/physiopathology/*surgery
Female
Fluorescein Angiography
Follow-Up Studies
Humans
Laser Coagulation/*methods
Lasers, Solid-State/*therapeutic use
Macula Lutea/*pathology
Male
Middle Aged
Nerve Fibers/*pathology
Optic Nerve/*pathology
Prospective Studies
Retinal Ganglion Cells/*pathology
Tomography, Optical Coherence
Visual Acuity/physiology
Figure
-
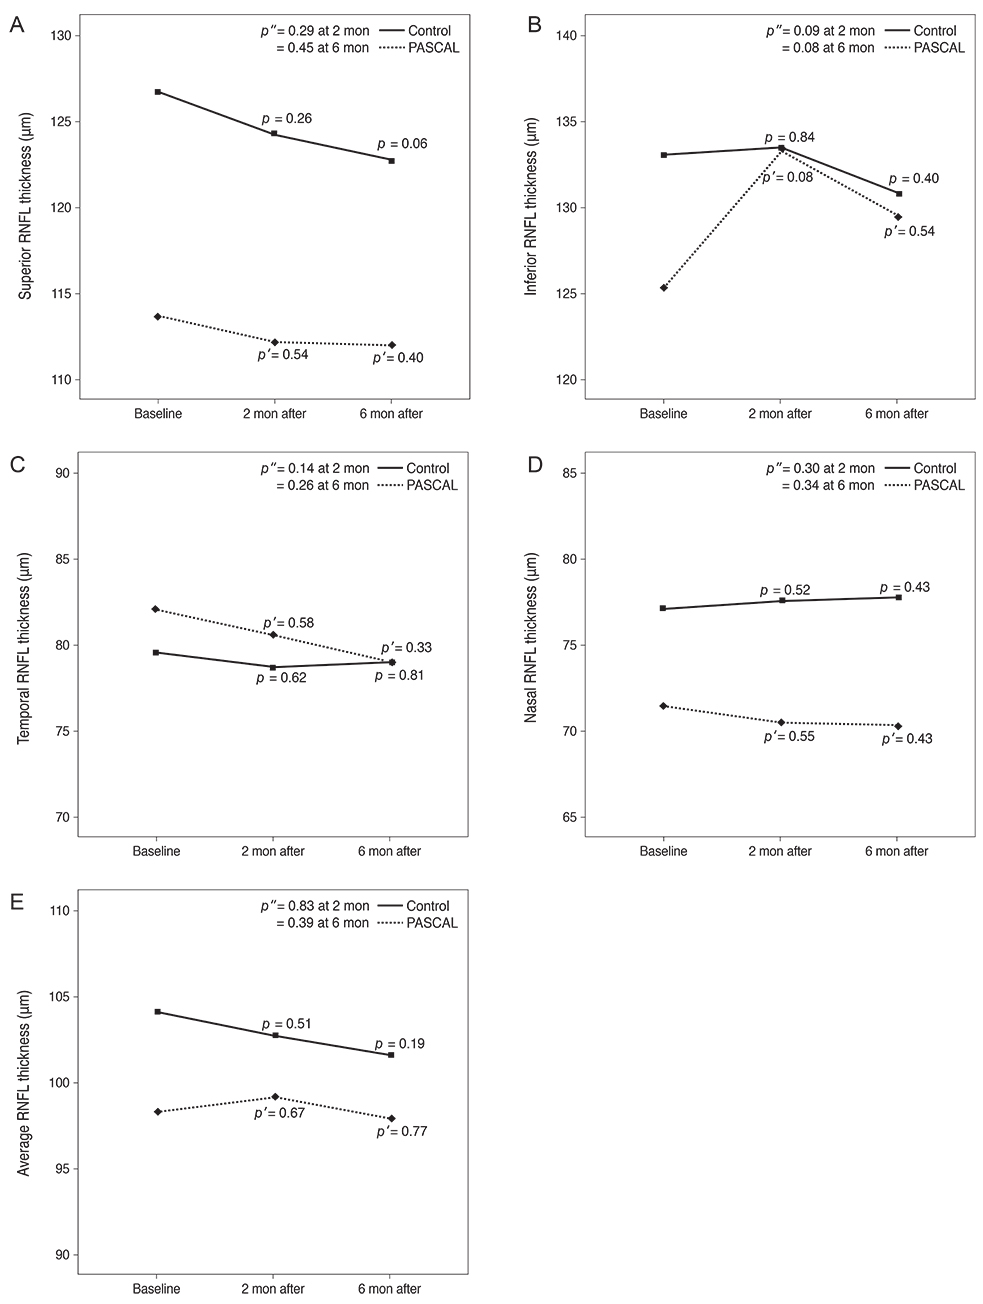
Fig. 1 Interval changes in (A) superior retinal nerve fiber layer (RNFL) thickness, (B) inferior RNFL thickness, (C) temporal RNFL thickness, (D) nasal RNFL thickness, and (E) average RNFL thickness at baseline, two and six months later in the pattern scan laser (PASCAL) and control groups. In both groups, all quadrants and average RNFL thickness did not show any significant changes until six months after measurements of baseline and PASCAL (paired t-test, P > 0.05 and p' > 0.05), and there was no significant difference in interval changes of RNFL thickness between the two groups at any follow up interval (p'' > 0.05). p-value: difference between measurements of baseline and after follow up in control group, paired t-test. p'-value: difference between measurements of baseline and after PASCAL, paired t-test. p''-value: difference of interval changes of measurements between PASCAL group and control group at 2 months or 6 months after, repeated-measure ANOVA.
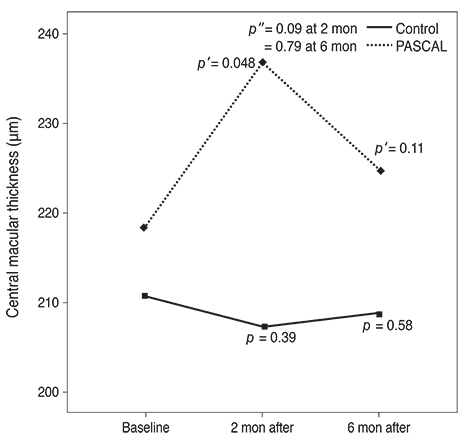
Fig. 2 Interval changes in central macular thickness at baseline, two and six months later in the pattern scan laser (PASCAL) and control groups. p-value: difference between measurements of baseline and after follow up in control group, paired t-test. p'-value: difference between measurements of baseline and after PASCAL, paired t-test. p''-value: difference of interval changes of measurements between PASCAL group and control group at 2 months or 6 months after, repeated-measure ANOVA.

Fig. 3 Interval changes in the cup-disc area ratio at baseline, two and six months later in the pattern scan laser (PASCAL) and control groups. p-value: difference between measurements of baseline and after follow up in control group, paired t-test. p'-value: difference between measurements of baseline and after PASCAL, paired t-test. p''-value: difference of interval changes of measurements between PASCAL group and control group at 2 months or 6 months after, repeated-measure ANOVA.
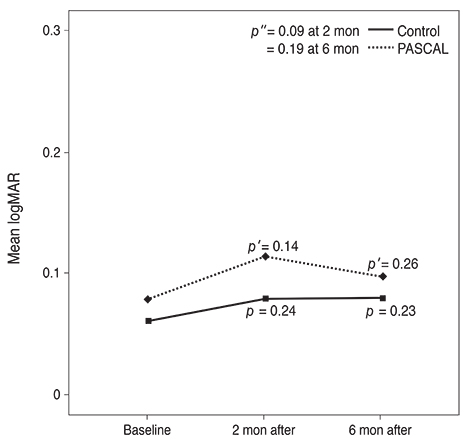
Fig. 4 Interval changes in the visual acuity at baseline, two and six months later in the pattern scan laser (PASCAL) and control groups. logMAR = logarithm of the minimum angle of resolution. p-value: difference between measurements of baseline and after follow up in control group, paired t-test. p'-value: difference between measurements of baseline and after PASCAL, paired t-test. p''-value: difference of interval changes of measurements between PASCAL group and control group at 2 months or 6 months after, repeated-measure ANOVA.
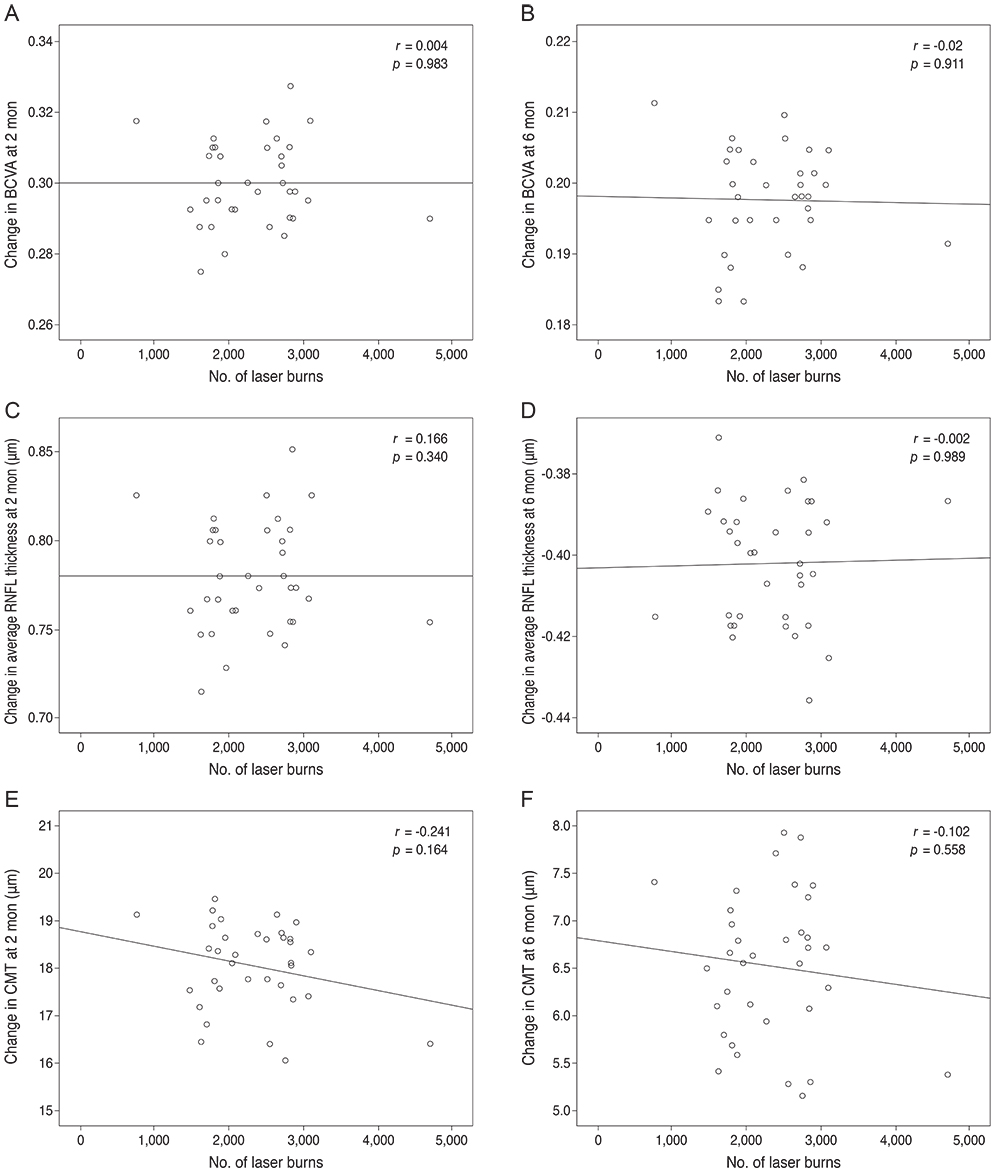
Fig. 5 Correlations between number of laser burns and changes in best-corrected visual acuity (BCVA) (A,B), average retinal nerve fiber layer (RNFL) thickness (C,D), or central macular thickness (CMT) (E,F) at two months (A,C,E) and six months (B,D,F) after pattern scan laser (PASCAL). There were no significant correlations between the mean number of laser burns and changes in BCVA (A,B), average RNFL thickness (C,D) or CMT (E,F) after PASCAL. Simple correlations were assessed by Pearson's correlation coefficients. The r and p-values for correlations are indicated.
Reference
-
1. Early Treatment Diabetic Retinopathy Study Research Group. Early photocoagulation for diabetic retinopathy. ETDRS report number 9. Ophthalmology. 1991; 98:5 Suppl. 766–785.2. Jennings PE, MacEwen CJ, Fallon TJ, et al. Oxidative effects of laser photocoagulation. Free Radic Biol Med. 1991; 11:327–330.3. Stefansson E. Oxygen and diabetic eye disease. Graefes Arch Clin Exp Ophthalmol. 1990; 228:120–123.4. Mainster MA, Reichel E. Transpupillary thermotherapy for age-related macular degeneration: principles and techniques. Semin Ophthalmol. 2001; 16:55–59.5. Hudson C, Flanagan JG, Turner GS, et al. Influence of laser photocoagulation for clinically significant diabetic macular oedema (DMO) on short-wavelength and conventional automated perimetry. Diabetologia. 1998; 41:1283–1292.6. Nagpal M, Marlecha S, Nagpal K. Comparison of laser photocoagulation for diabetic retinopathy using 532-nm standard laser versus multispot pattern scan laser. Retina. 2010; 30:452–458.7. Maeshima K, Utsugi-Sutoh N, Otani T, Kishi S. Progressive enlargement of scattered photocoagulation scars in diabetic retinopathy. Retina. 2004; 24:507–511.8. Marshall J, Hamilton AM, Bird AC. Histopathology of ruby and argon laser lesions in monkey and human retina: a comparative study. Br J Ophthalmol. 1975; 59:610–630.9. Palanker D, Lavinsky D, Blumenkranz MS, Marcellino G. The impact of pulse duration and burn grade on size of retinal photocoagulation lesion: implications for pattern density. Retina. 2011; 31:1664–1669.10. Johns KJ, Leonard-Martin T, Feman SS. The effect of panretinal photocoagulation on optic nerve cupping. Ophthalmology. 1989; 96:211–216.11. Blumenkranz MS, Yellachich D, Andersen DE, et al. Semiautomated patterned scanning laser for retinal photocoagulation. Retina. 2006; 26:370–376.12. Muqit MM, Gray JC, Marcellino GR, et al. In vivo laser-tissue interactions and healing responses from 20- vs 100-millisecond pulse Pascal photocoagulation burns. Arch Ophthalmol. 2010; 128:448–455.13. Jain A, Blumenkranz MS, Paulus Y, et al. Effect of pulse duration on size and character of the lesion in retinal photocoagulation. Arch Ophthalmol. 2008; 126:78–85.14. Cheung CY, Leung CK, Lin D, et al. Relationship between retinal nerve fiber layer measurement and signal strength in optical coherence tomography. Ophthalmology. 2008; 115:1347–1351.15. Kim HY, Cho HK. Peripapillary retinal nerve fiber layer thickness change after panretinal photocoagulation in patients with diabetic retinopathy. Korean J Ophthalmol. 2009; 23:23–26.16. Blankenship GW. Red krypton and blue-green argon panretinal laser photocoagulation for proliferative diabetic retinopathy: a laboratory and clinical comparison. Trans Am Ophthalmol Soc. 1986; 84:967–1003.17. Muqit MM, Wakely L, Stanga PE, et al. Effects of conventional argon panretinal laser photocoagulation on retinal nerve fibre layer and driving visual fields in diabetic retinopathy. Eye (Lond). 2010; 24:1136–1142.18. Muqit MM, Gray JC, Marcellino GR, et al. Fundus autofluorescence and Fourier-domain optical coherence tomography imaging of 10 and 20 millisecond Pascal retinal photocoagulation treatment. Br J Ophthalmol. 2009; 93:518–525.19. Shimura M, Yasuda K, Nakazawa T, et al. Quantifying alterations of macular thickness before and after panretinal photocoagulation in patients with severe diabetic retinopathy and good vision. Ophthalmology. 2003; 110:2386–2394.
- Full Text Links
-
- Actions
-
Cited
- CITED
-
- Close
- Share
-
- Similar articles
-
- Changes in Macular Retinal Layers and Peripapillary Nerve Fiber Layer Thickness after 577-nm Pattern Scanning Laser in Patients with Diabetic Retinopathy
- Changes in Peripapillary Retinal Nerve Fiber Layer Thickness after Pattern Scanning Laser Photocoagulation in Patients with Diabetic Retinopathy
- Peripapillary Retinal Nerve Fiber Layer Thickness Change After Panretinal Photocoagulation in Patients With Diabetic Retinopathy
- Reproducibility of Retinal Nerve Fiber Layer Thickness Evaluation by Nerve Fiber Analyzer
- Biometry of Retinal Nerve Fiber Layer Thickness by NFA
