Assessment of Macular Ganglion Cell Loss Patterns in Neurologic Lesions That Mimic Glaucoma
- Affiliations
-
- 1Department of Ophthalmology, Asan Medical Center, University of Ulsan College of Medicine, Seoul, Korea. sungeye@gmail.com
Abstract
- PURPOSE
To evaluate patterns of macular retinal ganglion cell (RGC) loss measured by spectral domain optical coherence tomography in patients with neurologic lesions mimicking glaucoma.
METHODS
We evaluated four patients with neurological lesions who showed characteristic patterns of RGC loss, as determined by ganglion cell thickness (GCT) mapping.
RESULTS
Case 1 was a 30-year-old man who had been treated with glaucoma medication. A left homonymous vertical pattern of RGC loss was observed in his GCT map and a past brain magnetic resonance imaging (MRI) revealed a hemorrhagic lesion around the right optic radiation. Case 2 was a 72-year-old man with a pituitary adenoma who had a binasal vertical pattern of RGC loss that corresponded with bitemporal hemianopsia. Case 3 was a 77-year-old man treated for suspected glaucoma. His GCT map showed a right inferior quadratic pattern of loss, indicating a right superior homonymous quadranopsia in his visual field (VF). His brain MRI revealed a left posterior cerebral artery territory infarct. Case 4 was a 38-year-old woman with an unreliable VF who was referred for suspected glaucoma. Her GCT map revealed a left homonymous vertical pattern of RGC loss, which may have been related to a previous head trauma.
CONCLUSIONS
Evaluation of the patterns of macular RGC loss may be helpful in the differential diagnosis of RGC-related diseases, including glaucoma and neurologic lesions. When a patient's VF is unavailable, this method may be an effective tool for diagnosing and monitoring transneuronal retrograde degeneration-related structural changes.
MeSH Terms
-
Adult
Aged
Brain Injuries/diagnosis
Cerebral Infarction/diagnosis
Diagnosis, Differential
Female
Glaucoma/*diagnosis
Hemianopsia/diagnosis
Humans
Magnetic Resonance Imaging
Male
Nerve Fibers/*pathology
Nervous System Diseases/*diagnosis
Pituitary Neoplasms/diagnosis
Retinal Ganglion Cells/*pathology
Retrospective Studies
Tomography, Optical Coherence
Tonometry, Ocular
Visual Acuity
Visual Field Tests
Visual Fields
Figure
-
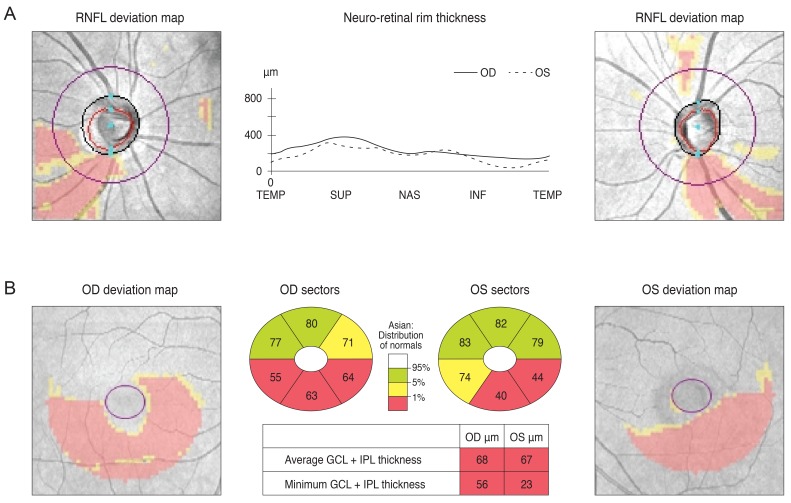
Fig. 1 Peripapillary retinal nerve fiber layer (RNFL) thickness (A) and ganglion cell thickness (GCT) (B) deviation maps with reference to a normative database were provided by spectral domain optical coherence tomography. GCT was defined as the layer from the outer boundary of the RNFL to the outer boundary of the inner plexiform layer. Each pixel in the deviation was coded in yellow or red for either the GCT or RNFL thickness deviation map if the measurement was below the lower 95% ("borderline") or above the 99% ("outside normal limits") centile range for that particular pixel. The GCT map shown here (B) has the typical arcuate shape defect observed in glaucoma. OD = right eye; OS = left eye; TEMP = temporal; SUP = superior; NAS = nasal; INF = inferior; GCL = ganglion cell layer; IPL = inner plexiform layer.
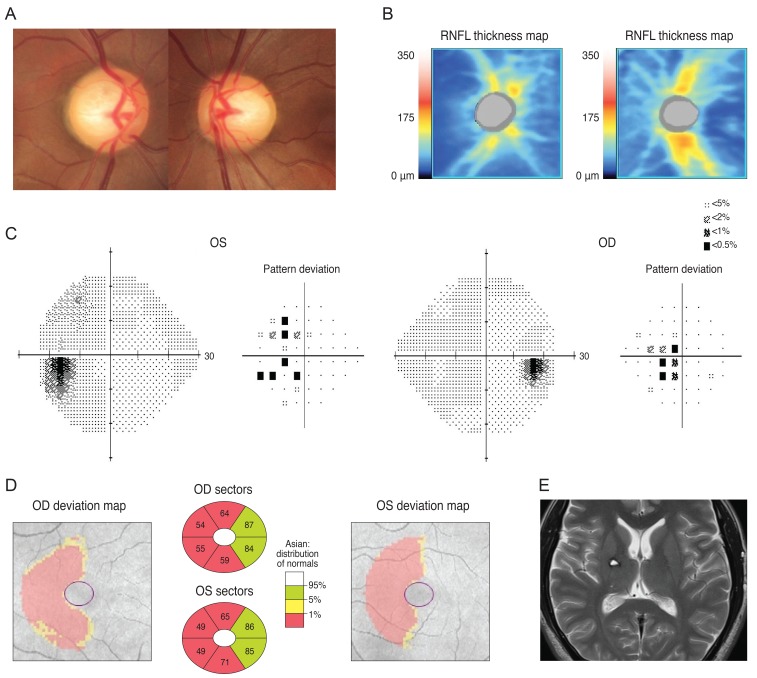
Fig. 2 The optic disc of a 30-year-old male showed increased cupping (A) and a spectral domain optical coherence tomography peripapillary retinal nerve fiber layer (RNFL) thickness map revealed thinning in both eyes (B). Analysis of the patient's visual field revealed a mild left homonymous hemianopsia (C). His macular Ganglion cell thickness map showed left homonymous vertical pattern of loss (D). His brain magnetic resonance imaging showed a hemorrhagic lesion around the right optic radiation (E). OD = right eye; OS = left eye.
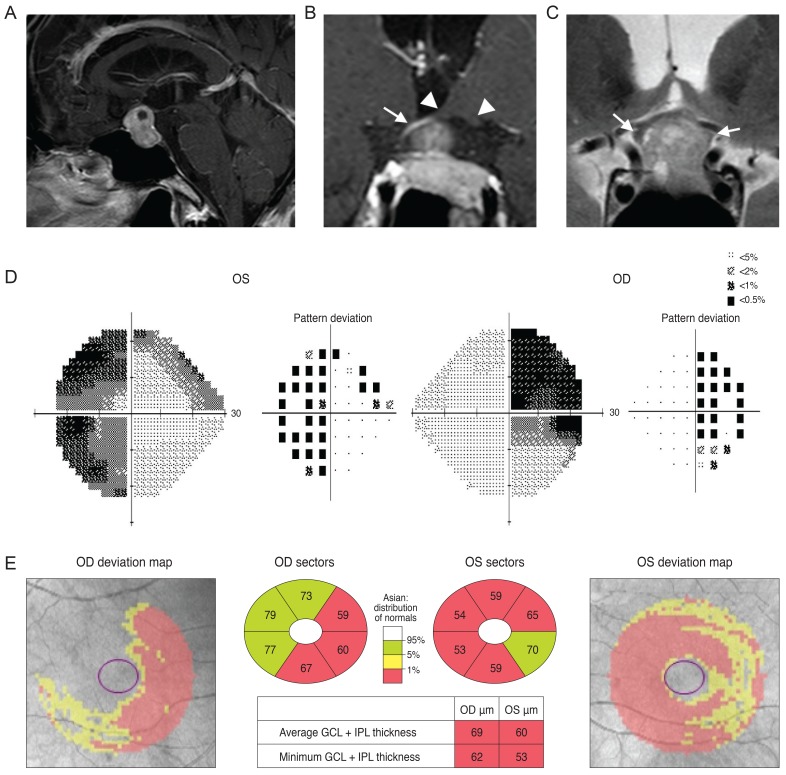
Fig. 3 A brain magnetic resonance imaging of a 72-year-old man revealed a pituitary adenoma (A) displacing the pituitary stalk (arrow) and parenchyma to right side, and compression of the optic chiasm (arrowheads) on a T1-weighted gadolinium-enhanced image of the coronal section. (B) His left optic nerve looked more compressed than the right (arrows) on a T2-weighted coronal image (C). Analysis of his visual field revealed bitemporal hemianopsia (D) and a Ganglion cell thickness map showed a binasal vertical pattern of loss in the right eye, whereas the left eye showed a more generalized pattern of retinal ganglion cell loss, which was more severe at the nasal half and had a relatively preserved inferotemporal sector (E). OD = right eye; OS = left eye; GCL = ganglion cell layer; IPL = inner plexiform layer.
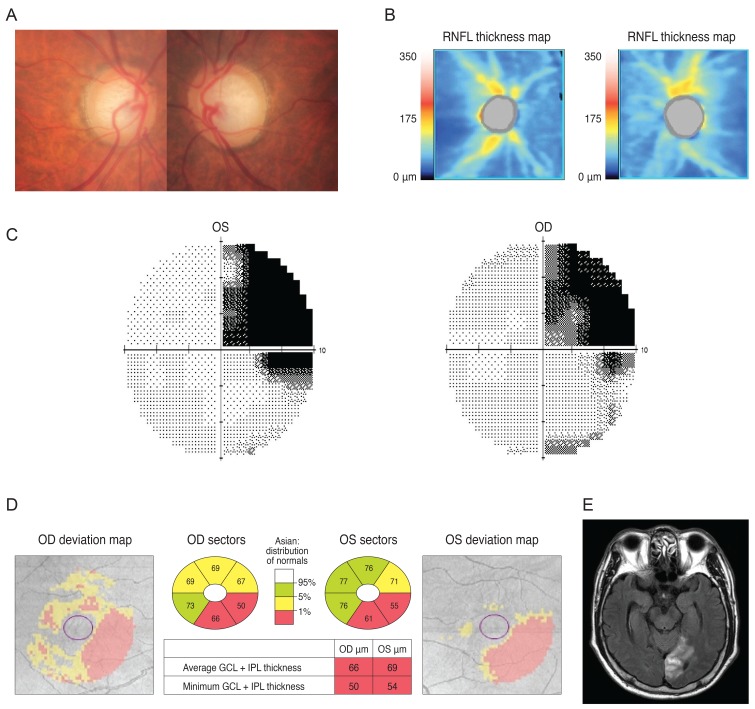
Fig. 4 Analysis of a 77-year-old man showed increased cupping in his optic disc (A) and optical coherence tomography peripapillary retinal nerve fiber layer (RNFL) thickness map is shown in (B). His Ganglion cell thickness map showed a right inferior quadratic pattern of loss (C) and analysis of his visual field showed a right superior homonymous quadranopsia (D). A brain magnetic resonance imaging revealed a left posterior cerebral artery territory infarct (E). OD = right eye; OS = left eye; GCL = ganglion cell layer; IPL = inner plexiform layer.

Fig. 5 Analysis of a 38-year-old woman showed mild cupping in her optic disc (A) and optical coherence tomography showed reduced retinal nerve fiber layer (RNFL) thickness (B). Her visual field result was unreliable (C) but a Ganglion cell thickness map revealed a left homonymous vertical pattern of loss (D). OD = right eye; OS = left eye; GCL = ganglion cell layer; IPL = inner plexiform layer.
Reference
-
1. Jindahra P, Petrie A, Plant GT. Retrograde trans-synaptic retinal ganglion cell loss identified by optical coherence tomography. Brain. 2009; 132(Pt 3):628–634. PMID: 19224900.
Article2. Mehta JS, Plant GT. Optical coherence tomography (OCT) findings in congenital/long-standing homonymous hemianopia. Am J Ophthalmol. 2005; 140:727–729. PMID: 16226527.
Article3. Park HY, Park YG, Cho AH, Park CK. Transneuronal retrograde degeneration of the retinal ganglion cells in patients with cerebral infarction. Ophthalmology. 2013; 120:1292–1299. PMID: 23395544.
Article4. Fernandes DB, Raza AS, Nogueira RG, et al. Evaluation of inner retinal layers in patients with multiple sclerosis or neuromyelitis optica using optical coherence tomography. Ophthalmology. 2013; 120:387–394. PMID: 23084127.
Article5. Sarac O, Tasci YY, Gurdal C, Can I. Differentiation of optic disc edema from optic nerve head drusen with spectral-domain optical coherence tomography. J Neuroophthalmol. 2012; 32:207–211. PMID: 22473041.
Article6. Sung KR, Sun JH, Na JH, et al. Progression detection capability of macular thickness in advanced glaucomatous eyes. Ophthalmology. 2012; 119:308–313. PMID: 22182800.
Article7. Hein K, Gadjanski I, Kretzschmar B, et al. An optical coherence tomography study on degeneration of retinal nerve fiber layer in rats with autoimmune optic neuritis. Invest Ophthalmol Vis Sci. 2012; 53:157–163. PMID: 22131393.
Article8. Na JH, Sung KR, Lee JR, et al. Detection of glaucomatous progression by spectral-domain optical coherence tomography. Ophthalmology. 2013; 120:1388–1395. PMID: 23474248.
Article9. Mwanza JC, Oakley JD, Budenz DL, et al. Macular ganglion cell-inner plexiform layer: automated detection and thickness reproducibility with spectral domain-optical coherence tomography in glaucoma. Invest Ophthalmol Vis Sci. 2011; 52:8323–8329. PMID: 21917932.
Article10. Cho JW, Sung KR, Lee S, et al. Relationship between visual field sensitivity and macular ganglion cell complex thickness as measured by spectral-domain optical coherence tomography. Invest Ophthalmol Vis Sci. 2010; 51:6401–6407. PMID: 20631238.
Article11. Seong M, Sung KR, Choi EH, et al. Macular and peripapillary retinal nerve fiber layer measurements by spectral domain optical coherence tomography in normal-tension glaucoma. Invest Ophthalmol Vis Sci. 2010; 51:1446–1452. PMID: 19834029.
Article12. Na JH, Sung KR, Baek S, et al. Detection of glaucoma progression by assessment of segmented macular thickness data obtained using spectral domain optical coherence tomography. Invest Ophthalmol Vis Sci. 2012; 53:3817–3826. PMID: 22562510.
Article13. Zeimer R, Asrani S, Zou S, et al. Quantitative detection of glaucomatous damage at the posterior pole by retinal thickness mapping: a pilot study. Ophthalmology. 1998; 105:224–231. PMID: 9479279.14. Ishikawa H, Stein DM, Wollstein G, et al. Macular segmentation with optical coherence tomography. Invest Ophthalmol Vis Sci. 2005; 46:2012–2017. PMID: 15914617.
Article15. Um TW, Sung KR, Wollstein G, et al. Asymmetry in hemifield macular thickness as an early indicator of glaucomatous change. Invest Ophthalmol Vis Sci. 2012; 53:1139–1144. PMID: 22247461.
Article16. Sung KR, Wollstein G, Kim NR, et al. Macular assessment using optical coherence tomography for glaucoma diagnosis. Br J Ophthalmol. 2012; 96:1452–1455. PMID: 23018425.
- Full Text Links
-
- Actions
-
Cited
- CITED
-
- Close
- Share
-
- Similar articles
-
- Hierarchical Cluster Analysis of Peripapillary Retinal Nerve Fiber Layer Damage and Macular Ganglion Cell Loss in Open Angle Glaucoma
- Diagnostic Ability of Macular Ganglion Cell Layer Measurements in Glaucoma Using Swept Source Optical Coherence Tomography
- Effect of ERM on RNFL, GCIPL and Macular Thickness According to the Severity of Glaucoma
- Visual Field Changes after Internal Limiting Membrane Peeling in Glaucoma Patients with Epiretinal Membrane
- Expression of Nitric Oxide Synthase Isoforms in a Rat Model of Chronic Glaucoma
