Survey of American food trends and the growing obesity epidemic
- Affiliations
-
- 1Department of Mathematics, College of Arts and Sciences, University of Toledo, Toledo, Ohio 43606, USA.
- 2Department of Medicine, University of Toledo College of Medicine, 3000 Arlington Avenue, BHS 377, Toledo, Ohio 43614, USA. khew-voon.chin@utoledo.edu
Abstract
- The rapid rise in the incidence of obesity has emerged as one of the most pressing global public health issues in recent years. The underlying etiological causes of obesity, whether behavioral, environmental, genetic, or a combination of several of them, have not been completely elucidated. The obesity epidemic has been attributed to the ready availability, abundance, and overconsumption of high-energy content food. We determined here by Pearson's correlation the relationship between food type consumption and rising obesity using the loss-adjusted food availability data from the United States Department of Agriculture (USDA) Economic Research Services (ERS) as well as the obesity prevalence data from the Behavioral Risk Factor Surveillance System (BRFSS) and the National Health and Nutrition Examination Survey (NHANES) at the Centers for Disease Control and Prevention (CDC). Our analysis showed that total calorie intake and consumption of high fructose corn syrup (HFCS) did not correlate with rising obesity trends. Intake of other major food types, including chicken, dairy fats, salad and cooking oils, and cheese also did not correlate with obesity trends. However, our results surprisingly revealed that consumption of corn products correlated with rising obesity and was independent of gender and race/ethnicity among population dynamics in the U.S. Therefore, we were able to demonstrate a novel link between the consumption of corn products and rising obesity trends that has not been previously attributed to the obesity epidemic. This correlation coincides with the introduction of bioengineered corns into the human food chain, thus raising a new hypothesis that should be tested in molecular and animal models of obesity.
Keyword
MeSH Terms
-
Aluminum Hydroxide
Behavioral Risk Factor Surveillance System
Callosities
Carbonates
Centers for Disease Control and Prevention (U.S.)
Cheese
Chickens
Cooking
Fats
Food Chain
Fructose
Humans
Incidence
Models, Animal
Nutrition Surveys
Obesity
Oils
Population Dynamics
Prevalence
Public Health
United States Department of Agriculture
Zea mays
Aluminum Hydroxide
Carbonates
Fats
Fructose
Oils
Figure
-
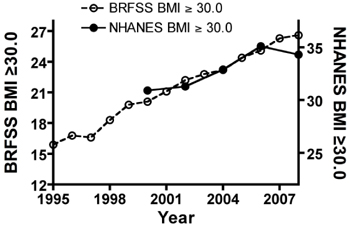
Fig. 1 Comparison of rising obesity trends of NHANES and BRFSS datasets. Alignment of the NHANES and BRFSS obesity trend datasets was performed to find the optimal correspondence. The left ordinate indicates the obesity prevalence by median %; and the right ordinate shows the average daily per capita calories consumed for each food type. The rising obesity trends are similar between the NHANES and BRFSS datasets. Open circles (○) are BRFSS; and closed circles (●) are NHANES obesity trends data with BMI ≥ 30 from their respective datasets.
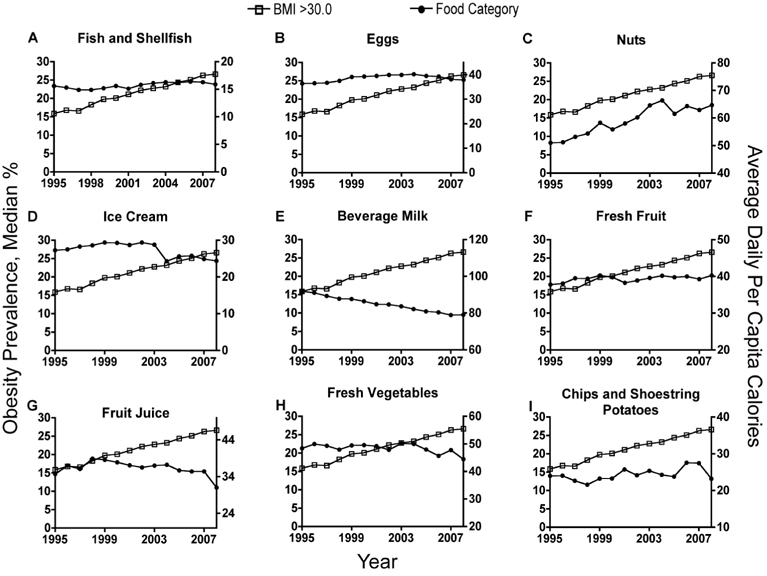
Fig. 2 Food types showing no correlation with rising obesity trends. The left ordinate indicates the obesity prevalence by median %; and the right ordinate shows the average daily per capita calories consumed for each indicated food type. Rising obesity did not overlap with the trends in consumption of the indicated food types. Open squares (□), obesity trends data with BMI > 30; and closed circles (●), food type.

Fig. 3 Regression analysis of the relationship between food type consumption and obesity trends by Pearson's correlation. Regression analysis by Pearson's correlation was performed to determine the relationship between obesity trends and the average daily per capita calories consumed for various food types. The left ordinate indicates the obesity prevalence by median %; and the right ordinate shows the average daily per capita calories consumed for each food type. Open squares (□), obesity trends data with BMI > 30; and closed circles (●), food type.
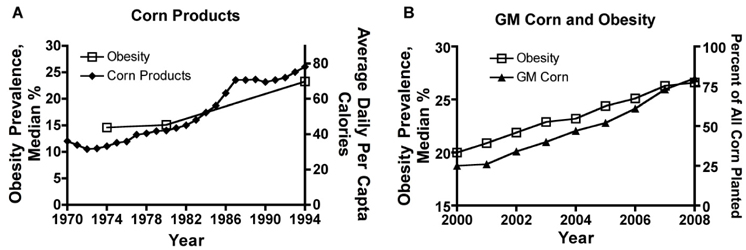
Fig. 4 Trends in corn consumption and rising obesity. (A) Relationship of corn product consumption and obesity prevalence between 1970 and 1994. Obesity prevalence from NHANES I (1971-1975), II (1976-1980), and III (1988-1994) were plotted against corn product consumption, revealing the lack of overlap in the trends of these data. Open squares (□), obesity trends data with BMI > 30; and closed circles (♦), corn products. (B) Relationship between rising obesity and rate of GM corn adoption in U.S. between 2000 and 2008. Rate of adoption of GM corn by farmers represented as the acreage of farms planted with GM corn as a percent of total acreage of corn planted in the U.S. was plotted against rising obesity trends. Open squares (□), obesity trends data with BMI > 30; and closed circles (▴), GM corn.
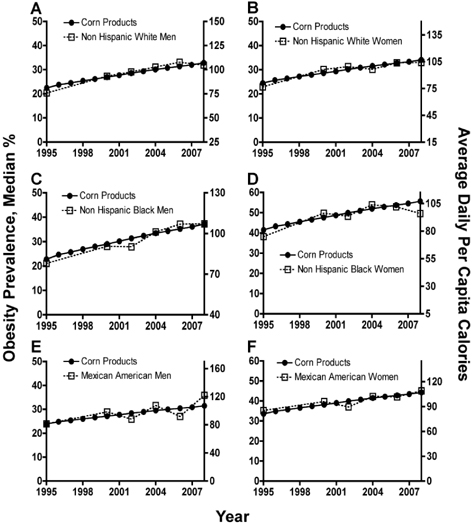
Fig. 5 Correlation of corn products intake with NHANES obesity prevalence data stratified by race/ethnicity and gender. Obesity prevalence data stratified by race/ethnicity and gender from NHANES III (1988-1994), NHANES (1999-2000), (2001-2002), (2003-2004), (2005-2006), and (2007-2008) were plotted against corn product consumption between 1995 and 2008. Open squares (□), obesity trends data with BMI ≥ 30; and closed circles (●), average daily per capita corn products intake in calories. Alignment was performed for the relationship of rising obesity with corn product consumption between 1995 and 2008 for non-Hispanic white men (A) and women (B); non-Hispanic black men (C) and women (D); and Mexican-American men (E) and women (F).
Reference
-
1. Kelly T, Yang W, Chen CS, Reynolds K, He J. Global burden of obesity in 2005 and projections to 2030. Int J Obes (Lond). 2008. 32:1431–1437.
Article2. Popkin BM. Recent dynamics suggest selected countries catching up to US obesity. Am J Clin Nutr. 2010. 91:284S–288S.
Article3. Flegal KM, Carroll MD, Ogden CL, Curtin LR. Prevalence and trends in obesity among US adults, 1999-2008. JAMA. 2010. 303:235–241.
Article4. Pomp D, Mohlke KL. Obesity genes: so close and yet so far... J Biol. 2008. 7:36.
Article5. Atkinson RL. Viruses as an etiology of obesity. Mayo Clin Proc. 2007. 82:1192–1198.
Article6. Tsai F, Coyle WJ. The microbiome and obesity: is obesity linked to our gut flora? Curr Gastroenterol Rep. 2009. 11:307–313.
Article7. Vijay-Kumar M, Aitken JD, Carvalho FA, Cullender TC, Mwangi S, Srinivasan S, Sitaraman SV, Knight R, Ley RE, Gewirtz AT. Metabolic syndrome and altered gut microbiota in mice lacking Toll-like receptor 5. Science. 2010. 328:228–231.
Article8. Swinburn BA, Sacks G, Lo SK, Westerterp KR, Rush EC, Rosenbaum M, Luke A, Schoeller DA, DeLany JP, Butte NF, Ravussin E. Estimating the changes in energy flux that characterize the rise in obesity prevalence. Am J Clin Nutr. 2009. 89:1723–1728.
Article9. Foreyt JP, Salas-Salvado J, Caballero B, Bulló M, Gifford KD, Bautista I, Serra-Majem L. Weight-reducing diets: are there any differences? Nutr Rev. 2009. 67:Suppl 1. S99–S101.
Article10. Bray GA, Nielsen SJ, Popkin BM. Consumption of high-fructose corn syrup in beverages may play a role in the epidemic of obesity. Am J Clin Nutr. 2004. 79:537–543.
Article11. Johnson RJ, Segal MS, Sautin Y, Nakagawa T, Feig DI, Kang DH, Gersch MS, Benner S, Sánchez-Lozada LG. Potential role of sugar (fructose) in the epidemic of hypertension, obesity and the metabolic syndrome, diabetes, kidney disease, and cardiovascular disease. Am J Clin Nutr. 2007. 86:899–906.12. Jürgens H, Haass W, Castañeda TR, Schürmann A, Koebnick C, Dombrowski F, Otto B, Nawrocki AR, Scherer PE, Spranger J, Ristow M, Joost HG, Havel PJ, Tschöp MH. Consuming fructose-sweetened beverages increases body adiposity in mice. Obes Res. 2005. 13:1146–1156.
Article13. Teff KL, Elliott SS, Tschöp M, Kieffer TJ, Rader D, Heiman M, Townsend RR, Keim NL, D'Alessio D, Havel PJ. Dietary fructose reduces circulating insulin and leptin, attenuates postprandial suppression of ghrelin, and increases triglycerides in women. J Clin Endocrinol Metab. 2004. 89:2963–2972.
Article14. Melanson KJ, Zukley L, Lowndes J, Nguyen V, Angelopoulos TJ, Rippe JM. Effects of high-fructose corn syrup and sucrose consumption on circulating glucose, insulin, leptin, and ghrelin and on appetite in normal-weight women. Nutrition. 2007. 23:103–112.
Article15. Barnard ND. Trends in food availability, 1909-2007. Am J Clin Nutr. 2010. 91:1530S–1536S.
Article16. Food Availability (Per Capita) Data System. United States Department of Agriculture, Economic Research Service [Internet]. cited 2010 September 29. Available from: http://www.ers.usda.gov/Data/FoodConsumption/.17. Prevalence and Trends Data. Centers for Disease Control and Prevention, Office of Surveillance, Epidemiology, and Laboratory Services, Behavioral Risk Factor Surveillance System [Internet]. cited 2010 September 29. Available from: http://apps.nccd.cdc.gov/brfss/.18. National Health and Nutrition Examination Survey. Centers for Disease Control and Prevention, National Center for Health Statistics [Internet]. cited 2010 September 29. Available from: http://www.cdc.gov/nchs/.19. Adoption of Genetically Engineered Crops in the U.S. United States Department of Agriculture, Economic Research Service [Internet]. cited 2010 September 29. Available from: http://www.ers.usda.gov/data/biotechcrops/.20. Mokdad AH, Serdula MK, Dietz WH, Bowman BA, Marks JS, Koplan JP. The spread of the obesity epidemic in the United States, 1991-1998. JAMA. 1999. 282:1519–1522.
Article21. Flegal KM, Carroll MD, Ogden CL, Johnson CL. Prevalence and trends in obesity among US adults, 1999-2000. JAMA. 2002. 288:1723–1727.
Article22. Flegal KM, Carroll MD, Kuczmarski RJ, Johnson CL. Overweight and obesity in the United States: prevalence and trends, 1960-1994. Int J Obes Relat Metab Disord. 1998. 22:39–47.
Article23. Estruch JJ, Carozzi NB, Desai N, Duck NB, Warren GW, Koziel MG. Transgenic plants: an emerging approach to pest control. Nat Biotechnol. 1997. 15:137–141.
Article24. Bocarsly ME, Powell ES, Avena NM, Hoebel BG. High-fructose corn syrup causes characteristics of obesity in rats: Increased body weight, body fat and triglyceride levels. Pharmacol Biochem Behav. 2010. 97:101–106.
Article25. Marshall A. 2nd-generation GM traits progress. Nat Biotechnol. 2010. 28(4):306.
Article26. Magaña-Gómez JA, de la Barca AM. Risk assessment of genetically modified crops for nutrition and health. Nutr Rev. 2009. 67:1–16.
Article27. de Vendômois JS, Roullier F, Cellier D, Séralini GE. A comparison of the effects of three GM corn varieties on mammalian health. Int J Biol Sci. 2009. 5:706–726.
Article28. Formanek R Jr. Proposed rules issued for bioengineered foods. FDA Consum. 2001. 35:9–11.
Article29. Falk MC, Chassy BM, Harlander SK, Hoban TJ 4th, McGloughlin MN, Akhlaghi AR. Food biotechnology: benefits and concerns. J Nutr. 2002. 132:1384–1390.
Article30. Pigott CR, Ellar DJ. Role of receptors in Bacillus thuringiensis crystal toxin activity. Microbiol Mol Biol Rev. 2007. 71:255–281.
Article31. Key S, Ma JK, Drake PM. Genetically modified plants and human health. J R Soc Med. 2008. 101:290–298.
Article
- Full Text Links
-
- Actions
-
Cited
- CITED
-
- Close
- Share
-
- Similar articles
-
- Trends in Obesity Prevalence by Occupation Based on Korean National Health and Nutrition Examination Survey From 1998 to 2015
- Socioeconomic Cost of Obesity in Korea
- Comparison of Trends in Blood Pressure and the Prevalence of Obesity Among Korean and American Adolescents: A 12-Years Cross-sectional Study
- Neuroscience of Eating Behavior: Focusing on Intake
- Trends in socioeconomic inequalities in obesity among Korean adolescents: the Korea Youth Risk Behavior Web-based Survey (KYRBS) 2006 to 2020
