J Breast Cancer.
2013 Sep;16(3):342-344. 10.4048/jbc.2013.16.3.342.
Genomic Profiling Shows Increased Glucose Metabolism in Luminal B Breast Cancer
- Affiliations
-
- 1Department of Breast Oncology, International Medical Center, Saitama Medical School, Saitama, Japan. syueda@saitama-med.ac.jp
- KMID: 2286387
- DOI: http://doi.org/10.4048/jbc.2013.16.3.342
Abstract
- We had previously reported a close association between pathological response and the maximum tumor standardized uptake value (SUVmax) measured by 18F-fluorodeoxyglucose positron emission tomography prior to chemotherapy in estrogen receptor (ER)-positive breast cancer. We hypothesized that glucose hypermetabolism by luminal B tumors may result in chemotherapy responsiveness. Using a single-gene expression assay, TargetPrint(R) (Agendia) and a 70-gene expression classifier, MammaPrint(R) (Agendia), we divided 20 patients with ER-positive primary breast cancer into luminal A and luminal B subtypes and compared the tumor SUVmax value between the two groups. A significantly higher SUVmax was measured for luminal B tumors (n=10; mean+/-SD, 7.6+/-5.6) than for luminal A tumors (n=10; mean+/-SD, 2.6+/-1.2; p=0.01). Glucose hypermetabolism could help predict intrinsic subtyping and chemotherapy responsiveness as a supplement to ER, progesterone receptor, HER2, and Ki-67 histochemical scores.
Keyword
MeSH Terms
Figure
-
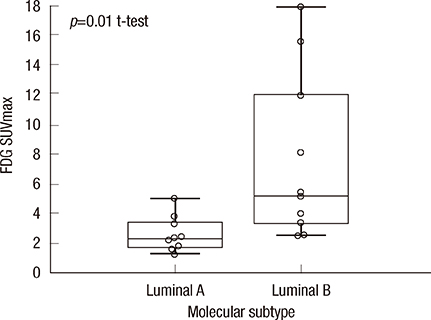
Figure 1 Distribution of the maximum tumor standardized uptake value (SUVmax) of luminal A and luminal B. A significantly higher SUVmax was measured for luminal B tumors (n=10; mean±SD, 7.6±5.6) than for luminal A tumors (n=10; mean±SD, 2.6±1.2; p=0.01). FDG=18F-fluorodeoxyglucose.

Figure 2 Diagnostic performance of predicting luminal B. The area under the curve (AUC) analysis showed that the maximum tumor standardized uptake value (SUVmax) was an acceptable discriminator (AUC=0.878; 95% confidence interval [CI], 0.647-0.981) with results comparable with those of the Ki-67 labeling index (AUC=0.878; 95% CI, 0.647-0.981). FDG=18F-fluorodeoxyglucose.
Reference
-
1. Ueda S, Saeki T, Shigekawa T, Omata J, Moriya T, Yamamoto J, et al. 18F-fluorodeoxyglucose positron emission tomography optimizes neoadjuvant chemotherapy for primary breast cancer to achieve pathological complete response. Int J Clin Oncol. 2012; 17:276–282.
Article2. Sørlie T, Perou CM, Tibshirani R, Aas T, Geisler S, Johnsen H, et al. Gene expression patterns of breast carcinomas distinguish tumor subclasses with clinical implications. Proc Natl Acad Sci U S A. 2001; 98:10869–10874.
Article3. Nguyen B, Cusumano PG, Deck K, Kerlin D, Garcia AA, Barone JL, et al. Comparison of molecular subtyping with BluePrint, MammaPrint, and TargetPrint to local clinical subtyping in breast cancer patients. Ann Surg Oncol. 2012; 19:3257–3263.
Article4. Jin S, Kim SB, Ahn JH, Jung KH, Ahn SH, Son BH, et al. 18 F-fluorodeoxyglucose uptake predicts pathological complete response after neoadjuvant chemotherapy for breast cancer: a retrospective cohort study. J Surg Oncol. 2013; 107:180–187.
Article5. Osborne JR, Port E, Gonen M, Doane A, Yeung H, Gerald W, et al. 18F-FDG PET of locally invasive breast cancer and association of estrogen receptor status with standardized uptake value: microarray and immunohistochemical analysis. J Nucl Med. 2010; 51:543–550.
Article
- Full Text Links
-
- Actions
-
Cited
- CITED
-
- Close
- Share
-
- Similar articles
-
- Genomic Profiling of Prostate Cancer: An Updated Review
- The Expression of ERCC1, RRM1, and BRCA1 in Breast Cancer According to the Immunohistochemical Phenotypes
- Molecular subtypes and imaging phenotypes of breast cancer
- Analysis of the Potent Prognostic Factors in Luminal-Type Breast Cancer
- Potential Benefits of Neoadjuvant Chemotherapy in Clinically Node-Positive Luminal Subtypeâ» Breast Cancer
