The Optical Coherence Tomography Findings of Optic Tract Syndrome
- Affiliations
-
- 1Department of Ophthalmology, Chungnam National University College of Medicine, Daejeon, Korea. opticalyh@hanmail.net
- KMID: 2217431
- DOI: http://doi.org/10.3341/jkos.2013.54.7.1144
Abstract
- PURPOSE
To report a case of optic tract syndrome in which optical coherence tomography (OCT) demonstrated the specific findings of the retinal nerve fiber layer (RNFL).
CASE SUMMARY
A 32-year-old male patient visited the hospital with right side visual field defect in both eyes that occurred immediately after a traffic accident 8 months prior. The visual acuity of both eyes was normal, and a relative afferent papillary defect was evident in the right eye. In addition, suspicious band atrophy of the right optic disc and thinning of the superior and inferior arcuate bundle were observed in the left eye. On visual field examination, homonymous hemianopia was present. Optic tract syndrome was suspected, although there was no abnormality of the visual tract on MRI. On fast RNFL thickness 3.4 scan, a thinning of RNFL in the nasal and temporal segments in the right eye and superior and inferior segments in the left eye were observed. Based on the findings, optic tract syndrome was diagnosed in the left eye.
CONCLUSIONS
We report specific OCT findings which can be useful when making a diagnosis of optic tract syndrome.
MeSH Terms
Figure
-

Figure 1. Fundus photographs. Photographs shows a horizontal pallor of the right optic disc (band or bowtie atrophy), with a superi-or and inferior arcuate bundle thinning in the left eye.
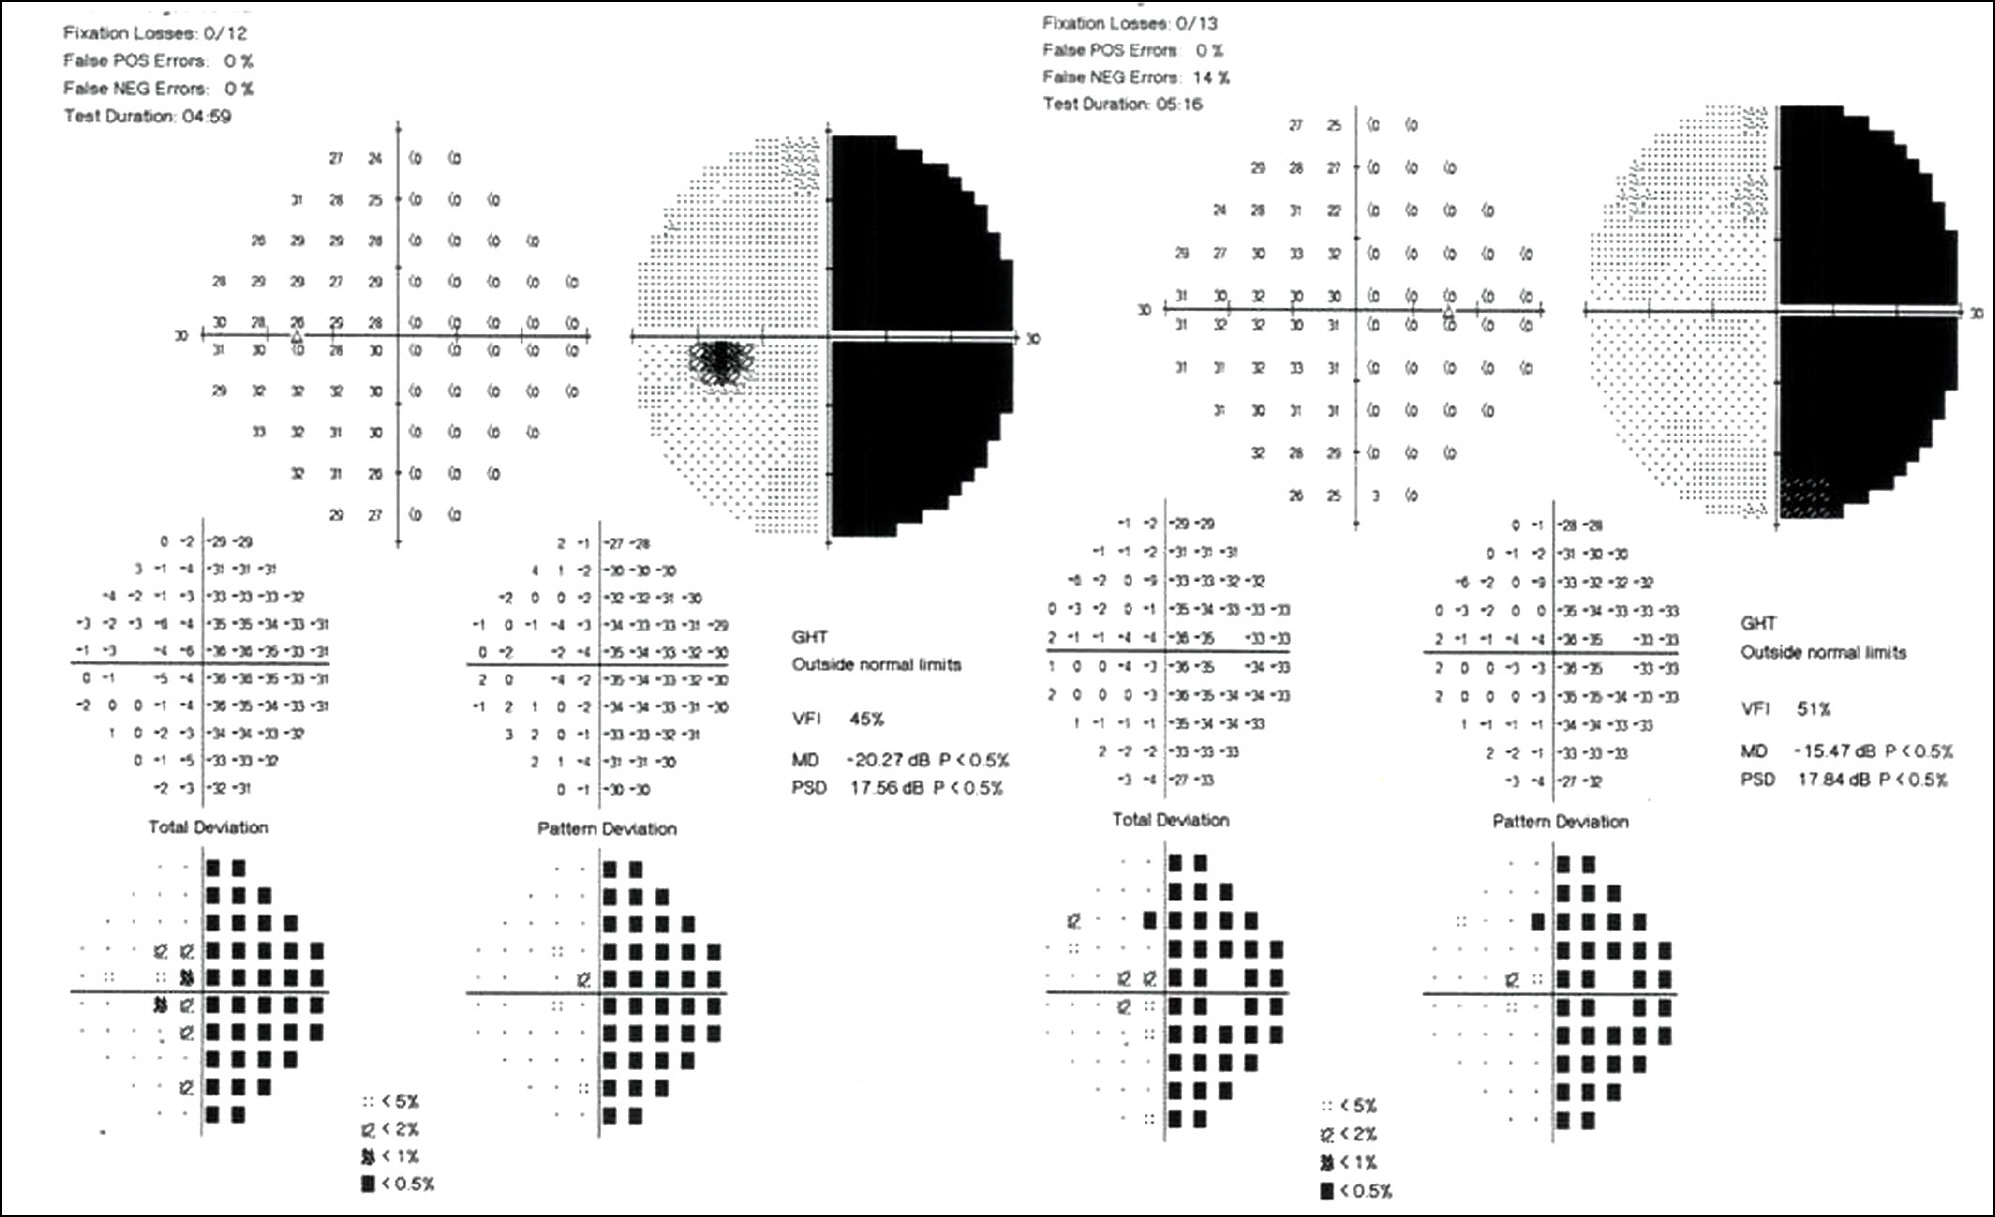
Figure 2. Visual field as determined by Humphrey automated perimetry. The visual field test demonstrates a right sided homon-ymous hemianopia.
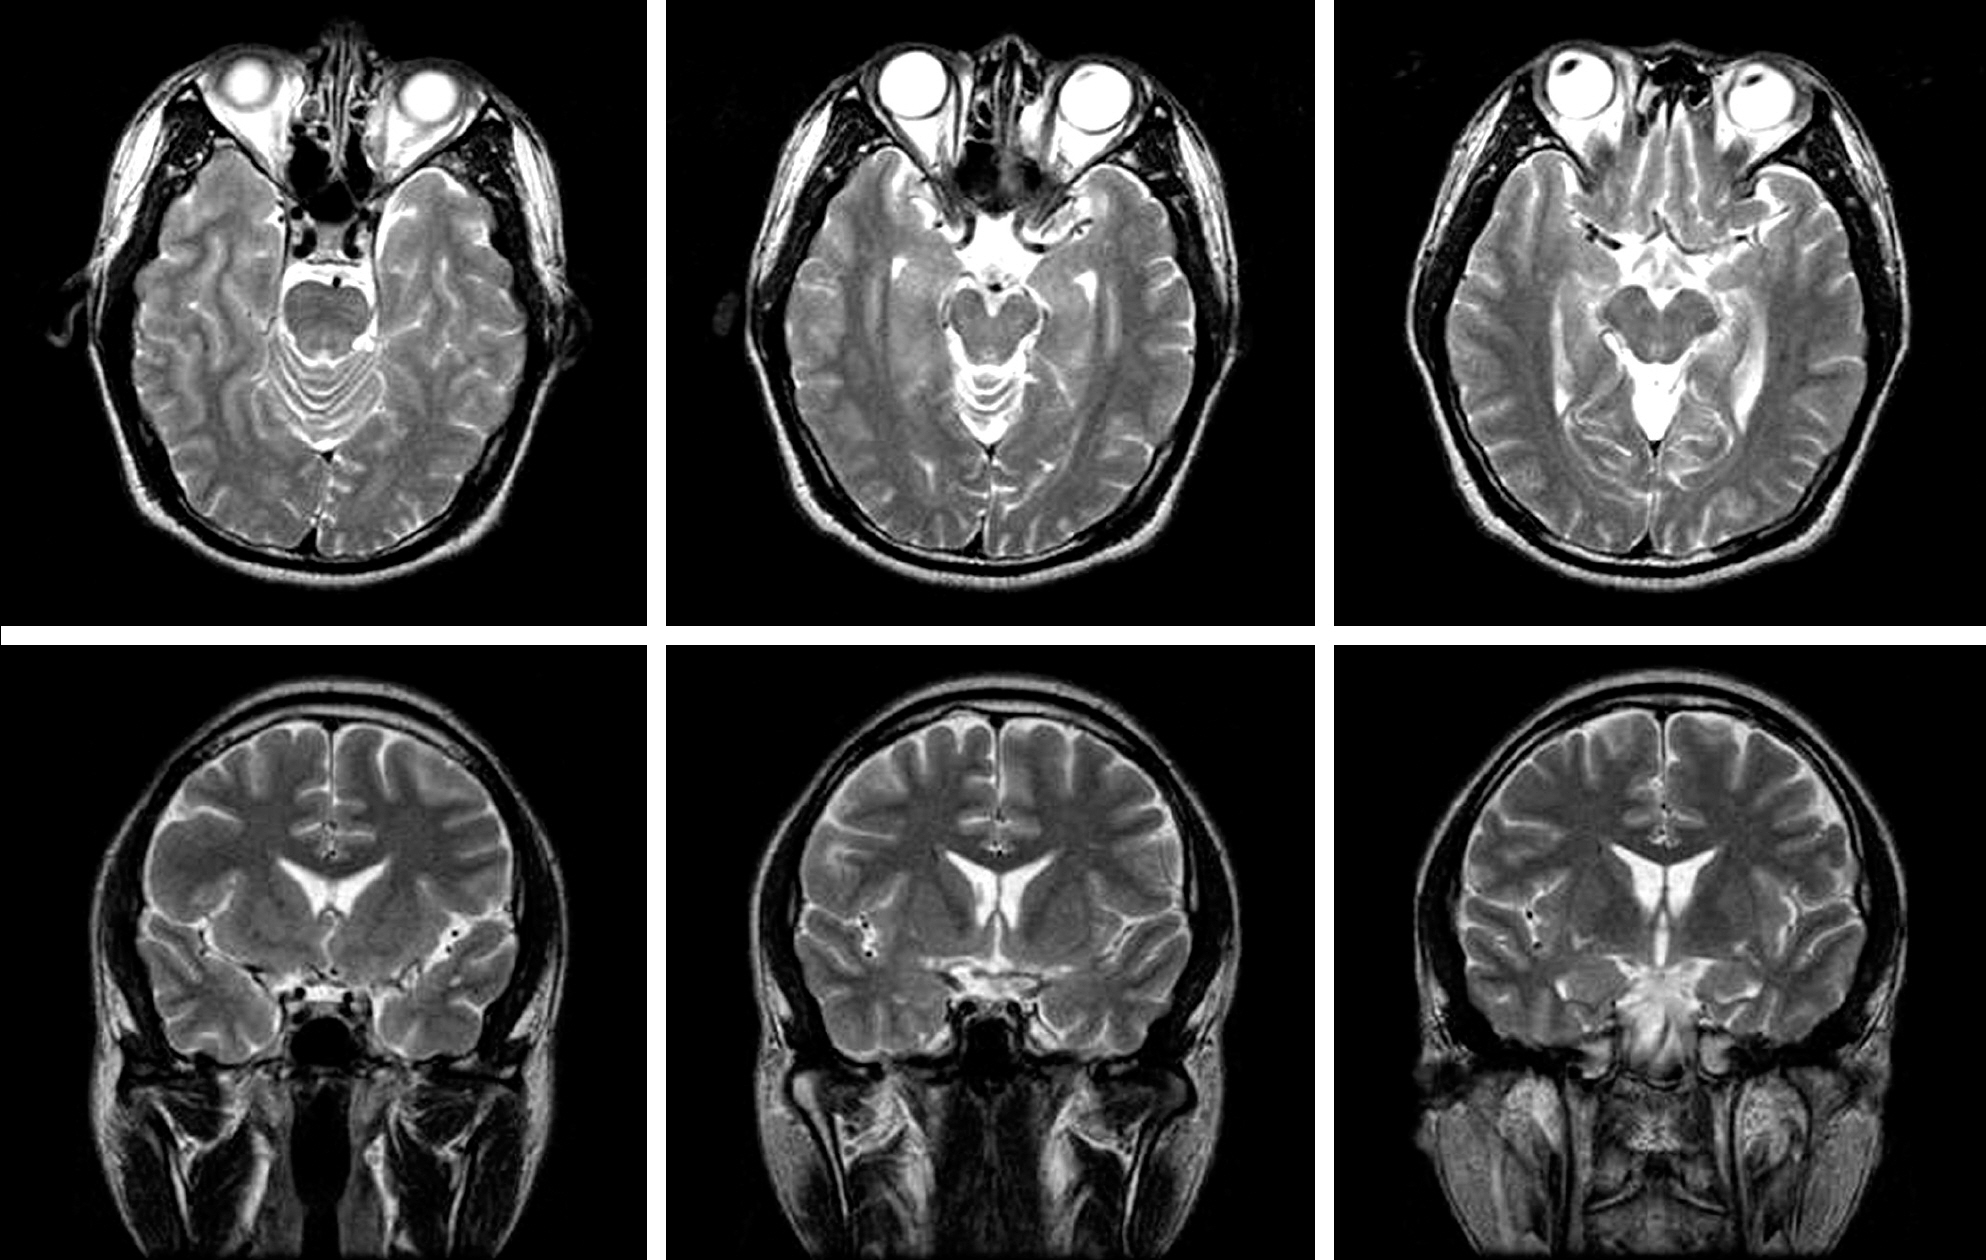
Figure 3. Brain Magnetic resonance imaging (T2). Magnetic resonance imaging does not detect abnormal findings.

Figure 4. Retinal nerve fiber layer (RNFL) thickness profile of the Stratus OCT analysis. Fast RNFL thickness scan shows decreased RNFL thickness of the nasal and temporal quadrants in the right eye and the su-perior and inferior quadrants in the left eye.
Cited by 1 articles
-
Ganglion Cell Analysis in an Optic Tract Syndrome Patient Previously Diagnosed with Glaucoma
Jinu Kim, Mi Ra Park, Younhea Jung
J Korean Ophthalmol Soc. 2019;60(1):91-95. doi: 10.3341/jkos.2019.60.1.91.
Reference
-
References
1. Miller NR, Newman NJ. Walsh & Hoyt’s Clinical neuro-ophthalmol-ogy, 6th edition. Baltimore:: William & Wilkins;2004. p. 518–23.2. Tatsumi Y, Kanamori A, Kusuhara A, et al. Retinal nerve fiber lay-er thickness in optic tract syndrome. Jpn J Ophthalmol. 2005; 49:294–6.
Article3. Newman SA, Miller NR. Optic tract syndrome. neuro-ophthalmo-logic considerations. Arch Ophthalmol. 1983; 101:1241–50.
Article4. Savino PJ, Paris M, Schatz NJ, et al. Optic tract syndrome. A re-view of 21 patients. Arch Ophthalmol. 1978; 96:656–63.
Article5. Subei AM, Eggenberger ER. Optical coherence tomography: an-other useful tool in a neuro-ophthalmologist’s armamentarium. Curr Opin Ophthalmol. 2009; 20:462–6.
Article6. Hsu CY, Lai YH, Hsu SY, et al. Optical coherence tomography (OCT) findings in patients with optic tract syndrome. Taiwan J Ophthalmol. 2011; 1:16–20.
Article7. Kanamori A, Nakamura M, Yamada Y, Negi A. Spectral-domain optical coherence tomography detects optic atrophy due to optic tract syndrome. Graefes Arch Clin Exp Ophthalmol. 2013; 251:591–5.
Article
- Full Text Links
-
- Actions
-
Cited
- CITED
-
- Close
- Share
-
- Similar articles
-
- Ganglion Cell Analysis in an Optic Tract Syndrome Patient Previously Diagnosed with Glaucoma
- Clinical Usefulness of Spectral-Domain Optical Coherence Tomography in Glaucoma and NAION
- Ocular Torsion Measured by Fundus Photographs and Optical Coherent Tomography in Normal Koreans
- The Use of Optical Coherence Tomography in Patients With Ethambutol-induced Optic Neuropathy
- Correlation between Visual Acuity and Retinal Nerve Fiber Layer Thickness in Optic Neuropathies
