Difference in Subfoveal Choroidal Thickness between Two Spectral-Domain Optical Coherence Tomography Systems
- Affiliations
-
- 1Cheil Eye Hospital, Daegu, Korea. eyejholee@hotmail.com
- KMID: 2217116
- DOI: http://doi.org/10.3341/jkos.2014.55.9.1327
Abstract
- PURPOSE
To determine the difference in subfoveal choroidal thickness between two spectral-domain optical coherence tomography (SD-OCT) systems in normal eyes and eyes with retinal diseases.
METHODS
Thirty-three normal eyes and 49 eyes with retinal disease (13 eyes with diabetic retinopathy, 28 eyes with epiretinal membrane and eight eyes with macular hole) were enrolled in the study. Subfoveal choroidal thicknesses were measured by 3 observers using the enhanced depth imaging technique of Heidelberg Spectralis(R) and the high-definition five-line raster scan of Cirrus HD-OCT(R) using calipers within the program. Differences between the measured values were analyzed with a paired t-test in PASW 18.0.
RESULTS
The mean age of normal eyes was 67.31 years, while eyes with diabetic retinopathy, epiretinal membrane and macular hole were aged 56.08 years, 70.00 years and 68.50 years, respectively. The mean subfoveal choroidal thickness of normal eyes was 237.61 +/- 104.60 microm for Spectralis and 239.52 +/- 92.08 microm for Cirrus and showed no significant difference (p = 0.397). Eyes with diabetic retinopathy, epiretinal membrane, and macular hole measured 267.46 +/- 74.91 microm, 236.79 +/- 84.16 microm and 209.63 +/- 86.71 microm for Spectralis, respectively, and 266.69 +/- 73.76 microm, 226.75 +/- 77.30 microm and 206.75 +/- 78.69 microm for Cirrus. They also showed no statistical difference (p > 0.05).
CONCLUSIONS
Subfoveal choroidal thickness measurements according to Heidelberg Spectralis(R) and Cirrus HD-OCT(R) in both normal eyes and eyes with retinal diseases showed no significant differences.
MeSH Terms
Figure
-

Figure 1. Optical coherence tomography (OCT) scans showing choroidal thicknesses of the same subject on two different systems. (A, B, C) An OCT image of subject on Heidelberg Spectralis® (Heidelberg Engineering, Heidelberg, Germany). Image averaging with the aid of eye tracking and enhanced depth imaging are used for choroidal visualization. Red line indicates choroidal thickness measurements taken perpendicularly from the outer edge of the hyper-reflective retinal pigment epithelium to the inner sclera at the fovea. (D, E, F) An OCT image of subject on Cirrus HD-OCT® (Carl Zeiss Meditec Inc., Dublin, CA). Image averaging is used for choroidal visualization. Red line indicates subfoveal choroidal thickness. ERM = epiretinal membrane; DR = diabetic retinopathy.
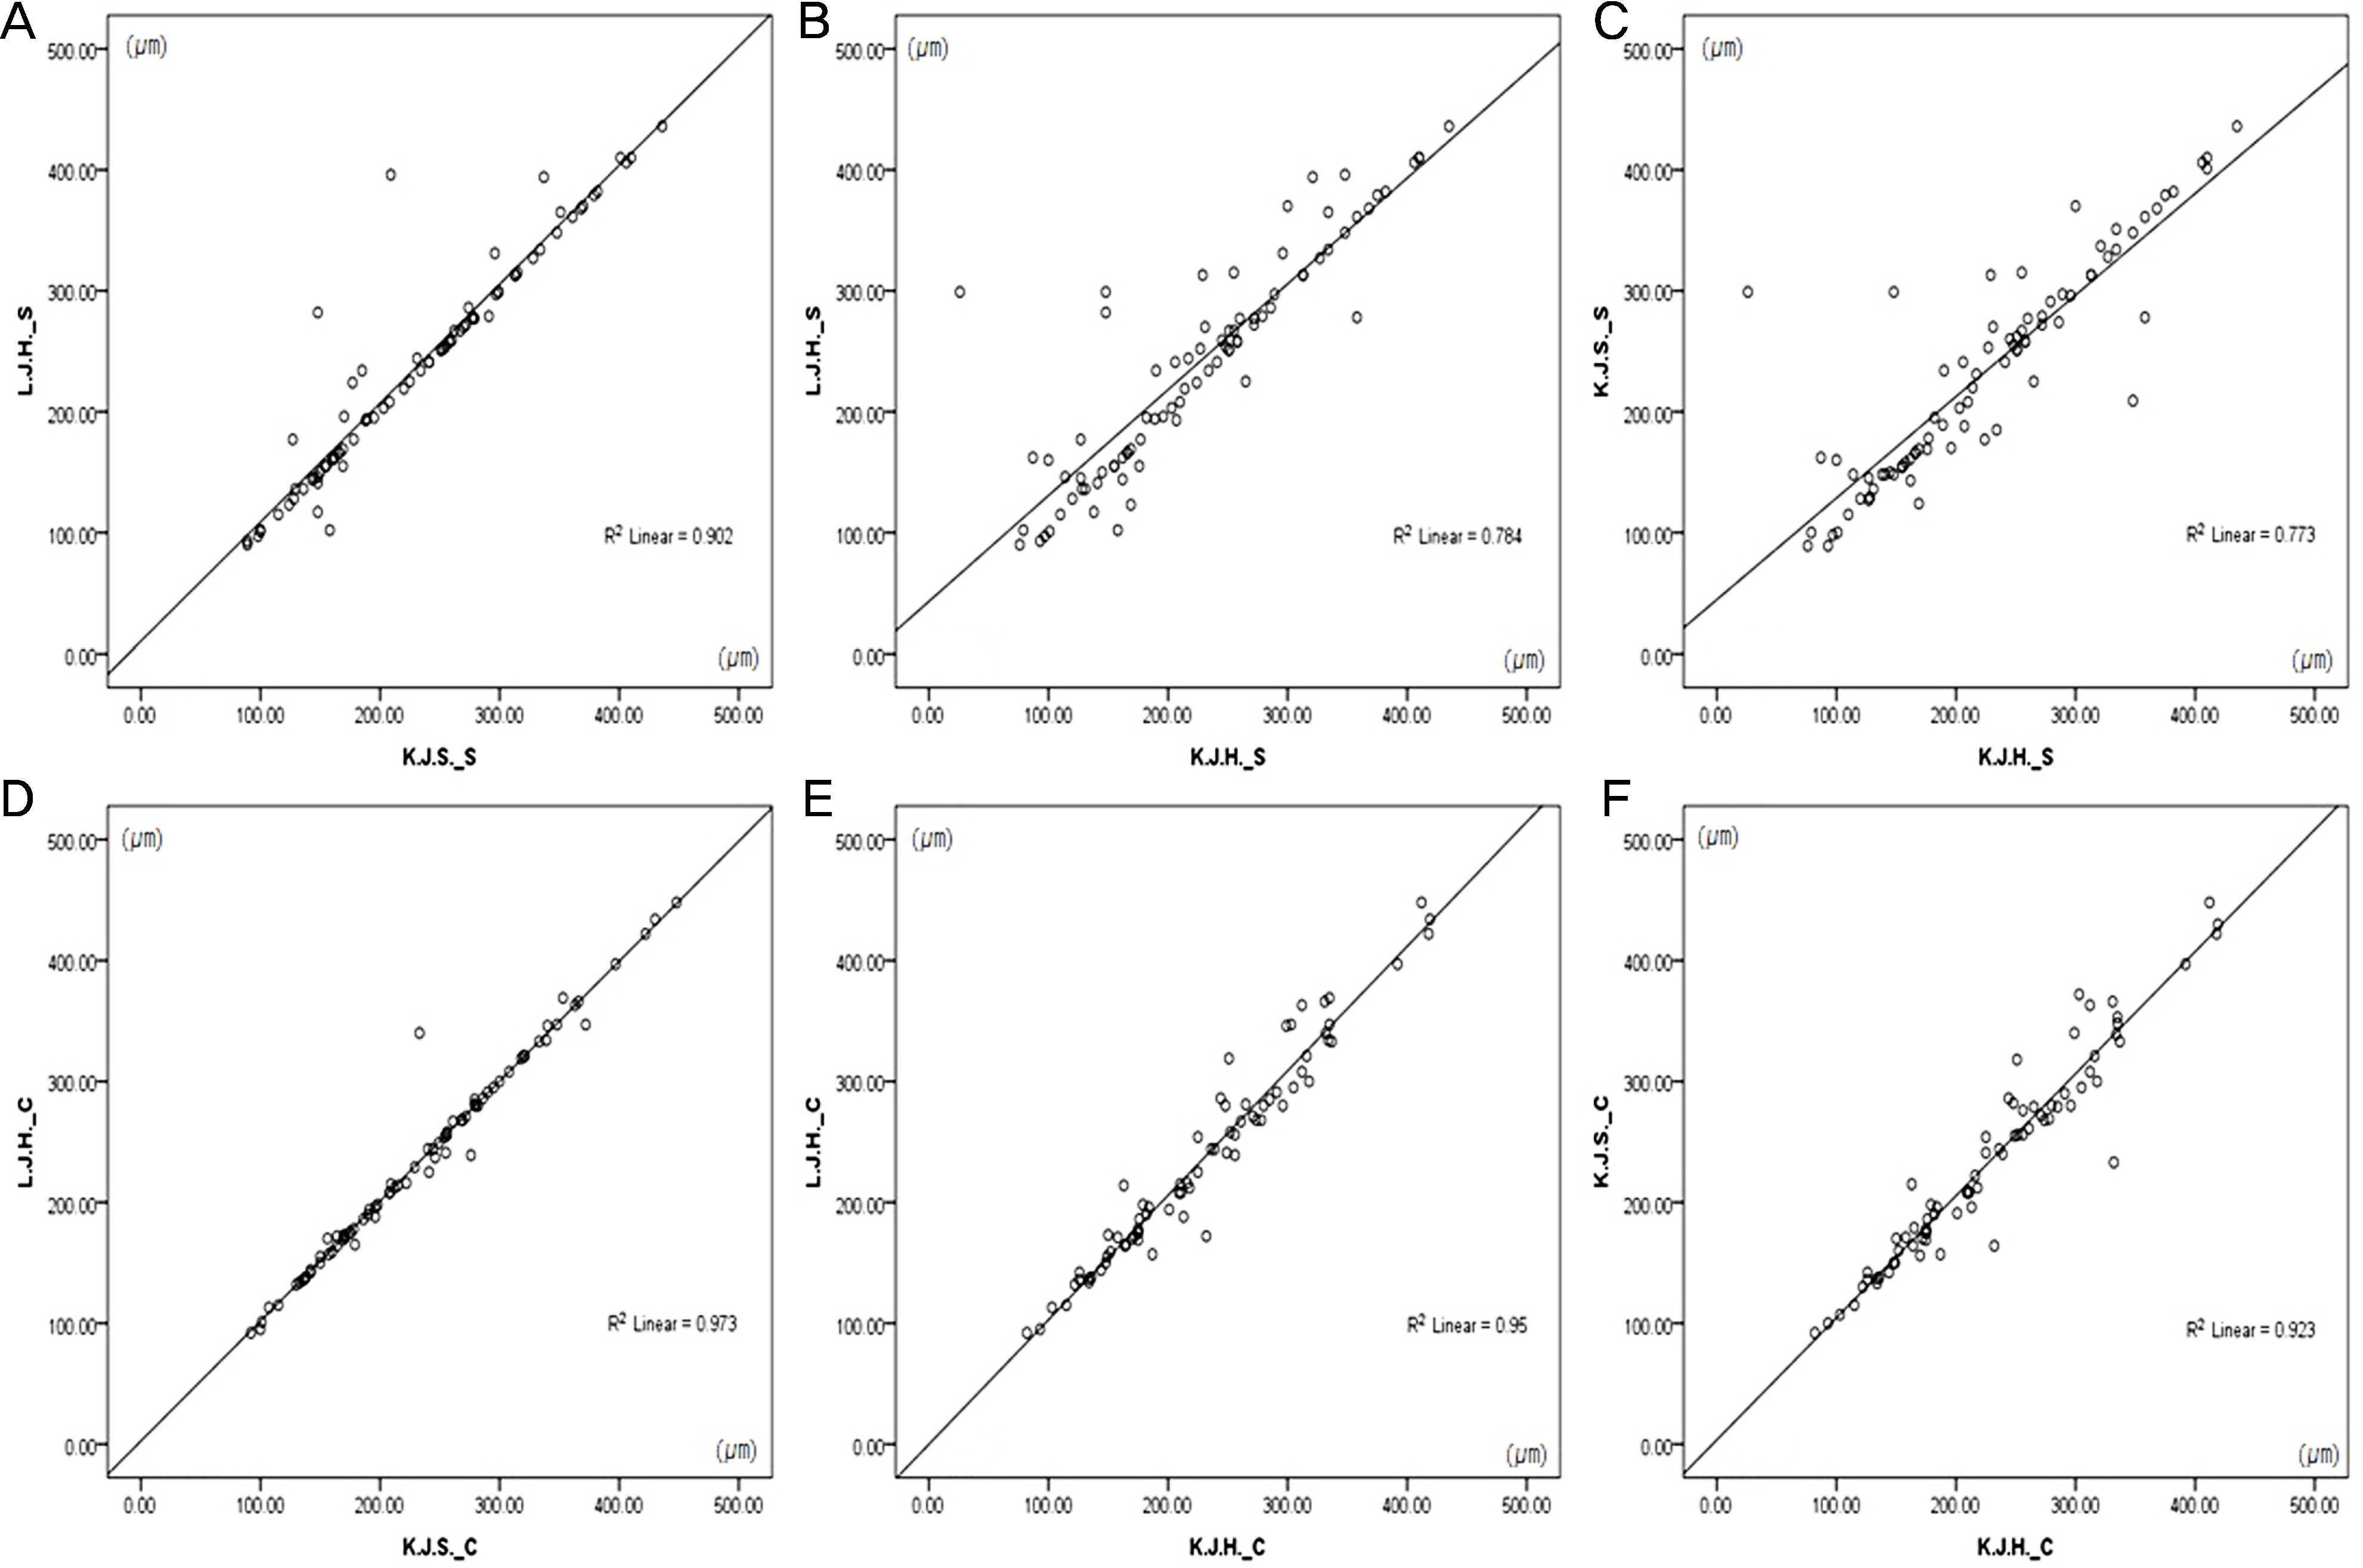
Figure 2. Scatterplots of measurements of each observer with two spectral domain optical coherence tomography. They show a significant positive correlation (p < 0.05) (A, B, C: Spectralis; D, E, F: Cirrus).

Figure 3. Bland-Altman plot for Spectralis versus Cirrus. Solid line indicates the average mean difference, whereas dotted lines delineate 95% confidence limits of agreement.
Cited by 1 articles
-
Changes in Choroidal Thickness after Panretinal Photocoagulation in Diabetic Retinopathy Patients
Sung Yu, Yong Il Kim, Kyoo Won Lee, Hyun Gu Kang
J Korean Ophthalmol Soc. 2016;57(2):256-263. doi: 10.3341/jkos.2016.57.2.256.
Reference
-
References
1. Fujiwara T, Imamura Y, Margolis R, et al. Enhanced depth imaging optical coherence tomography of the choroid in highly myopic eyes. Am J Ophthalmol. 2009; 148:445–50.
Article2. Imamura Y, Fujiwara T, Margolis R, Spaide RF. Enhanced depth imaging optical coherence tomography of the choroid in central serous chorioretinopathy. Retina. 2009; 29:1469–73.
Article3. Margolis R, Spaide RF. A pilot study of enhanced depth imaging optical coherence tomography of the choroid in normal eyes. Am J Ophthalmol. 2009; 147:811–5.
Article4. Spaide RF. Age-related choroidal atrophy. Am J Ophthalmol. 2009; 147:801–10.
Article5. Spaide RF. Enhanced depth imaging optical coherence tomography of retinal pigment epithelial detachment in age-related macular degeneration. Am J Ophthalmol. 2009; 147:644–52.
Article6. Spaide RF, Koizumi H, Pozzoni MC. Enhanced depth imaging spectral-domain optical coherence tomography. Am J Ophthalmol. 2008; 146:496–500.
Article7. Manjunath V, Taha M, Fujimoto JG, Duker JS. Choroidal thickness in normal eyes measured using Cirrus HD optical coherence tomography. Am J Ophthalmol. 2010; 150:325–9.e1.
Article8. Ferguson RD, Hammer DX, Paunescu LA, et al. Tracking optical coherence tomography. Opt Lett. 2004; 29:2139–41.
Article9. Pappuru RR, Briceno C, Ouyang Y, et al. Clinical significance of B-scan averaging with SD-OCT. Ophthalmic Surg Lasers Imaging. 2012; 43:63–8.
Article10. Branchini L, Regatieri CV, Flores-Moreno I, et al. Reproducibility of choroidal thickness measurements across three spectral domain optical coherence tomography systems. Ophthalmology. 2012; 119:119–23.
Article11. Ikuno Y, Tano Y. Retinal and choroidal biometry in highly myopic eyes with spectral-domain optical coherence tomography. Invest Ophthalmol Vis Sci. 2009; 50:3876–80.
Article12. Ho J, Sull AC, Vuong LN, et al. Assessment of artifacts and reproducibility across spectral- and time-domain optical coherence tomography devices. Ophthalmology. 2009; 116:1960–70.
Article13. Leung CK, Cheung CY, Weinreb RN, et al. Comparison of macular thickness measurements between time domain and spectral domain optical coherence tomography. Invest Ophthalmol Vis Sci. 2008; 49:4893–7.
Article14. Forooghian F, Cukras C, Meyerle CB, et al. Evaluation of time domain and spectral domain optical coherence tomography in the measurement of diabetic macular edema. Invest Ophthalmol Vis Sci. 2008; 49:4290–6.
Article15. Wolf-Schnurrbusch UE, Ceklic L, Brinkmann CK, et al. Macular thickness measurements in healthy eyes using six different optical coherence tomography instruments. Invest Ophthalmol Vis Sci. 2009; 50:3432–7.
Article16. Huang J, Liu X, Wu Z, et al. Macular thickness measurements in normal eyes with time-domain and Fourier-domain optical coherence tomography. Retina. 2009; 29:980–7.
Article17. Giani A, Cigada M, Choudhry N, et al. Reproducibility of retinal thickness measurements on normal and pathologic eyes by different optical coherence tomography instruments. Am J Ophthalmol. 2010; 150:815–24.
Article18. Yamashita T, Yamashita T, Shirasawa M, et al. Repeatability and reproducibility of subfoveal choroidal thickness in normal eyes of Japanese using different SD-OCT devices. Invest Ophthalmol Vis Sci. 2012; 53:1102–7.
Article19. Lee KH, Lee SC, Lee CS. Reproducibility of choroidal thickness in normal Korean eyes using two spectral domain optical coherence tomography. J Korean Ophthalmol Soc. 2013; 54:1365–70.
Article20. Esmaeelpour M, Brunner S, Ansari-Shahrezaei S, et al. Choroidal thinning in diabetes type 1 detected by 3-dimensional 1060 nm optical coherence tomography. Invest Ophthalmol Vis Sci. 2012; 53:6803–9.21. Esmaeelpour M, Považay B, Hermann B, et al. Mapping choroidal and retinal thickness variation in type 2 diabetes using three-dimensional 1060-nm optical coherence tomography. Invest Ophthalmol Vis Sci. 2011; 52:5311–6.
Article
- Full Text Links
-
- Actions
-
Cited
- CITED
-
- Close
- Share
-
- Similar articles
-
- Choroidal Thickness at the Outside of Fovea in Diabetic Retinopathy Using Spectral-Domain Optical Coherence Tomography
- Subfoveal Choroidal Thickness in Fellow Eyes of Patients with Central Serous Chorioretinopathy
- Choroidal Thickness in Primary Open-Angle Glaucoma Using Spectral-Domain Optical Coherence Tomography
- Measurement of Choroidal Thickness in Normal Eyes Using 3D OCT-1000 Spectral Domain Optical Coherence Tomography
- Comparison of Choroidal Thickness in Patients with Diabetes by Spectral-domain Optical Coherence Tomography
