Macular Thickness in Healthy Korean Eyes Using OCT3 Comparing with Normative Data
- Affiliations
-
- 1Department of Ophthalmology, Gachon University Gil Medical Center, Incheon, Korea. eyedawns@gilhospital.com
- KMID: 2211491
- DOI: http://doi.org/10.3341/jkos.2008.49.4.601
Abstract
-
PURPOSE: To determine whether there are significant differences between the retinal thicknesses of the macular area in eyes of healthy Koreans compared with normative data using OCT3 (version 4.0).
METHODS
The study was performed in 111 eyes of 71 adults between the ages of 20 and 69 with corrected vision of 0.8 or greater and no systemic or ocular disease. The subject group was designed to have a similar age distribution to that of normative data. An OCT3 fast macular map was used to measure macular thickness. The results were further analyzed and compared with the normative data.
RESULTS
The overall results from the subject group were similar to the normative data. However, the nasal parts of the outer ring were thicker than the normative data and the temporal parts of the outer ring were thinner (p<.0001). When each age group was compared, the thickness of the superior part of the inner ring and the nasal part of the inner and outer rings were thicker than the normative data in the age groups of twenties and thirties (p<.05). For the nasal parts of outer ring, the macula were thicker by OCT examination than the normative data in 25.2% of subjects, although they were clinically normal.
CONCLUSIONS
Macular thickness in healthy Koreans was generally similar to the normative data of OCT3. However, a slight difference may exist and must be considered when measuring and interpreting macular thickness measurements.
MeSH Terms
Figure
-

Figure 1. Sample OCT3 display of diabetic macular edema patient with normative data. It displays the macular normative database information in the form of clinically useful fast macular map and chart. Colored bands demonstrate the normal distribution of macular thickness measurements.

Figure 2. An analysis of the spread of macular thickness by OCT3 normative data in healthy Korean. At first the population was divided in age categories, and then five sub‐ groups were made according to color‐ code of the normative data. Color-code of the normative data was divided in following percentile categories: more than 99% as very thick, 95∼99% as thick, 5∼95% as normal, 1∼ 5% as thin, and less than 1% as very thin. Number of eyes was presented in each macular area of each sub-group. Some cases represented abnormal, even though patients' macula was normal clinically. * 1 mm=1 mm central ring; †3=3 mm inner ring; ‡6=6 mm outer ring; § tem=temporal; ∏ sup=superior; # nas=nasal; ** inf=inferior.
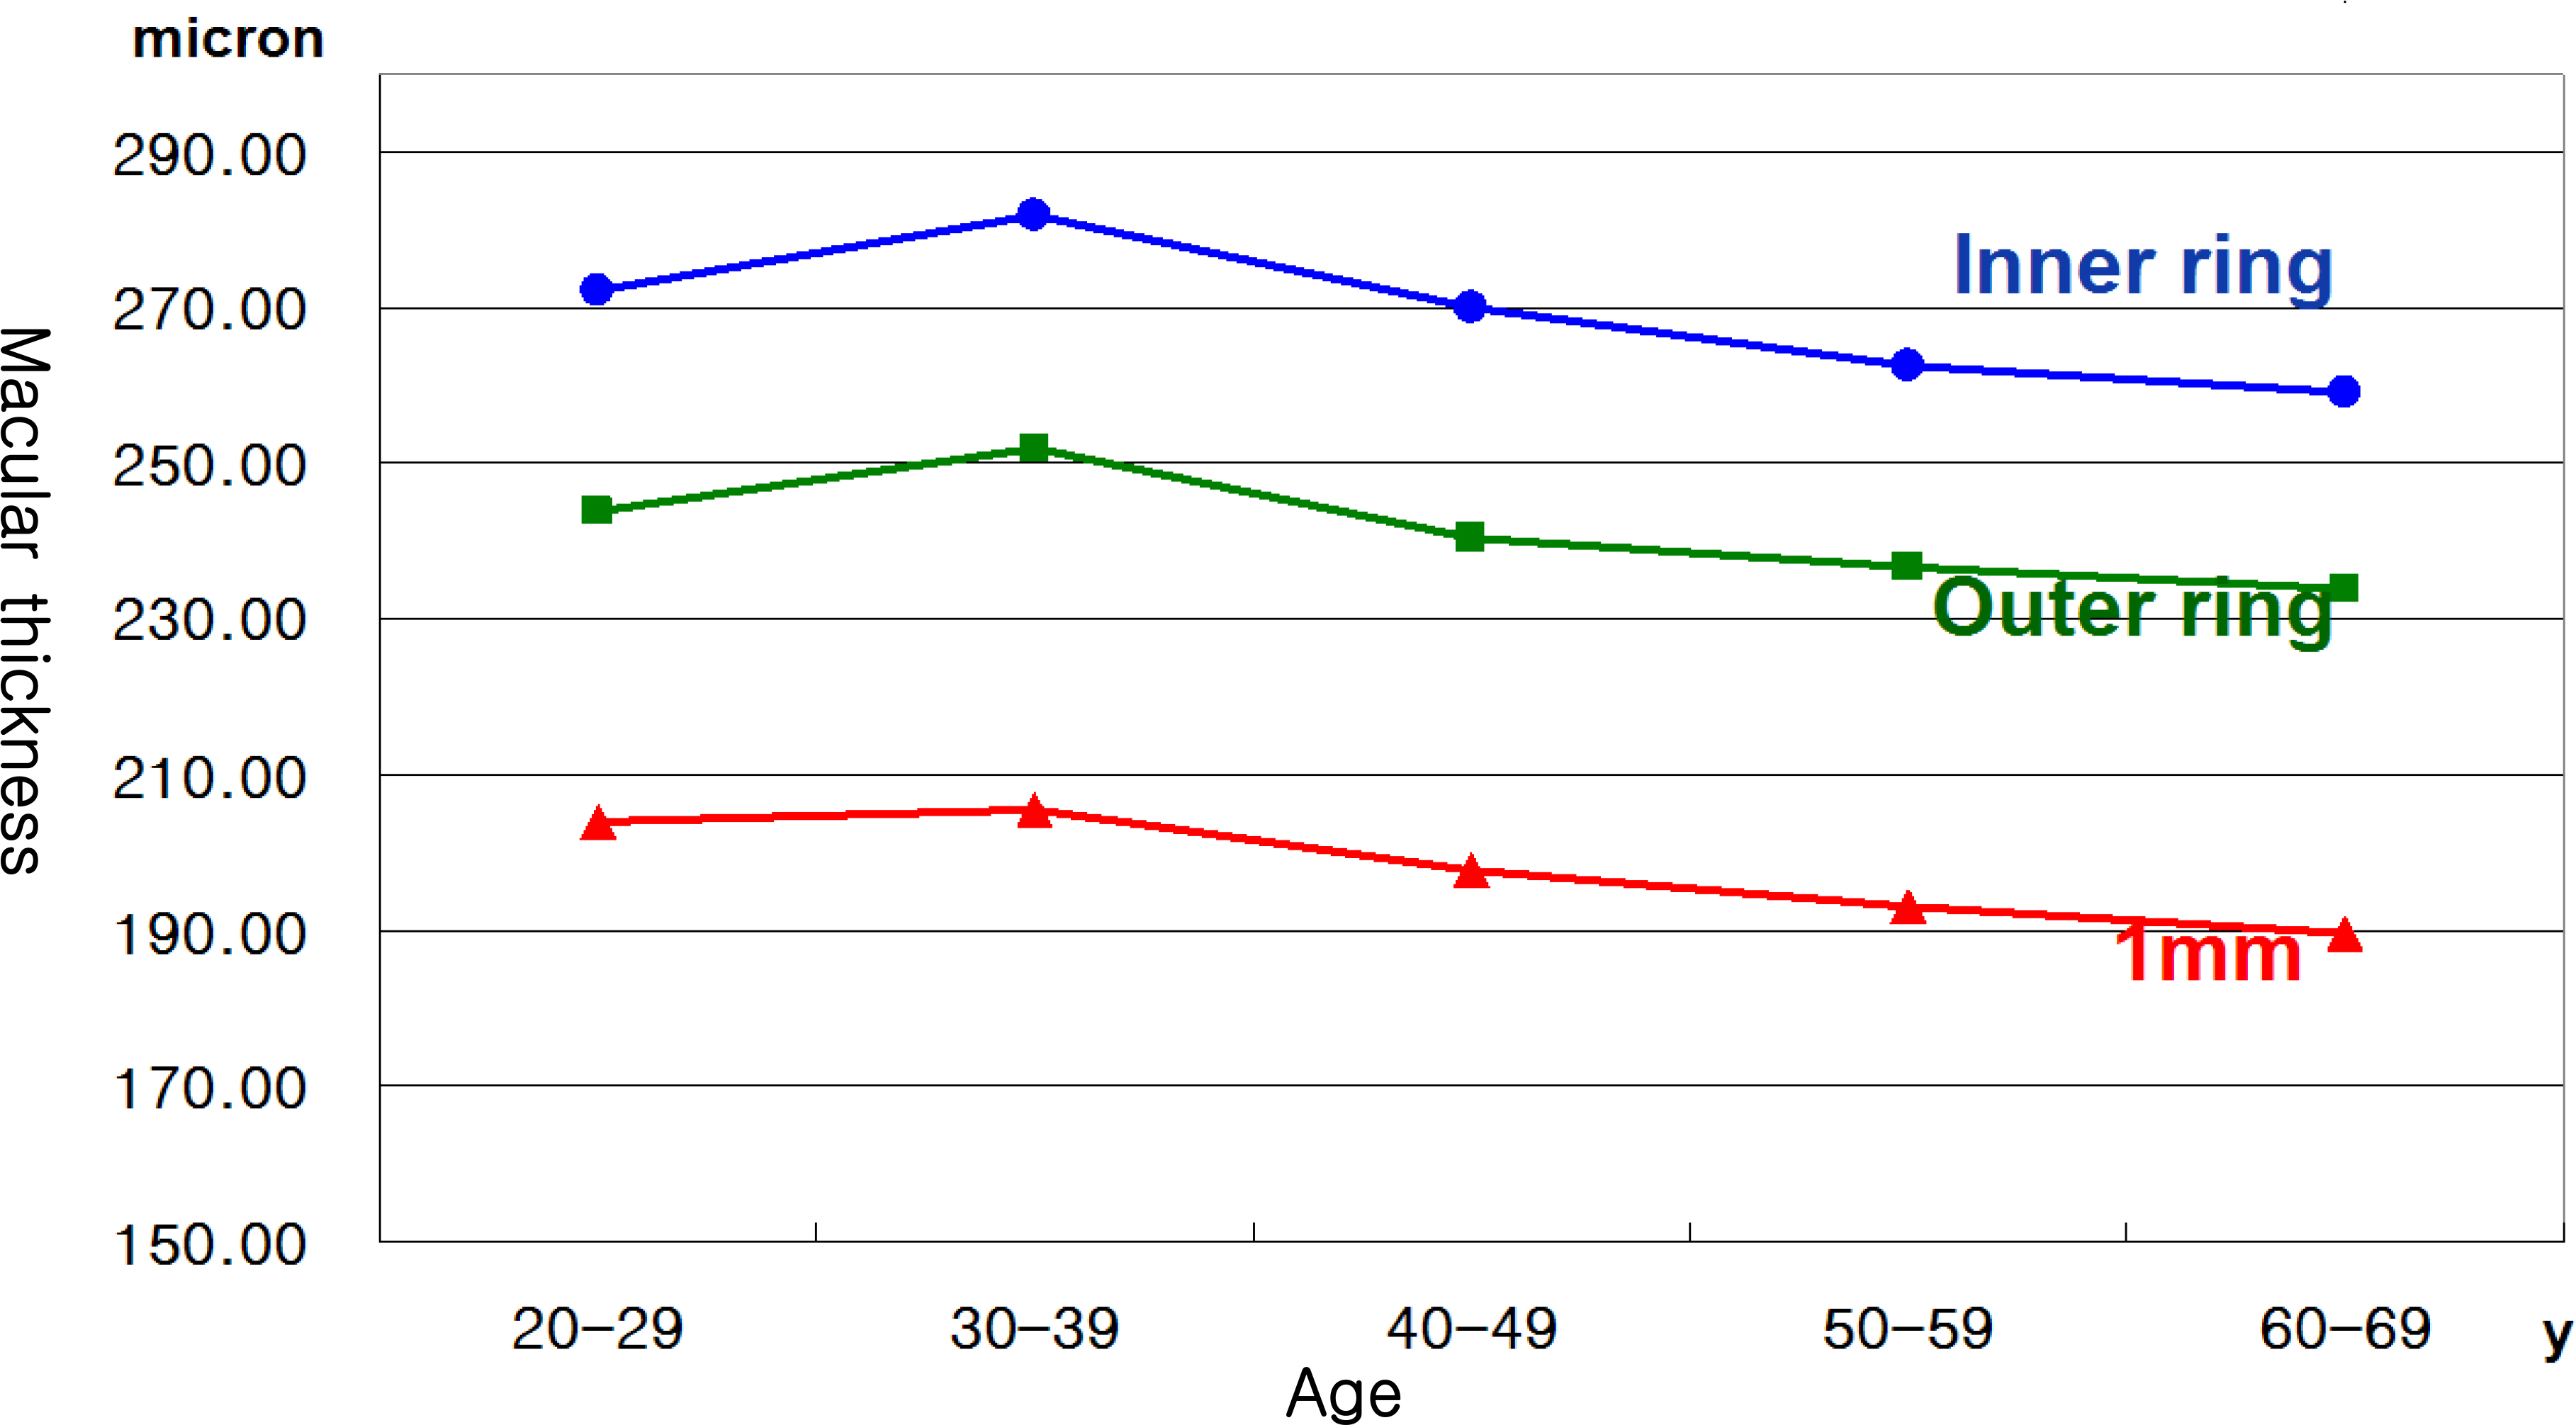
Figure 3. Comparison of healthy Korean macular thickness among the age groups.
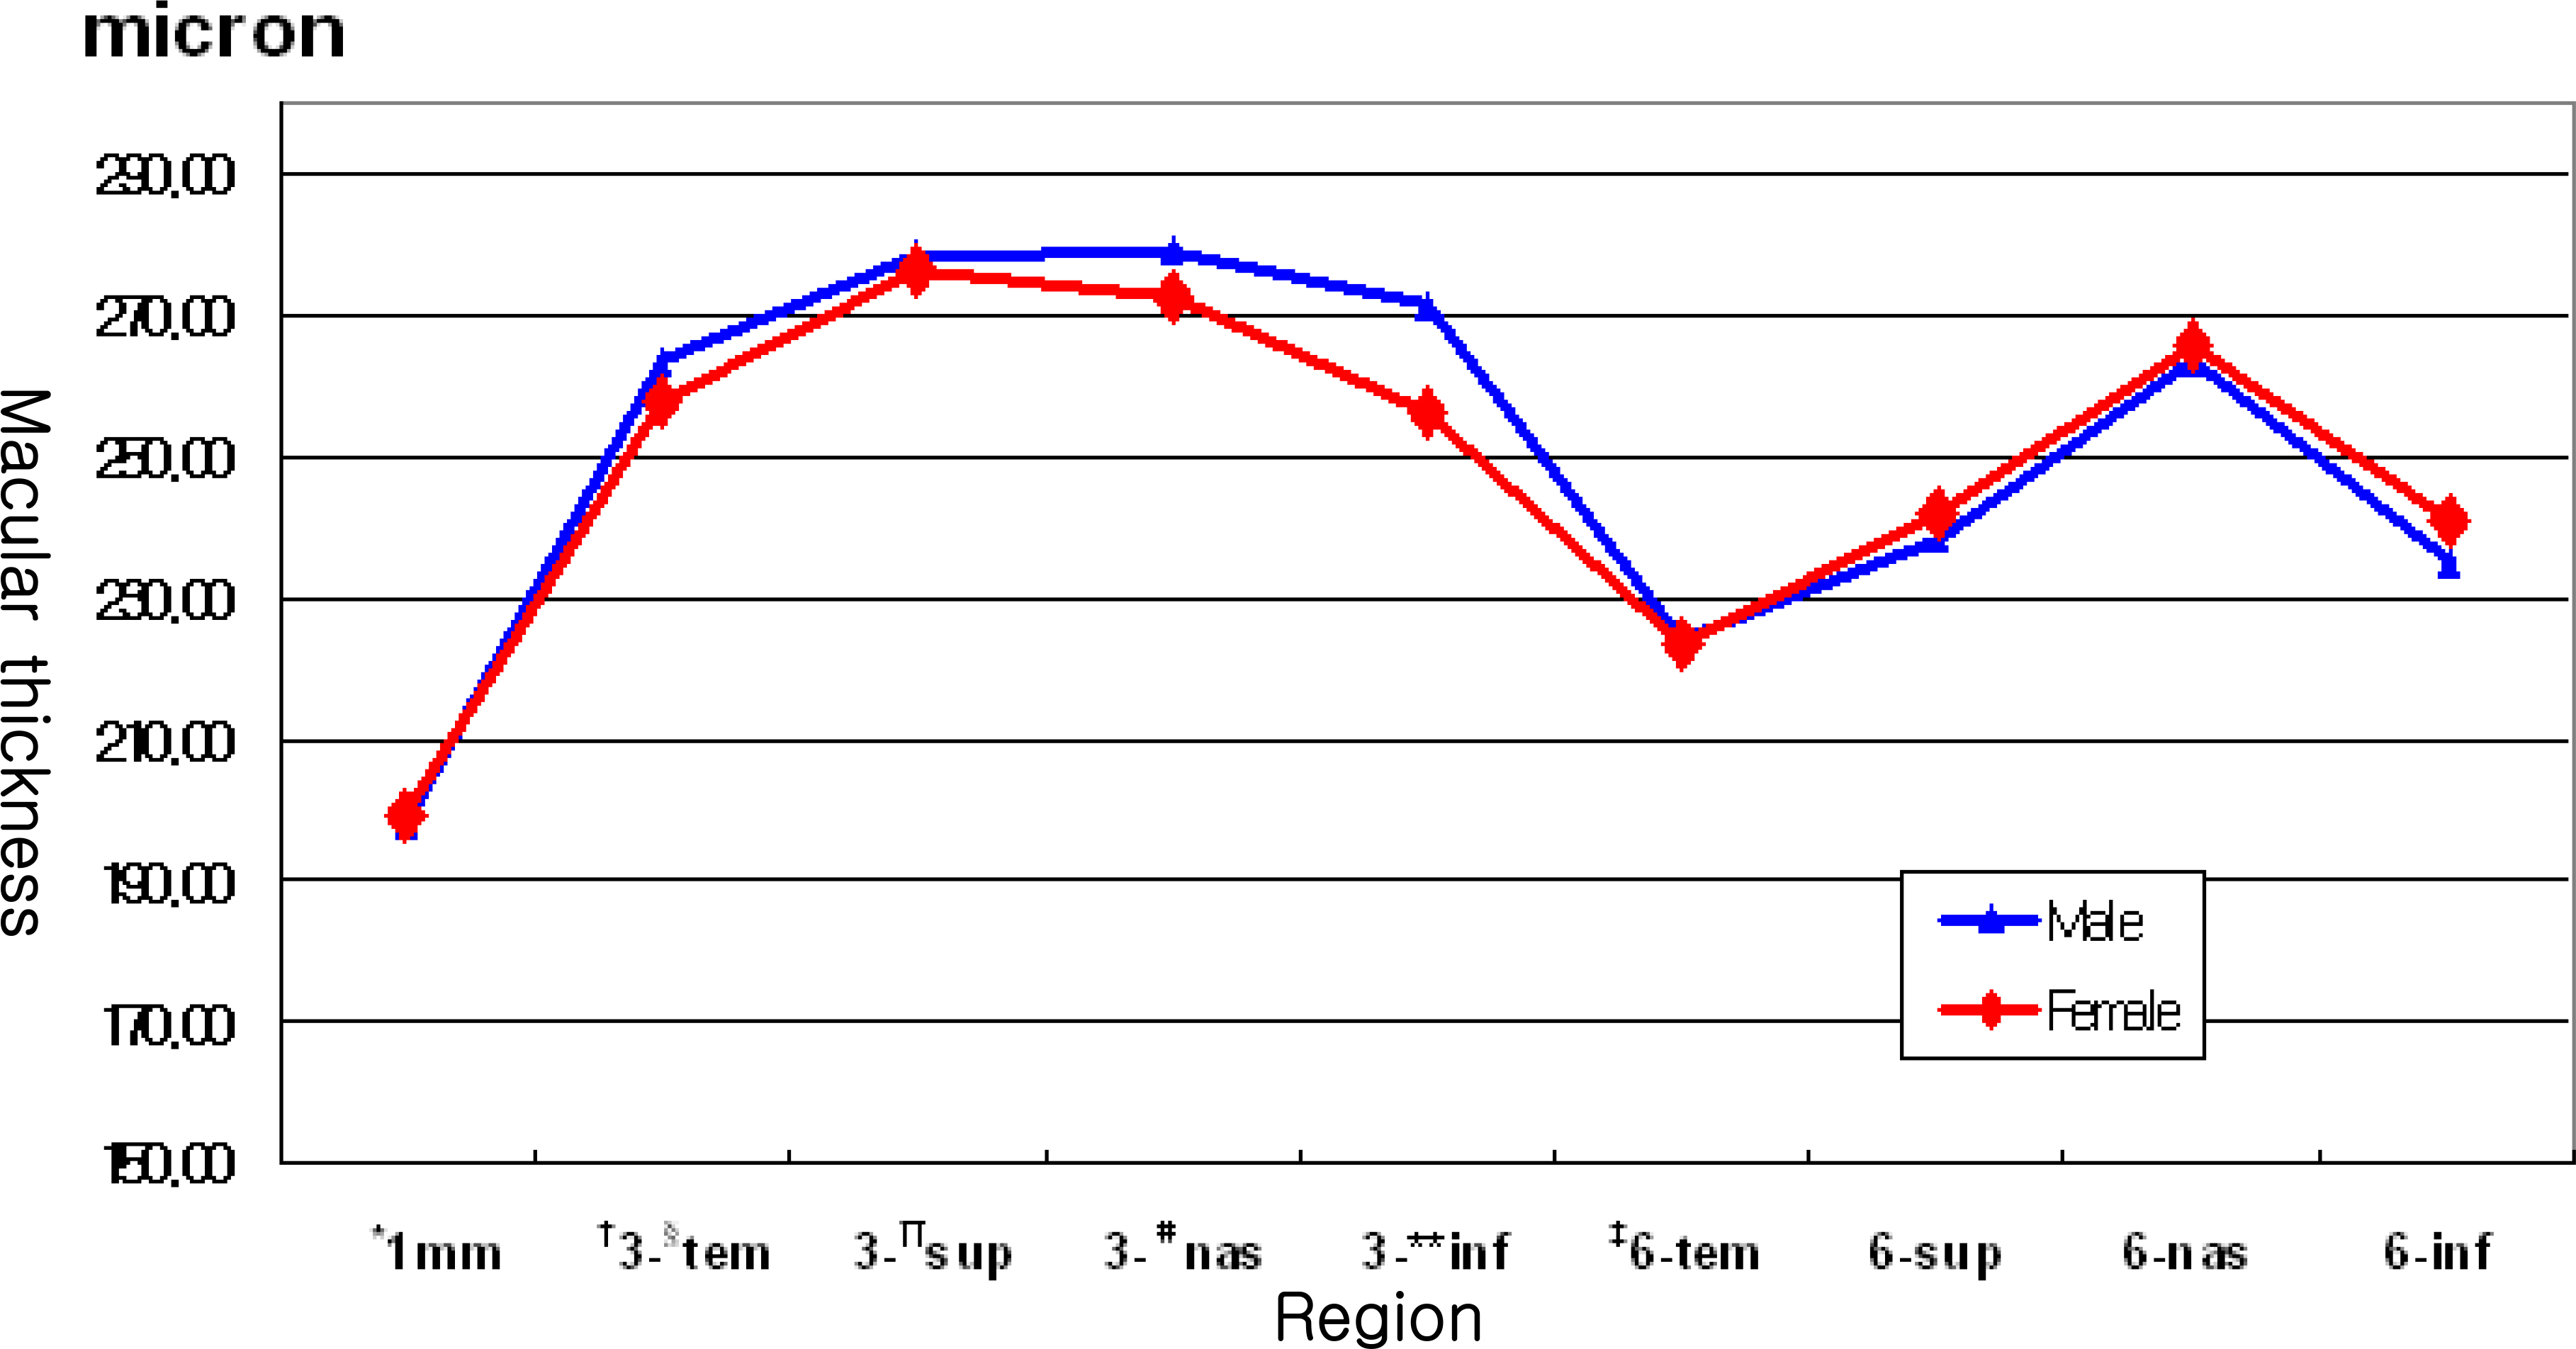
Figure 4. Comparison of healthy Korean macular thickness between male and female. * 1 mm=1 mm central ring; †3=3 mm inner ring; ‡6=6 mm outer ring; § tem=temporal; ∏ sup=superior; # nas=nasal; ** inf=inferior.
Cited by 1 articles
-
Repeatability and Agreement of Macular Thickness Measurement Using Time Domain OCT and Spectral Domain OCT in Normal Subjects
Se Beum Oh, Won Bin Cho, Jun Woong Moon, Hyung Chan Kim
J Korean Ophthalmol Soc. 2009;50(5):710-716. doi: 10.3341/jkos.2009.50.5.710.
Reference
-
References
1. Ferris FL III, Patz A. Macular edema. A complication of diabetic retinopathy. Surv Ophthalmol. 1984; 28:S452–61.2. Nussenblatt RB, Kaufman SC, Palestine AG, et al. Macular thickening and visual acuity. Measurement in patients with cystoid macular edema. Ophthalmology. 1987; 94:1134–9.3. Hee MR, Puliafito CA, Wong C, et al. Quantitative assessment of macular edema with optical coherence tomography. Arch Ophthalmol. 1995; 113:1019–29.
Article4. Early Treatment Diabetic Retinopathy Study Research Group. Grading diabetic retinopathy from stereoscopic color fundus photographs‐ an extension of the modified Airlie House classification. ETDRS report number 10. Ophthalmology. 1991; 98:786–806.5. Zeimer RC, Mori MT, Khoobehi B. Feasibility test of a new method to measure retinal thickness noninvasively. Invest Ophthalmol Vis Sci. 1989; 30:2099–105.6. Gieser JP, Rusin MM, Mori M, et al. Clinical assessment of the macula by retinal topography and thickness mapping. Am J Ophthalmol. 1997; 124:648–60.
Article7. Polito A, Shah SM, Haller JA, et al. Comparison between retinal thickness analyzer and optical coherence tomography for assessment of foveal thickness in eyes with macular disease. Am J Ophthalmol. 2002; 134:240–51.
Article8. Puliafito CA, Hee MR, Schuman JS, Fujimoto JG. Optical Coherence Tomography of Ocular disease. Thorofare, NJ: Slack;1996. p. 369–74.9. Muscat S, Parks S, Kemp E, Keating D. Repeatability and reproducibility of macular thickness measurements with the Humphrey system. Invest Ophthalmol Vis Sci. 2002; 43:490–5.10. Budenz DL, Anderson DR, Varma R, et al. Determinants of normal retinal nerve fiber layer thickness measured by Stratus OCT. Ophthalmology. 2007; 114:1046–52.
Article11. Massin P, Vicaut E, Haouchine B, et al. Reproducibility of retinal mapping using optical coherence tomography. Arch Ophthalmol. 2001; 119:1135–42.
Article12. Shrout PE, Fleiss JL. Intraclass correlations: uses in assessing rater reliability. Pshychol Bull. 1979; 428–9.
Article13. Jung HJ, Hyun JH, Kim YI, Yun IH. Normal macular thickness measured with macular mapping of OCT3. J Korean Ophthalmol Soc. 2004; 45:962–8.14. Lee SM, Lee JH. Assessment of foveal thickness in normal Korean using retinal thickness analyzer and optical coherence tomography. J Korean Ophthalmol Soc. 2005; 46:1630–6.15. Kholodnykh AI, Petrova IY, Larin KV, et al. Precision of measurement of tissue optical properties with optical coherence tomography. Appl Opt. 2003; 42:3027–37.
Article16. Huang D, Swanson EA, Lin CP, et al. Optical coherence tomography. Science. 1991; 254:1178–81.
Article17. Hee MR, Puliafito CA, Duker JS, et al. Topography of diabetic macular edema with optical coherence tomography. Ophthalmology. 1998; 105:360–70.
Article18. Hogan MJ, Alvarado JA, Weddell JE. Histology of the Human Eye. Philadelphia: WB Saunders Company;1971. p. 492.19. Asrani S, Zou S, d'Anna S, et al. Noninvasive mapping of the normal retinal thickness at the posterior pole. Ophthalmology. 1999; 106:269–73.20. Massin P, Erginay A, Haouchine B, et al. Retinal thickness in healthy and diabetic subjects measured using optical coherence tomography mapping software. Eur J Ophthalmol. 2002; 12:102–8.
Article21. Paunescu LA, Schuman JS, Price LL, et al. Reproducibility of nerve fiber thickness, macular thickness, and optic nerve head measurements using Stratus OCT. Invest Ophthalmol Vis Sci. 2004; 45:1716–24.22. Kang JH, Kim SA, Song WG, Yoon HS. Macular thickness changes with age in normal subjects measured by optical coherence tomography. J Korean Ophthalmol Soc. 2004; 45:592–8.23. Chan A, Duker JS, Ko TJ, et al. Normal thickness measurements in healthy eyes using STRATUS optical coherence tomography. Arch Ophthalmol. 2006; 124:193–8.24. Tewari HK, Wagh VB, Sony P, et al. Macular thickness evaluation using the optical coherence tomography in normal Indian eyes. Indian J Ophthalmol. 2004; 52:199–204.25. Huynh SC, Wang XY, Rochtchina E, et al. Distribution of macular thickness by optical coherence tomography: Findings from a population‐ based study of 6‐ year‐ old children. Invest Ophthalmol Vis Sci. 2006; 47:2351–7.
- Full Text Links
-
- Actions
-
Cited
- CITED
-
- Close
- Share
-
- Similar articles
-
- Normal Macular Thickness Measured Macular Mapping of OCT3
- Assessment of Foveal Thickness in Normal Korean using Retinal Thickness Analyzer and Optical Coherence Tomography
- Quantitative Analysis of Diabetic Macular Edema by Optical Coherence Tomography
- Quantitative Analysis of Macular Thickness with OCT Map
- Macular GCIPL Thickness in Idiopathic Macular Telangiectasia Type II
