Shear bond strength of dentin bonding agents cured with a Plasma Arc curing light
- Affiliations
-
- 1Department of Conservative Dentistry & Dental Research Institute, School of Dentistry, Seoul National University, Korea. chobh@snu.ac.kr
- KMID: 2175984
- DOI: http://doi.org/10.5395/JKACD.2008.33.3.213
Abstract
- The objective of this study was to compare dentin shear bond strength (DSBS) of dentin bonding agents (DBAs) cured with a plasma arc (PAC) light curing unit (LCU) and those cured with a light emitting diode (LED) LCU. Optical properties were also analyzed for Elipar freelight 2 (3M ESPE); LED LCU, Apollo 95E (DMT Systems); PAC LCU and VIP Junior (Bisco); Halogen LCU. The DBAs used for DSBS test were Scotchbond Multipurpose (3M ESPE), Singlebond 2 (3M ESPE) and Clearfil SE Bond (Kuraray). After DSBS testing, fractured specimens were analyzed for failure modes with SEM. The total irradiance and irradiance between 450 nm and 490 nm of the LCUs were different. LED LCU showed narrow spectral distribution around its peak at 462 nm whereas PAC and Halogen LCU showed a broad spectrum. There were no significant differences in mean shear bond strength among different LCUs (P > 0.05) but were significant differences among different DBAs (P < 0.001).
Keyword
MeSH Terms
Figure
-

Figure 1 Schematic diagram of metal iris assembly supported with Teflon wall. A, Embedding resin; B, Teflon coated metal iris; C, Teflon wall; D, Resin composite; E, Load application chisel
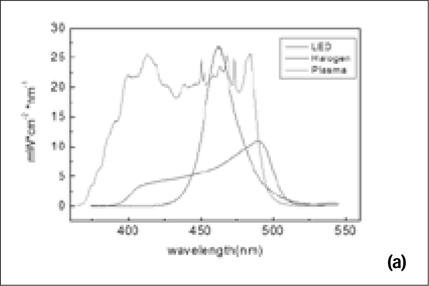
Figure 2(a) Spectral distributions of PAC, QTH and LED LCUs. PAC shows a broad spectral distribution with multiple peaks and QTH also has a broad spectrum but its peak (490 nm) deviated a little toward the lower end of IR range whereas LED shows a narrow spectral distribution around its peak at 462 nm.

Figure 2(b) Total irradiance and irradiances in 450 - 490 nm and 410 - 500 nm regions. Power density of PAC is reduced to 76% and 37% of total intensity in 410 - 500 nm and in 450 - 490 nm region, respectively and that of QTH is reduced to 88% and 48% whereas that of LED is reduced to 96% and 81%.
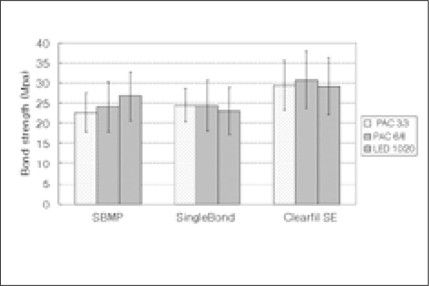
Figure 3 Mean shear bond strengths of DBAs cured with PAC and LED. There are statistically significant differences in the mean value among the different DBAs (p < 0.001) but not among the different LCUs (P > 0.05). There is no significant interaction between DBA and LCU.

Figure 4 Failure modes. Mixed failure was the most predominant failure mode followed by adhesive failure. There were only 3 cases of composite cohesive failures and no extensive dentin cohesive failure. There was no significant difference among the 9 groups assigned. MP, Scotchbond Multipurpose; SB, Single Bond; SE, Clearfil SE Bond; P3, Curing with PAC for 3 seconds; P6, Curing with PAC for 6 seconds; L10, Curing with LED for 10 seconds.

Figure 5(a) Adhesive failure (Clearfil SE Bond/Clearfil AP-X, SE cured with PAC for 6 seconds and AP-X was cured with PAC with 6 seconds). A, Gross shape of the fractured surface (× 35); B, Higher magnification of marked area in a (× 1000); C, Higher magnification of marked area in b(× 5000), dentinal tubules and resin tags can be observed.; D, Higher magnification of marked area in c (× 20000)
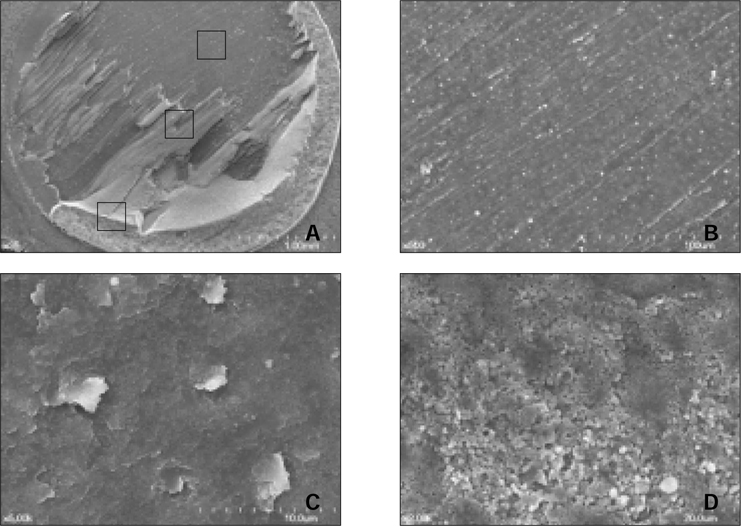
Figure 5(b) Mixed failure (Single Bond/Filtek Z250, SB was cured with PAC for 3 seconds and Z250 was cured with PAC for 3 seconds). A, Gross shape of the fractured surface (× 35); B, Higher magnification of upper marked area of adhesive failure (× 500); C, Higher magnification of middle marked area of mixed failure (× 5000), mixture of adhesive and composite can be observed.; D, Higher magnification of lower marked area of composite cohesive failure (× 20000), filler particles can be observed indicating presence of composite.

Figure 5(c) Cohesive failure in composite (ScotchBond MP/Filtek Z250, MP was cured with PAC for 6 seconds and Z250 was cured with PAC for 6 seconds). A, Gross shape of the fractured surface (× 35); B, C, D, higher magnifications (× 1000, × 5000 and × 20000) of surfaces with composite cohesive failure.
Cited by 1 articles
-
Temperature changes under demineralized dentin during polymerization of three resin-based restorative materials using QTH and LED units
Sayed-Mostafa Mousavinasab, Maryam Khoroushi, Mohammadreza Moharreri, Mohammad Atai
Restor Dent Endod. 2014;39(3):155-163. doi: 10.5395/rde.2014.39.3.155.
Reference
-
1. Craig RG, Powers JM. Restorative dental materials. 2001. 11th Ed.2. Althoff F, Hartung M. Advances in light curing. Am J Dent. 2000. 13:77D–81D.3. Jandt KD, Mills RW, Blackwell GB, Ashworth SH. Depth of cure and compressive strength of dental composites cured with blue light emitting diode (LEDs). Dent Mater. 2000. 16:41–47.
Article4. Mills RW. Blue light emitting diodes - another method of light curing? Br Dent J. 1995. 178:169. Letter.
Article5. Stahl F, Ashworth SH, Jandt KD, Mills RW. Light-emitting diode (LED) polymerisation of dental composites: flexural properties and polymerisation potential. Biomaterials. 2000. 21:1379–1385.
Article6. Price RBT, Felix CA, Andreou P. Evaluation of a dual peak third generation LED curing light. Compendium. 2005. 26:331–348.7. Kim SY, Lee IB, Cho BY, Son HH, Um CM. Curing effectiveness of a light emitting diode on dentin bonding agents. J Biomed Mater Res B Appl Biomater. 2006. 77:164–170.
Article8. Caughman WF, Rueggeberg FA. Shedding new light on composite polymerization. Oper dent. 2002. 27:636–638.9. Christensen GJ. The light-curing mania. JADA. 2004. 135:461–463.
Article10. Uhl A, Mills RW, Jandt KD. Polymerization and light-induced heat of dental composites cured with LED and halogen technology. Biomaterials. 2003. 24:1809–1820.
Article11. Teshima W, Nomura Y, Tanaka N, Urabe H, Okazaki M, Nahara Y. ESR study of camphorquinone/amine photoinitiator systems using blue-light emitting diodes. Biomaterials. 2003. 24:2097–2103.
Article12. Ramp LC, Broome JC, Ramp MH. Hardness and wear resistance of two resin composites cured with equivalent radiant exposure from a low irradiance LED and QTH light-curing units. Am J Dent. 2006. 19:31–36.13. Peutzfeldt A, Sahafi A, Asmussen E. Characterization of resin composites polymerized with plasma arc curing units. Dent Mater. 2000. 16(5):330–336.
Article14. Park SH, Krejci I, Lutz F. Microhardness of resin composites polymerized by plasma arc or conventional visible light curing. Oper Dent. 2002. 27:30–37.15. Lindberg A, Peuzfeldt A, Dijken JWV. Effect of power density of curing unit, exposure duration, and light guide distance on composite depth of cure. Clin Oral Investig. 2005. 9:71–76.
Article16. Lindberg A, Peuzfeldt A, Dijken JWV. Curing depths of a universal hybrid and a flowable resin composite cured with quartz tungsten halogen and light-emitting diode units. Acta Odontol Scand. 2004. 62:97–101.
Article17. Sudsangiam S, Van Noort R. Do dentin bond strength tests serve a useful purpose? J Adhes Dent. 1999. 1:57–67.18. Van Noort R, Cardew GE, Howard IC. A study of the interfacial shear and tensile stresses in a restored molar tooth. J Dent. 1988. 16:286–293.
Article19. Van Noort R, Noroozi S, Howard IC, Cardew G. A critique of bond strength measurements. J Dent. 1989. 17:61–67.
Article20. Versluis A, Tantbirojin , Douglas WH. Why do shear bond tests pull out dentin? J Dent Res. 1997. 76:1298–1307.
Article21. Dickens SH, Milos MF. Relationship of dentin shear bond strengths to different laboratory test designs. Am J Dent. 2002. 15:185–192.
- Full Text Links
-
- Actions
-
Cited
- CITED
-
- Close
- Share
-
- Similar articles
-
- Shear bond strength and adhesive failure pattern in bracket bonding with plasma arc light
- The shear bond strength and adhesive failure pattern in bracket bonding with different light-curing methods
- Dentin bond strength of bonding agents cured with light emitting diode
- Comparison of the shear bond strength of brackets in regards to the light curing source
- Effects of light direction and exposure times of plasma arc light on shear bond strength of metal brackets
