An Attempt for Combining Microarray Data Sets by Adjusting Gene Expressions
- Affiliations
-
- 1Oral Cancer Research Institute, Yonsei University College of Dentistry, Korea.
- 2Cancer Metastasis Research Center, Yonsei University College of Medicine, Seoul, Korea. rha7655@yuhs.ac
- 3National Biochip Research Center, Yonsei University College of Medicine, Seoul, Korea.
- 4Yonsei Cancer Center, Yonsei University College of Medicine, Seoul, Korea.
- 5Brain Korea 21 Project for Medical Science, Yonsei University College of Medicine, Seoul, Korea.
- 6Department of Internal Medicine, Yonsei University College of Medicine, Seoul, Korea.
Abstract
-
PURPOSE: The diverse experimental environments in microarray technology, such as the different platforms or different RNA sources, can cause biases in the analysis of multiple microarrays. These systematic effects present a substantial obstacle for the analysis of microarray data, and the resulting information may be inconsistent and unreliable. Therefore, we introduced a simple integration method for combining microaray data sets that are derived from different experimental conditions, and we expected that more reliable information can be detected from the combined data set rather than from the separated data sets.
MATERIALS AND METHODS
This method is based on the distributions of the gene expression ratios among the different microarray data sets and it transforms, gene by gene, the gene expression ratios into the form of the reference data set. The efficiency of the proposed integration method was evaluated using two microarray data sets, which were derived from different RNA sour-ces, and a newly defined measure, the mixture score.
RESULTS
The proposed integration method intermixed the two data sets that were obtained from different RNA sources, which in turn reduced the experimental bias between the two data sets, and the mixture score increased by 24.2%. A data set combined by the proposed method preserved the inter-group relationship of the separated data sets.
CONCLUSION
The proposed method worked well in adjusting systematic biases, including the source effect. The ability to use an effectively integrated microarray data set yields more reliable results due to the larger sample size and this also decreases the chance of false negatives.
Keyword
Figure
-
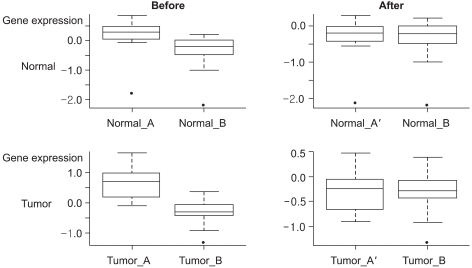
Fig. 1 Boxplots for the expression ratios of a randomly selected gene. Boxplots for the expression ratios of a randomly selected gene in both the normal and tumor groups from two different data sets and a transformed data set (normal_A, tumor_A, normal_B and tumor_B: the normal and tumor groups in data set A and data set B, respectively; normal_A' and tumor_A': the normal and tumor groups in transformed data set A).

Fig. 2 Density plots of 20 randomly selected genes. Density plots of 20 randomly selected genes from the data set comprising the normal group (red: data set A, black: data set B, blue: transformed data set). The horizontal and vertical axes represent the gene expression values and relative frequency, respectively.

Fig. 3 Density plots and scatter plot matrix of the two principal components. Density plots and scatter plot matrix of the two principal components (A) in data set A and data set B and (B) in the transformed data set and data set B (blue: data set A, red: data set B).

Fig. 4 Dendrogram for the two data sets. Dendrogram for the two data sets prior to (A) and after (B) the integration method. The Euclidean distance was used as a similarity measure and the average linkage method was used in this work.
Reference
-
1. Breitling R, Sharif O, Hartman ML, Krisans SK. Loss of compartmentalization causes misregulation of lysine biosynthesis in peroxisome-deficient yeast cells. Eukaryot Cell. 2002; 1:978–986. PMID: 12477798.
Article2. Lee PD, Sladek R, Greenwood CM, Hudson TJ. Control genes and variability: absence of ubiquitous reference transcripts in diverse mammalian expression studies. Genome Res. 2002; 12:292–297. PMID: 11827948.
Article3. Rhodes DR, Barrette TR, Rubin MA, Ghosh D, Chinnaitan AM. Meta-analysis of microarrays: interstudy validation of gene expression profiles reveals pathway dysregulation in prostate cancer. Cancer Res. 2002; 62:4427–4433. PMID: 12154050.4. Choi JK, Yu U, Kim S, Yoo OJ. Combining multiple microarray studies and modeling interstudy variation. Bioinformatics. 2003; 19(Suppl 1):I84–I90. PMID: 12855442.
Article5. Detours V, Dumont JE, Bersini H, Menhaut C. Integration and cross-validation of high-throughput gene expression data: Comparing heterogeneous data sets. FEBS Lett. 2003; 546:98–102. PMID: 12829243.
Article6. Ramaswamy S, Ross KN, Lander ES, Golub TR. A molecular signature of metastasis in primary solid tumors. Nat Genet. 2003; 33:49–54. PMID: 12469122.
Article7. Xin W, Rhodes DR, Ingold C, Chinnaiyan AM, Rubin MA. Dysregulation of the annexin family protein family is associated with prostate cancer progression. Am J Pathol. 2003; 162:255–261. PMID: 12507908.
Article8. Sorlie T, Tibshirani R, Parker J, Hastie T, Marron JS, Nobel A, et al. Repeated observation of breast tumor subtypes in independent gene expression data sets. Proc Natl Acad Sci USA. 2004; 100:8418–8423. PMID: 12829800.9. Choi JK, Choi JY, Kim DG, Choi DW, Kim BY, Lee KH, et al. Integrative analysis of multiple gene expression profiles applied to liver cancer study. FEBS Lett. 2004; 565:93–100. PMID: 15135059.10. Kuo WP, Jenssen TK, Butte AJ, Machado LO, Kohane IS. Analysis of matched mRNA measurements from two different microarray technologies. Bioinformatics. 2002; 18:405–412. PMID: 11934739.
Article11. Alter O, Brown PO, Botstein D. Singular value decomposition for genome-wide expression data processing and modelling. Proc Natl Acad Sci USA. 2000; 97:10101–10106. PMID: 10963673.12. Nielsen TO, West RB, Linn SC, Alter O, Knowling MA, O'connel J. Molecular characterisation of soft tissue tumours: a gene expression study. Lancet. 2002; 359:1301–1307. PMID: 11965276.
Article13. Benito M, Parker J, Du Q, Wu J, Xiang D, Perou CM, et al. Adjustment of systematic microarray data biases. Bioinformatics. 2004; 20:105–114. PMID: 14693816.
Article14. Jiang H, Deng Y, Chen HS, Tao L, Sha Q, Chen J, et al. Joint analysis of two microarray gene-expression data sets to select lung adenocarcinoma marker genes. BMC Bioinformatics. 2004; 5:81. PMID: 15217521.15. Park T, Yi SG, Shin YK, Lee SY. Combining multiple microarrays in the presence of controlling variables. Bioinformatics. 2006; 2:1682–1689. PMID: 16705015.
Article16. Kim TM, Jeong HJ, Seo MY, Kim SC, Cho G, Park CH, et al. Determination of genes related to gastrointestinal tract origin cancer cells using a cDNA microarray. Clin Cancer Res. 2005; 11:79–86. PMID: 15671531.
- Full Text Links
-
- Actions
-
Cited
- CITED
-
- Close
- Share
-
- Similar articles
-
- Possibility of the Use of Public Microarray Database for Identifying Significant Genes Associated with Oral Squamous Cell Carcinoma
- Significant Gene Selection Using Integrated Microarray Data Set with Batch Effect
- Disease Prediction Using Ranks of Gene Expressions
- Development of Microarray Gene Expression Database for MicroArray Gene Expression Markup Language
- Poor Correlation Between the New Statistical and the Old Empirical Algorithms for DNA Microarray Analysis
