A Case of Splenic Hamartoma Diagnosed by Contrast-enhanced Ultrasonography and Magnetic Resonance Imaging
- Affiliations
-
- 1Department of Internal Medicine, Gyeongsang National University School of Medicine, Jinju, Korea. kimthy@medimail.co.kr
- 2Department of Radiology, Gyeongsang National University School of Medicine, Jinju, Korea.
- 3Institute of Health Sciences, Gyeongsang National University School of Medicine, Jinju, Korea.
- KMID: 2160672
- DOI: http://doi.org/10.4166/kjg.2014.64.6.380
Abstract
- Splenic hamartoma is a very rare benign tumor, which is usually found incidentally after splenectomy or autopsy. Although percutaneous needle biopsy can be performed, it carries a high risk of bleeding after the procedure. Therefore, diagnosis is usually made by surgical resection. Herein, we report a case of splenic hamartoma diagnosed by magnetic resonance imaging and contrast-enhanced ultrasonography, which enables visualization of the unique signals of microbubbles in the vessels in real time. Relevant literature is also reviewed.
MeSH Terms
Figure
-
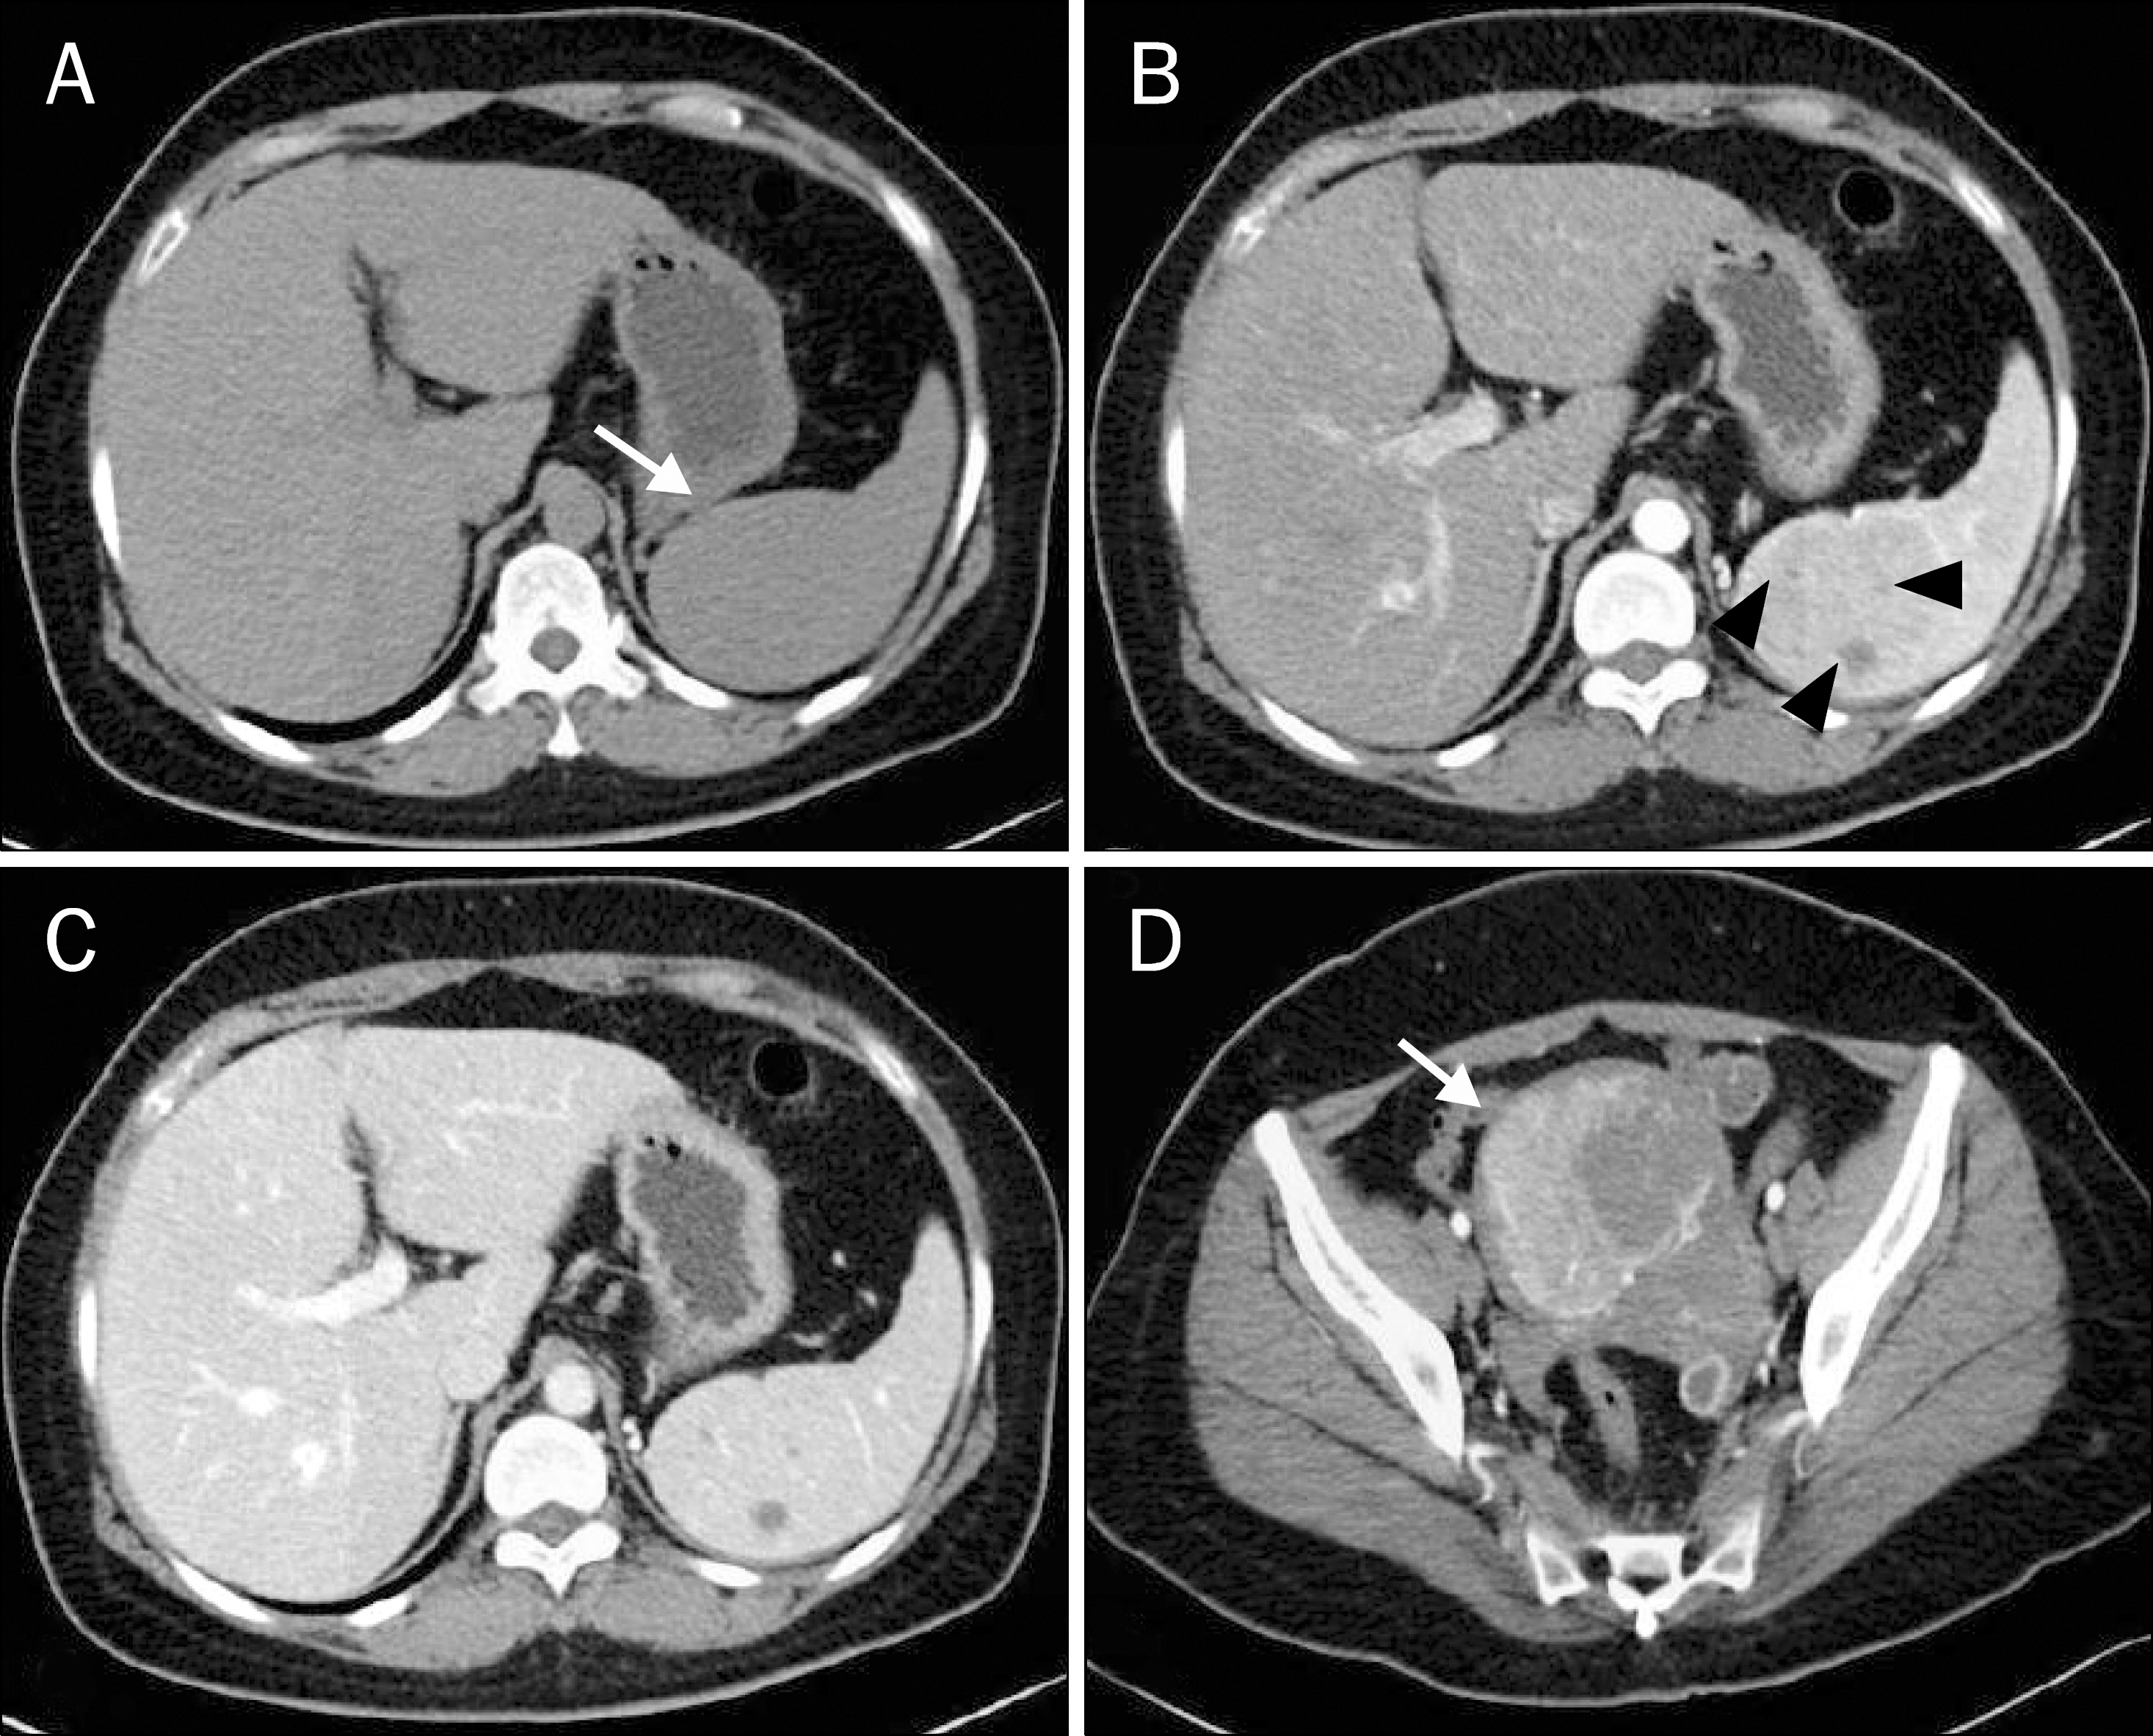
Fig. 1. Abdominal computed tomography scan. (A) Non-enhanced CT scan shows a mass (arrow) that bulges the splenic contour. Contrast-enhanced CT scan shows (B) hetero-genously enhancing mass with several small low density areas (arrow-heads) on artery phase, (C) the density of which becomes similar to the surrounding normal splenic parenchyma on delayed phase. (D) A uterine myoma (arrow) is also seen.
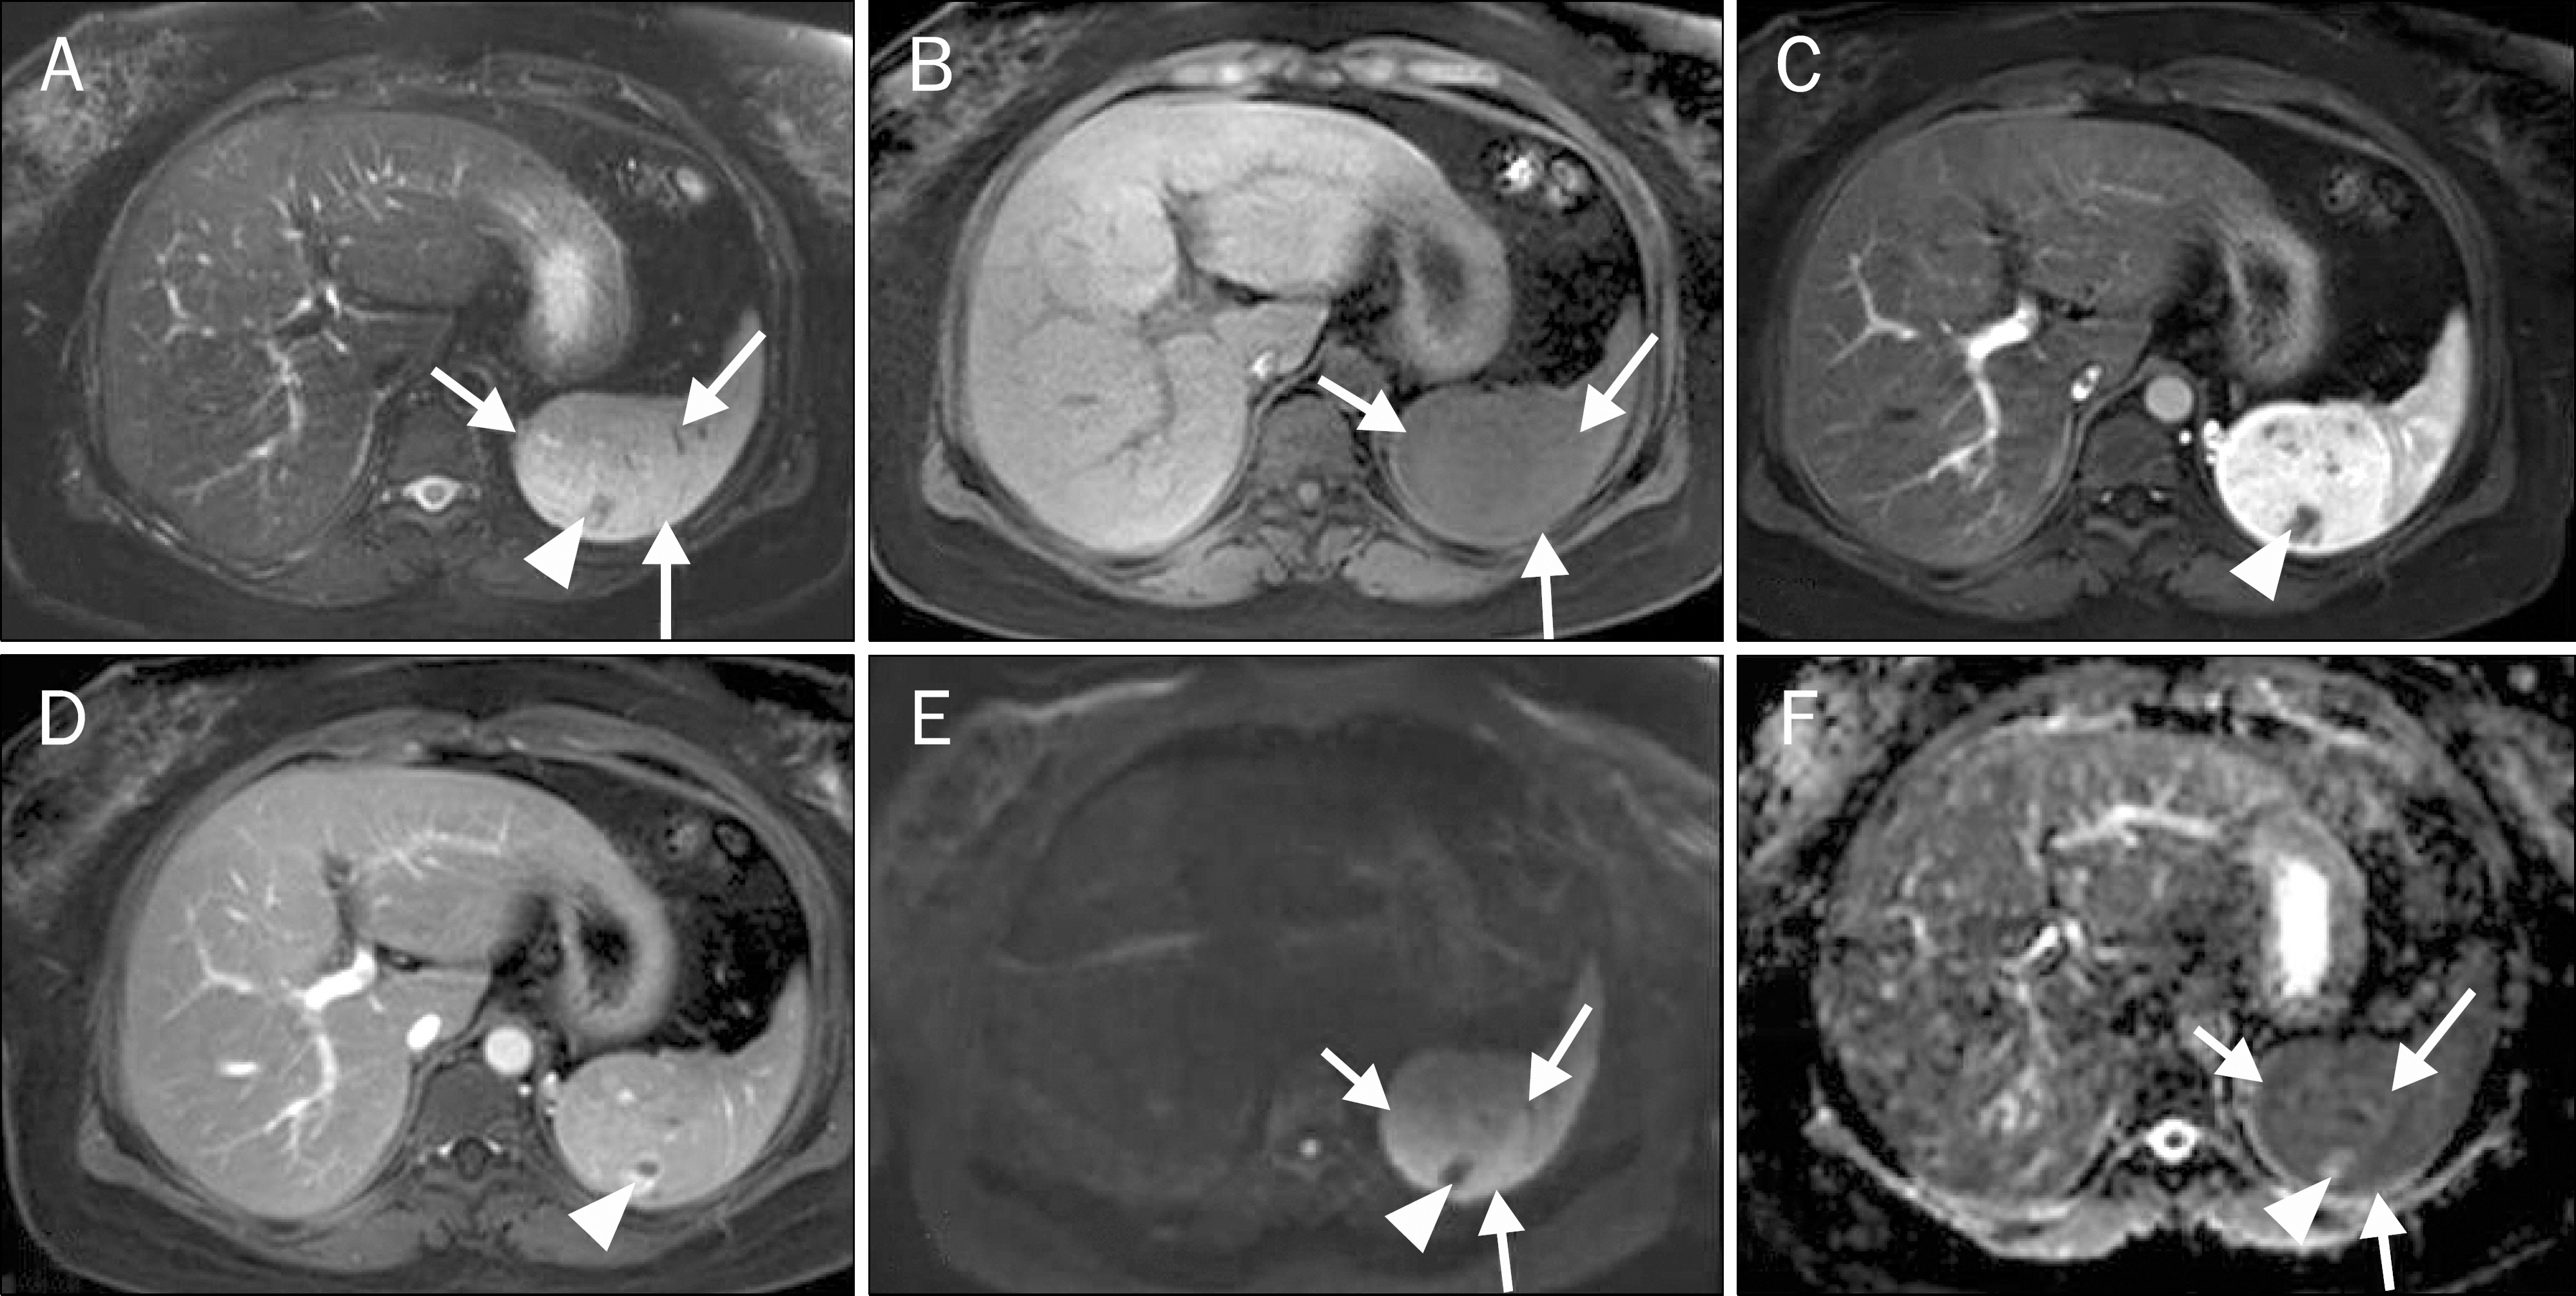
Fig. 2. Magnetic resonance images. The mass shows iso-signal compared to the splenic parenchyma on transverse fat saturated T2-weighted (A) and T1-weighted (B) images (arrows). Within the mass, focal areas of low signal are seen on T2-weighted image (A). The mass shows heterogenous enhancement on arterial phase (C) and demonstrates relatively homogenous enhancement to the same degree as that of the splenic parenchyma on delayed phase (D). One of the focal low signal areas depicted in A (arrowheads) shows lesser degree of enhancement compared to that of the mass on arterial phase (C), and delayed peripheral enhancement on delayed phase (D). The mass (arrows) shows high signal to the same degree as that of the splenic parenchyma on diffusion-weighted image (E) with corresponding low apparent diffusion coefficient value (F). One of the focal areas depicted in A (arrowheads) shows low signal on diffusion-weighted image (E) with corresponding high apparent diffusion coefficient value (F).
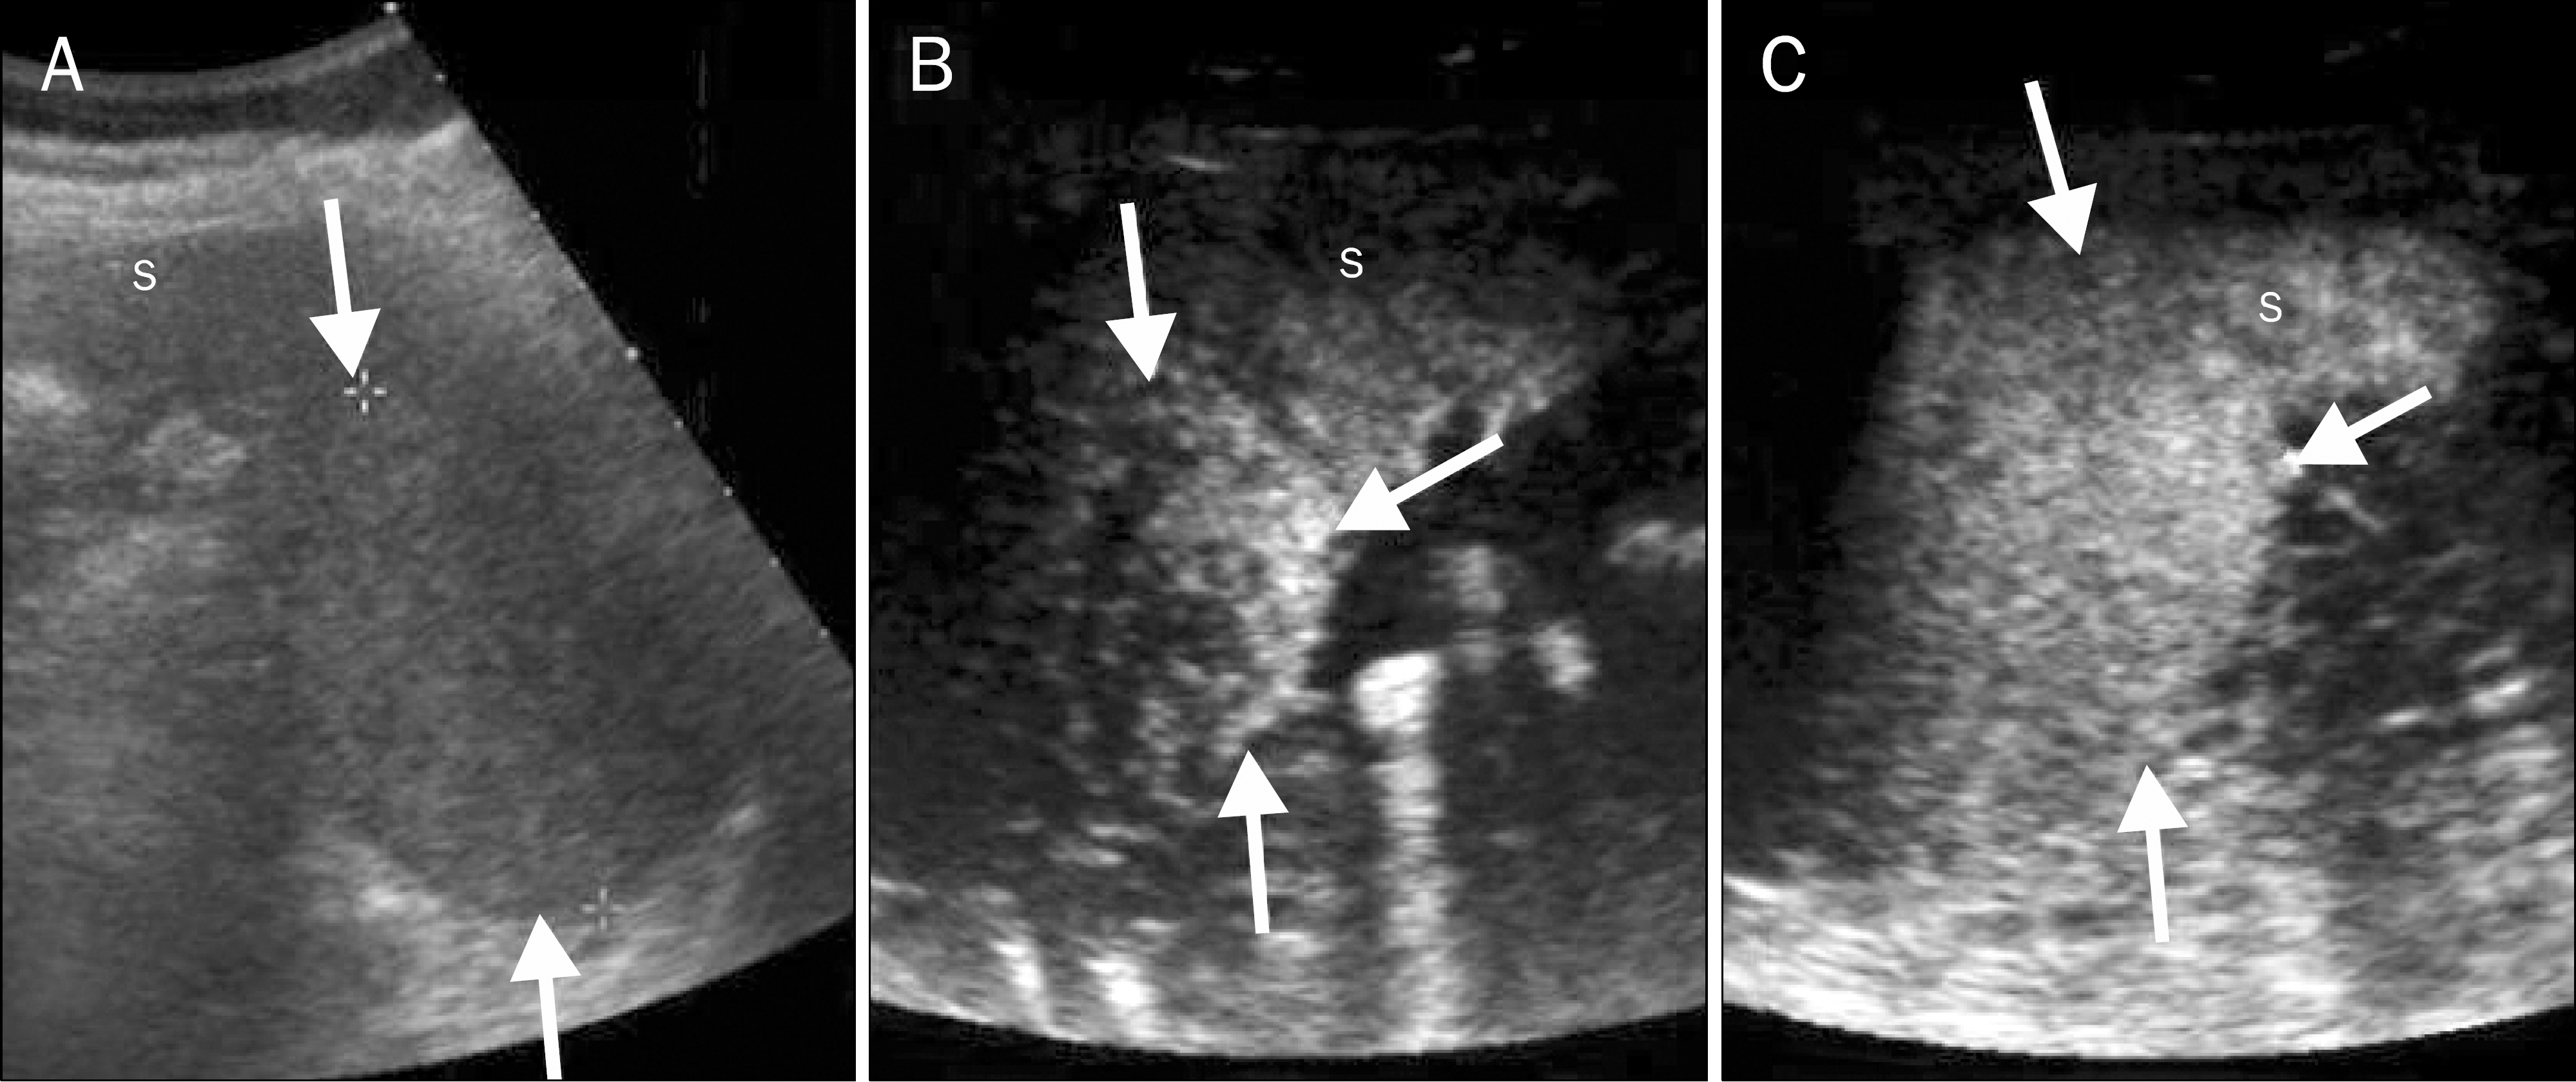
Fig. 3. B-mode ultrasonography and contrast-enhanced ultrasonography. (A) In upper pole of the spleen, a bulging-contoured hyperechoic mass is seen (arrows) on the transabdominal grayscale ultrasound image. (B) The mass shows avid hyperenhancement (arrows), compared to that of the splenic parenchyma (S) on the arterial phase image obtained 24 seconds after contrast agent injection. (C) The mass demonstrates homogenous enhancement (arrows) to the same degree as that of the splenic parenchyma on the portal venous phase image obtained 70 seconds after contrast agent injection.
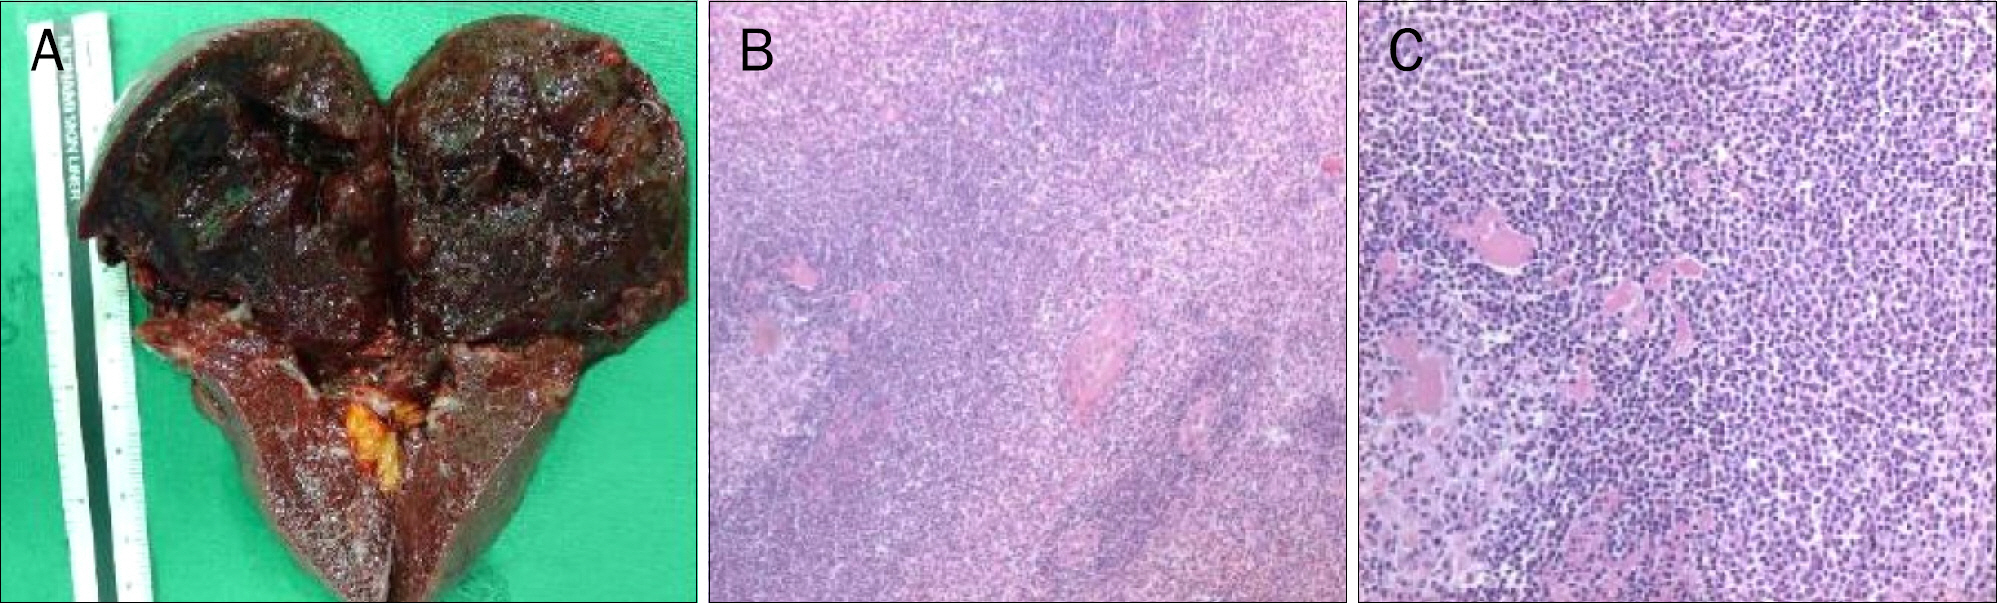
Fig. 4. Gross and pathological findings. (A) Gross pathologic examination reveals a 8.0×8.0×7.5 cm sized dark brownish mass in upper part of the spleen. (B) Histologic findings show disorganized vascular channels lined by plump endothelial cells (H&E, ×100), (C) which are surrounded by abundant uniform lymphocytes and macrophages (H&E, ×400).
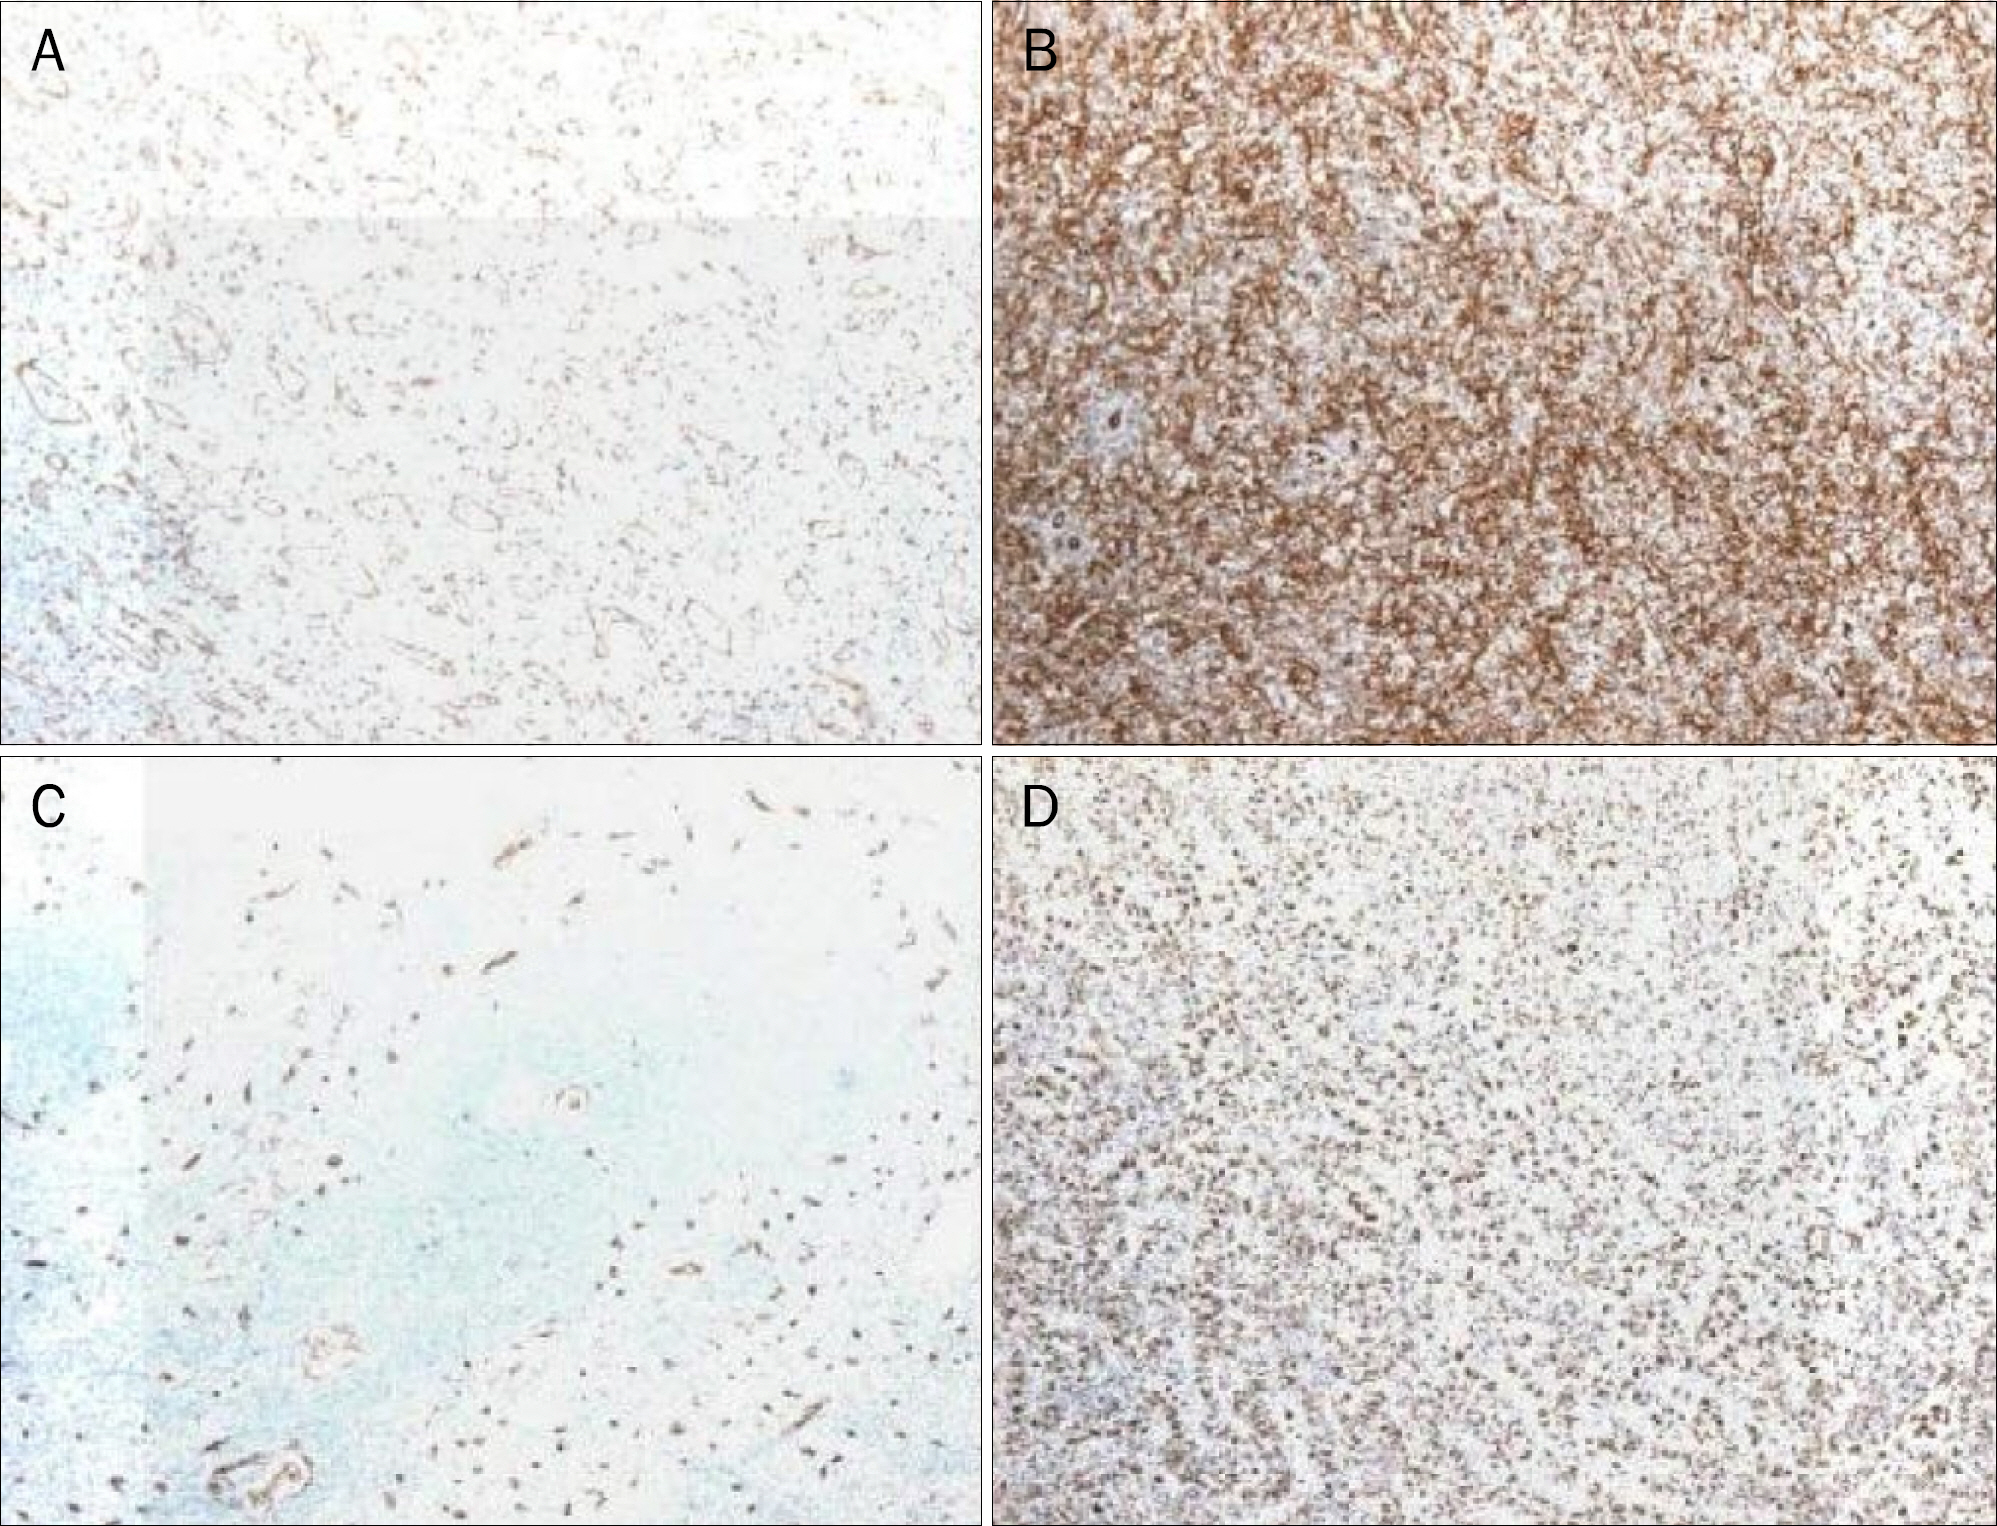
Fig. 5. Immunohistochemical staining. The sinuses are positive for CD8 (A, ×200) and CD31 (B, ×200). (C) The capillaries are positive for CD34(×200). (D) The macrophages are positive for CD68 (×200).
Reference
-
References
1. Kraus MD, Fleming MD, Vonderheide RH. The spleen as a diagnostic specimen: a review of 10 years' experience at two tertiary care institutions. Cancer. 2001; 91:2001–2009.2. Silverman ML, LiVolsi VA. Splenic hamartoma. Am J Clin Pathol. 1978; 70:224–229.
Article3. Ferguson ER, Sardi A, Beckman EN. Spontaneous rupture of splenic hamartoma. J La State Med Soc. 1993; 145:48–52.4. Koh YW, Lee H, Choi G, Kwon GY, Kim EJ, Huh J. Primary splenic vascular lesions: a clinicopathologic, immunophenotypic and radiopathologic correlation study of 40 cases. Korean J Pathol. 2010; 44:502–512.
Article5. Zukerberg LR, Kaynor BL, Silverman ML, Harris NL. Splenic hamartoma and capillary hemangioma are distinct entities: immunohistochemical analysis of CD8 expression by endothelial cells. Hum Pathol. 1991; 22:1258–1261.
Article6. Ali TZ, Beyer G, Taylor M, Volpe C, Papadimitriou JC. Splenic hamartoma: immunohistochemical and ultrastructural profile of two cases. Int J Surg Pathol. 2005; 13:103–111.
Article7. Wang JH, Ma XL, Ren FY, et al. Multi-modality imaging findings of splenic hamartoma: a report of nine cases and review of the literature. Abdom Imaging. 2013; 38:154–162.
Article8. Fernandez-Canton G, Capelastegui A, Merino A, Astigarraga E, Larena JA, Diaz-Otazu R. Atypical MRI presentation of a small splenic hamartoma. Eur Radiol. 1999; 9:883–885.
Article9. Stang A, Keles H, Hentschke S, et al. Incidentally detected splenic lesions in ultrasound: does contrast-enhanced ultrasonography improve the differentiation of benign hemangioma/ha- martoma from malignant lesions? Ultraschall Med. 2011; 32:582–592.10. Makino Y, Imai Y, Fukuda K, et al. Sonazoid-enhanced ultrasonography for the diagnosis of an intrapancreatic accessory spleen: a case report. J Clin Ultrasound. 2011; 39:344–347.
Article11. Chou YH, Chiou HJ, Tiu CM, Chiou SY, Hsia CY, Tsay SH. Splenic hamartoma: presentation on contrast-enhanced sonography. J Clin Ultrasound. 2004; 32:425–428.12. Gorg C. The forgotten organ: contrast enhanced sonography of the spleen. Eur J Radiol. 2007; 64:189–201.13. Stang A, Keles H, Hentschke S, et al. Differentiation of benign from malignant focal splenic lesions using sulfur hexa-fluoride-filled microbubble contrast-enhanced pulse-inversion sonography. AJR Am J Roentgenol. 2009; 193:709–721.
Article14. Yu X, Yu J, Liang P, Liu F. Real-time contrast-enhanced ultrasound in diagnosing of focal spleen lesions. Eur J Radiol. 2012; 81:430–436.
Article15. Caremani M, Occhini U, Caremani A, et al. Focal splenic lesions: US findings. J Ultrasound. 2013; 16:65–74.
Article
- Full Text Links
-
- Actions
-
Cited
- CITED
-
- Close
- Share
-
- Similar articles
-
- Invasive Ductal Carcinoma Arising within a Mammary Hamartoma: Case Report
- Biliary hamartoma presented as a single mass
- Contrast-enhanced ultrasonography of the liver using SonoVue
- Recent development of diagnostic imaging of hepatocellular carcinoma
- Benefits of contrast-enhanced ultrasonography for interventional procedures
