Quantitative CT assessment of bone mineral density in dogs with hyperadrenocorticism
- Affiliations
-
- 1Department of Medical Imaging, College of Veterinary Medicine, Chungbuk National University, Cheongju 28644, Korea. dwchang@cbnu.ac.kr
- 2Laboratory of Internal Medicine, College of Veterinary Medicine, Chungbuk National University, Cheongju 28644, Korea.
- 3Laboratory of Clinical Pathology, College of Veterinary Medicine, Chungbuk National University, Cheongju 28644, Korea.
- KMID: 2133637
- DOI: http://doi.org/10.4142/jvs.2015.16.4.531
Abstract
- Canine hyperadrenocorticism (HAC) is one of the most common causes of general osteopenia. In this study, quantitative computed tomography (QCT) was used to compare the bone mineral densities (BMD) between 39 normal dogs and 8 dogs with HAC (6 pituitary-dependent hyperadrenocorticism [PDH]; pituitary dependent hyperadrenocorticism, 2 adrenal hyperadrenocorticism [ADH]; adrenal dependent hyperadrenocorticism) diagnosed through hormonal assay. A computed tomogaraphy scan of the 12th thoracic to 7th lumbar vertebra was performed and the region of interest was drawn in each trabecular and cortical bone. Mean Hounsfield unit values were converted to equivalent BMD with bone-density phantom by linear regression analysis. The converted mean trabecular BMDs were significantly lower than those of normal dogs. ADH dogs showed significantly lower BMDs at cortical bone than normal dogs. Mean trabecular BMDs of dogs with PDH using QCT were significantly lower than those of normal dogs, and both mean trabecular and cortical BMDs in dogs with ADH were significantly lower than those of normal dogs. Taken together, these findings indicate that QCT is useful to assess BMD in dogs with HAC.
MeSH Terms
Figure
-
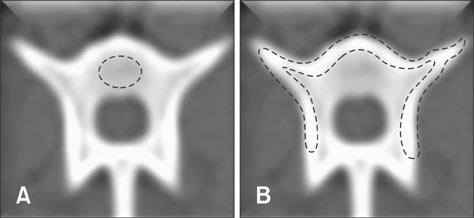
Fig. 1 Region of interest (ROI) selection for measuring Hounsfield units (HU) value at both trabecular bone (A) and cortical bone (B) of the 12th thoracic to 7th lumbar vertebra. An elliptical and manual trace of ROI that consisted exclusively of trabecular and cortical bone of the vertebral body, respectively, were drawn.
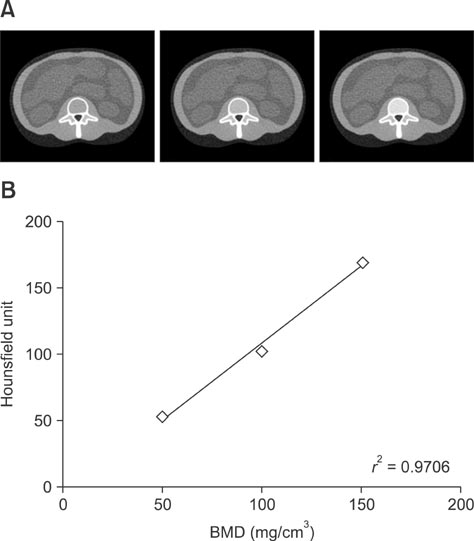
Fig. 2 The method of conversion of the Hounsfield units (HU) value to bone mineral density (BMD). Phantoms that contain known concentrations of calcium hydroxyapatite (from left to right 50, 100, 150 mg/cm3) were scanned with the same CT scan parameters (A). The mean and standard deviation of the HU values in ROI were measured within each calibration phantom image, after which measurements of the HU values were transformed into calcium hydroxyapatite concentration (mg/cm3) using the corresponding slope and the linear regression line (B).
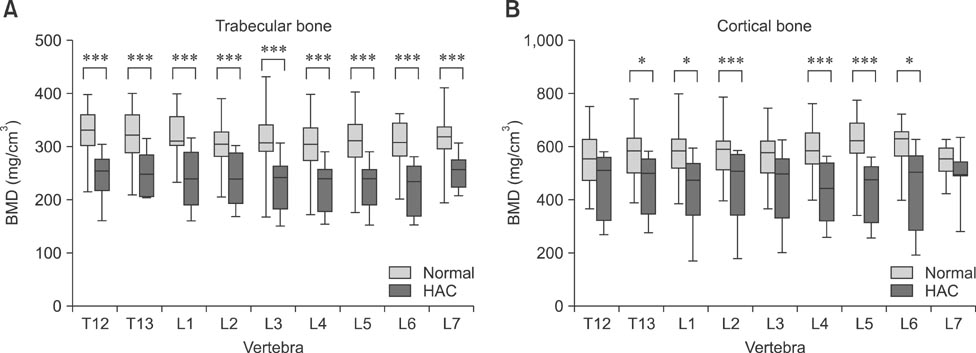
Fig. 3 Comparison of bone mineral density between normal and HAC dogs at trabecular and cortical bone. Box-and-whisker plots show significantly lower tBMDs of HAC patients than those of normal dogs (A). Significant differences were only observed in T13, L1, L2 L4, L5, and L6. The central boxes represent values from the lower to upper quartile (25th to 75th percentile). The middle line represents the median. Significant differences were determined by a t-test. *p < 0.05, **p < 0.01, ***p < 0.001.
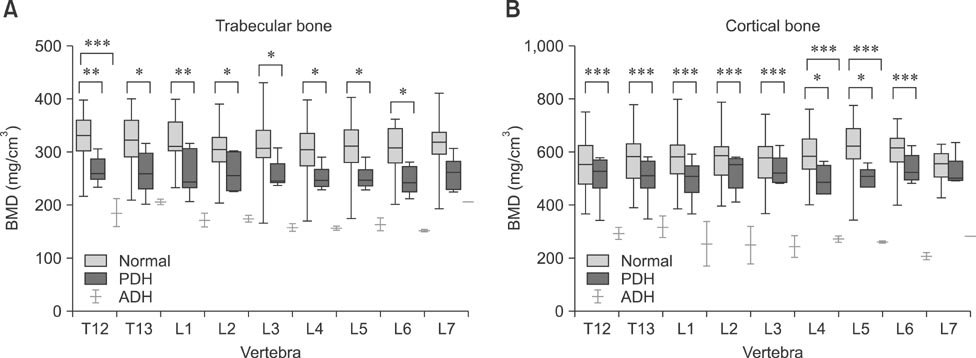
Fig. 4 Comparison of bone mineral density among each group with the same ages. Box-and-whisker plots show significantly lower tBMDs of hyperadrenocorticism (HAC) patients than those of normal dogs (A). There was no significant difference between the cBMD of normal and pituitary dependent hyperadrenocorticism (PDH) patients (B). However adrenal dependent hyperadrenocorticism (ADH) patients showed significantly lower cBMD values than normal patients. The central boxes represent values from the lower to the upper quartile (25th to 75th percentile). The middle line represents the median. Significant differences were determined by one way ANOVA. *p < 0.05, **p < 0.01, ***p < 0.001.
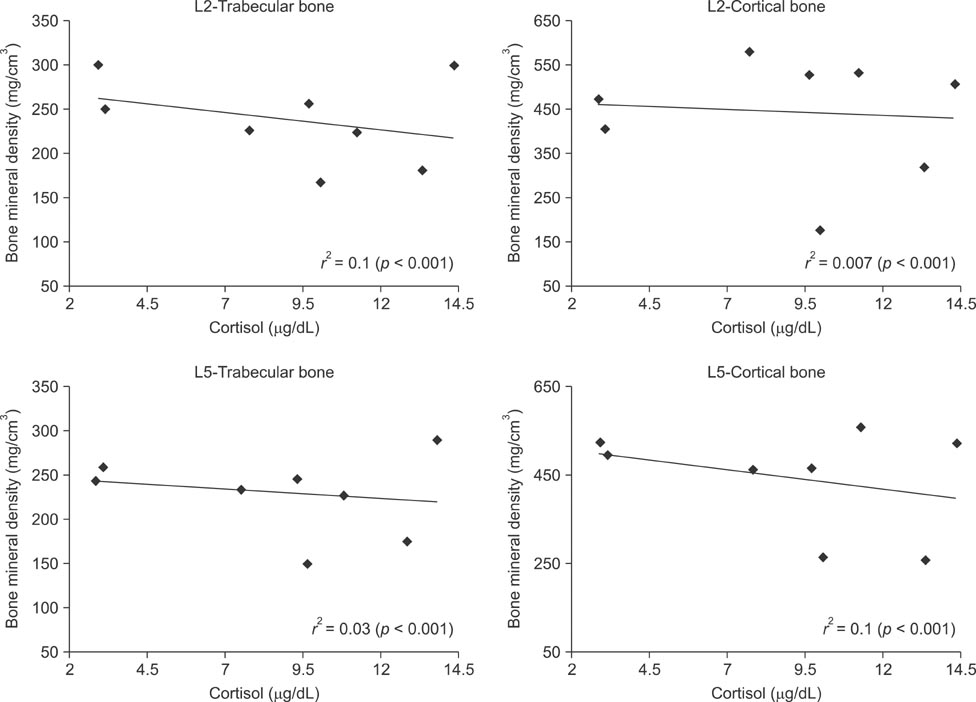
Fig. 5 Relationship between characteristics of cortisol concentration and bone mineral density at L2 and L5 among HAC dogs. Both L2 and L5 were selected as anatomical sites because they showed higher significant differences than any other sites. There were negative associations between cortisol concentration and bone mineral density of both trabecular and cortical bone at L2 and L5. Significant differences were determined by a t-test.
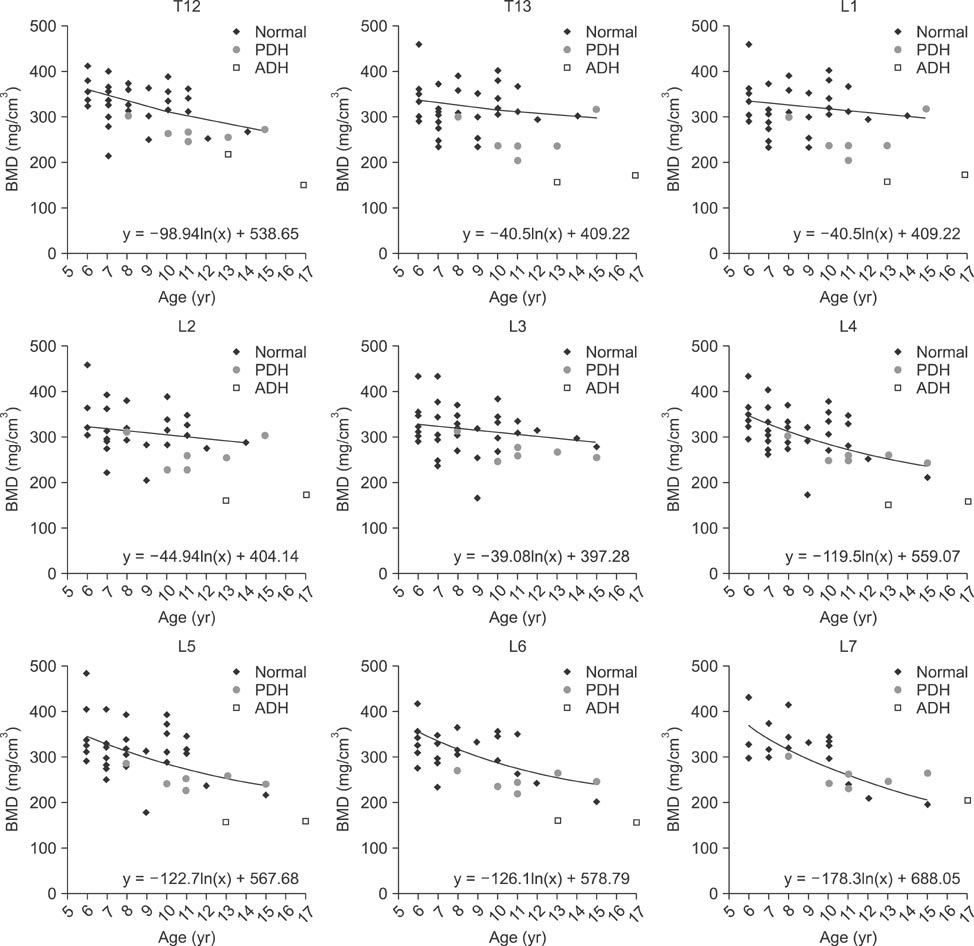
Fig. 6 Relationship between trabecular bone mineral densities (tBMDs) and chronological age among normal, PDH, and ADH patients at each vertebra. Predicted linear regression lines were developed and plotted along with scatter from actual data of tBMDs. The tBMDs-to age relationship was significant (R2 = 0.02-0.3, p < 0.01-0.001). The statistically negative correlation between trabecular bone mineral density and age was confirmed. In addition, scatterplots showed that the tBMDs of HAC patients were lower than those of normal patients.
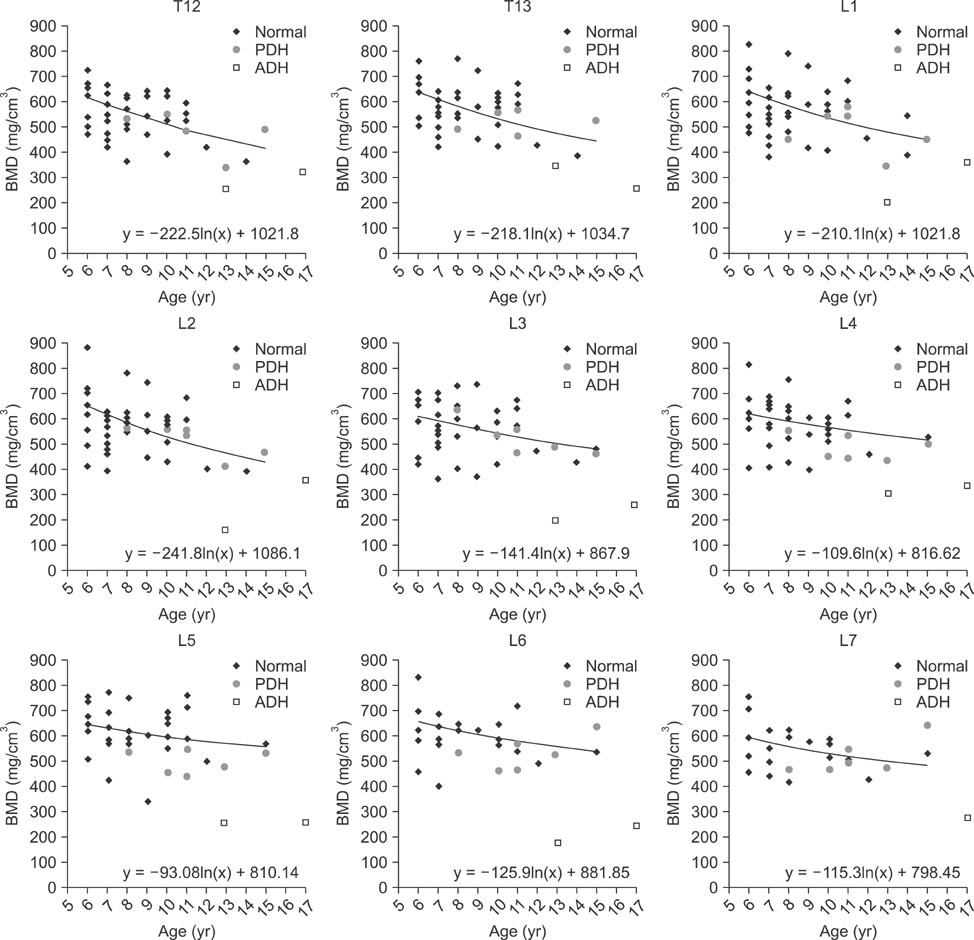
Fig. 7 Relationship between cortical bone mineral densities (cBMDs) and chronological age among normal, PDH, and ADH patients at each vertebra. Predicted linear regression lines were developed and plotted along with scatter from actual data of cBMDs. The cBMDs-to age relationship was significant (R2 = 0.02-0.12, p < 0.01-0.001). The statistically negative correlation between cortical bone mineral density and age was confirmed. Scatterplots also show that cBMDs of PDH patients were not significantly different from cBMDs of normal patients. However cBMDs of ADH patients are definitely different from those of normal patients.

Fig. 8 The percentage of trabecular bone mineral densities (tBMD) of HAC dogs compared with those of normal dogs. Linear regression equations obtained from scatter plots of normal BMDs were used to see if BMDs of HAC dogs were actually lower than those of normal dogs at the same ages, assuming normal values are 100%. The predicted age-adjusted tBMDs of PDH and ADH dogs were approximately 20% and 40% less than those of normal patients at each vertebra, respectively.

Fig. 9 The percentage of cortical bone mineral densities (cBMDs) of HAC dogs compared with that of normal dogs. Linear regression equations obtained from scatter plots of normal BMDs were used to see if BMDs of HAC dogs were actually lower than those of normal dogs at the same ages, assuming normal values are 100%. The predicted age-adjusted cBMDs of PDH patients were about 10% reduced and rather to be increased at L6 vertebra. However, the cBMDs of ADH patients were approximately 60% lower than those of normal dogs, and the difference between ADH and PDH patients at this site was quite evident.
Reference
-
1. Aerssens J, Boonen S, Joly J, Dequeker J. Variations in trabecular bone composition with anatomical site and age: potential implications for bone quality assessment. J Endocrinol. 1997; 155:411–421.
Article2. Ammann P, Rizzoli R. Bone strength and its determinants. Osteoporos Int. 2003; 14:Suppl 3. S13–S18.
Article3. Bae Y, Park S, Jeon S, Lee G, Choi J. Effect of region of interest and slice thickness on vertebral bone mineral density measured by use of quantitative computed tomography in dogs. Am J Vet Res. 2014; 75:642–647.
Article4. Bertagna C, Orth DN. Clinical and laboratory findings and results of therapy in 58 patients with adrenocortical tumors admitted to a single medical center (1951 to 1978). Am J Med. 1981; 71:855–875.
Article5. Bradley JG, Huang HK, Ledley RS. Evaluation of calcium concentration in bones from CT scans. Radiology. 1978; 128:103–107.
Article6. Braillon PM. Quantitative computed tomography precision and accuracy for long-term follow-up of bone mineral density measurement: a five year in vitro assessment. J Clin Densitom. 2002; 5:259–266.
Article7. Cann CE, Genant HK. Precise measurement of vertebral mineral content using computed tomography. J Comput Assist Tomogr. 1980; 4:493–500.
Article8. Cheon H, Choi W, Lee Y, Lee D, Kim J, Kang JH, Na K, Chang J, Chang D. Assessment of trabecular bone mineral density using quantitative computed tomography in normal cats. J Vet Med Sci. 2012; 74:1461–1467.
Article9. Dyson ED, Jackson CK, Whitehouse WJ. Scanning electron microscope studies of human trabecular bone. Nature. 1970; 225:957–959.
Article10. Ebbesen EN, Thomsen JS, Beck-Nielsen H, Nepper-Rasmussen HJ, Mosekilde L. Lumbar vertebral body compressive strength evaluated by dual-energy X-ray absorptiometry, quantitative computed tomography, and ashing. Bone. 1999; 25:713–724.
Article11. Faulkner KG, Glüer CC, Majumdar S, Lang P, Engelke K, Genant HK. Noninvasive measurements of bone mass, structure, and strength: current methods and experimental techniques. AJR Am J Roentgenol. 1991; 157:1229–1237.
Article12. Faulkner KG, Glüer CC, Grampp S, Genant HK. Crosscalibration of liquid and solid QCT calibration standards: corrections to the UCSF normative data. Osteoporos Int. 1993; 3:36–42.
Article13. Formica C, Loro ML, Gilsanz V, Seeman E. Inhomogeneity in body fat distribution may result inaccuracy in the measurement of vertebral bone mass. J Bone Miner Res. 1995; 10:1504–1511.
Article14. Füto L, Toke J, Patócs A, Szappanos A, Varga I, Gláz E, Tulassay Z, Rácz K, Tóth K. Skeletal differences in bone mineral area and content before and after cure of endogenous Cushing's syndrome. Osteoporos Int. 2008; 19:941–949.
Article15. Genant HK, Cann CE, Pozzi-Mucelli RS, Kanter AS. Vertebral mineral determination by quantitative CT: clinical feasibility and normative data. J Comput Assist Tomogr. 1983; 7:554.16. Gilsanz V, Perez FJ, Campbell PP, Dorey FJ, Lee DC, Wren TAL. Quantitative CT reference values for vertebral trabecular bone density in children and young adults. Radiology. 2009; 250:222–227.
Article17. Goldsmith NF, Johnston JO, Picetti G, Garcia C. Bone mineral in the radius and vertebral osteoporosis in an insured population. A correlative study using 125I photon absorption and miniature roentgenography. J Bone Joint Surg Am. 1973; 55:1276–1293.
Article18. Grampp S, Jergas M, Lang P, Steiner E, Fuerst T, Glüer CC, Mantur A, Genant HK. Quantitative CT assessment of the lumbar spine and radius in patients with osteoporosis. AJR Am Roentgenol. 1996; 167:133–140.
Article19. Hand MS, Zicker SC, Norvotny BJ. Feeding young adult dogs: before middle age and older. In : Hand MS, Zicker SC, Norvotny BJ, editors. Small Animal Clinical Nutrition Quick Consult. 1st ed. Topeka: Mark Morris Institute;2011. p. 1–4.20. Jergas M, Genant H. Current methods and recent advances in the diagnosis of osteoporosis. Arthritis Rheum. 1993; 36:1649–1662.
Article21. Kalender WA, Fischer M. Quality control and standardisation of absorptiometric and computer tomographic measurements of bone mineral mass and density. Radiat Prot Dosimetry. 1993; 49:229–233.
Article22. Lee JY, Kim KD, Park CS. Effect of the slice thickness and the size of region of interest on CT number. Korean J Oral Maxillofac Radiol. 2001; 31:85–91.23. Mancini T, Doga M, Mazziotti G, Giustina A. Cushing's syndrome and bone. Pituitary. 2004; 7:249–252.
Article24. Martin RK, Albright JP, Jee WS, Taylor GN, Clarke WR. Bone loss in the beagle tibia: influence of age, weight, and sex. Calcif Tissue Int. 1981; 33:233–238.
Article25. McCollough CH, Kaufmann RB, Cameron BM, Katz DJ, Sheedy PF 2nd, Peyser PA. Electron-beam CT: use of a calibration phantom to reduce variability in calcium quantitation. Radiology. 1995; 196:159–165.
Article26. Mei Z, Grummer-Strawn LM. Standard deviation of anthropometric Z-scores as a data quality assessment tool using the 2006 WHO growth standards: a cross country analysis. Bull World Health Organ. 2007; 85:441–448.
Article27. Minetto M, Reimondo G, Osella G, Ventura M, Angeli A, Terzolo M. Bone loss is more severe in primary adrenal than in pituitary-dependent Cushing's syndrome. Osteoporos Int. 2004; 15:855–861.
Article28. Norrdin RW, Carpenter TR, Hamilton BF, Brewster RD. Trabecular bone morphometry in beagles with hyperadrenocorticism and adrenal adenomas. Vet Pathol. 1988; 25:256–264.
Article29. Park S, Oh J, Son KY, Cho KO, Choi J. Quantitative computed tomographic assessment of bone mineral density changes associated with administration of prednisolone or prednisolone and alendronate sodium in dogs. Am J Vet Res. 2015; 76:28–34.
Article30. Peloschek P, Grampp S. Vertebral fractures and osteoporosis. In : Cassar-Pullicino VN, Imhof H, editors. Spinal Trauma-An Imaging Approach. 1st ed. New York: Theime Medical;2006. p. 203–211.31. Ross PD, Davis JW, Epstein RS, Wasnich RD. Pre-existing fractures and bone mass predict vertebral fractures incidence in women. Ann Intern Med. 1991; 114:919–923.
Article32. Schneider S, Breit SM, Grampp S, Künzel WW, Liesegang A, Mayrhofer E, Zentek J. Comparative assessment of bone mineral measurements obtained by use of dual-energy X-ray absorptiometry, peripheral quantitative computed tomography, and chemical-physical analysis in femur of juvenile and adult dogs. Am J Vet Res. 2004; 65:891–900.
Article33. Schwarz T, Störk CK, Mellor D, Sullivan M. Osteopenia and other radiographic signs in canine hyperadrenocorticism. J Small Anim Pract. 2000; 41:491–495.
Article34. Steiger P, Block JE, Steiger S, Heuck AF, Friedlander A, Ettinger B, Harris ST, Glüer CC, Genant HK. Spinal bone mineral density measured with quantitative CT: effect of region of interest, vertebral level, and technique. Radiology. 1990; 175:537–543.
Article35. Suzuki S, Okumura H, Yamamuro T, Yamamoto I. Bone mineral measurement by CT apparatus with simultaneous use of reference phantom: error factor and clinical evaluation. J Bone Miner Metab. 1988; 6:18–25.
Article36. Theodorou DJ, Theodorou SJ, André MP, Kubota D, Weigert JM, Sartoris DJ. Quantitative computed tomography of spine: comparison of three-dimensional and two-dimensional imaging approaches in clinical practice. J Clin Densitom. 2001; 4:57–62.37. Van Berkum FNR, Birkenhäger JC, Zeelenberg J, Pols HAP, Birkenhäger-Frenkel DH, van Veen LCP, Trouerbach WT, Stijnen T. Noninvasive axial and peripheral assessment of bone mineral content: a comparison between osteoporotic women and normal subjects. J Bone Miner Res. 1989; 4:679–685.
Article38. Yoganandan N, Pintar FA, Stemper BD, Baisden JL, Aktay R, Shender BS, Paskoff G, Laud P. Trabecular bone density of male human cervical and lumbar vertebrae. Bone. 2006; 39:336–344.
Article39. Yuh I, Yamamoto I, Shigei M, Ohnaka Y, Takada M, Morita R. Vertebral bone mineral measurement: a comparative study between quantitative computed tomography and dual X-ray absorptiometry. J Bone Miner Metab. 1994; 12:27–31.
Article
- Full Text Links
-
- Actions
-
Cited
- CITED
-
- Close
- Share
-
- Similar articles
-
- Variation of canine vertebral bone architecture in computed tomography
- Can Dental Cone Beam Computed Tomography Assess Bone Mineral Density?
- Thromboelastographic evaluation in dogs with hyperadrenocorticism
- Change in bone mineral density according to aging in Korean women: Study of Using Quantitative Computerized Tomography
- Assessment of the Measurement Method of the Bone Mineral Density on Cu-Equivalent Image
