Water-Fat Imaging with Automatic Field Inhomogeneity Correction Using Joint Phase Magnitude Density Function at Low Field MRI
- Affiliations
-
- 1Department of Electrical Engineering, Kwangwoon University, Korea. cbahn@kw.ac.kr
- KMID: 2041228
- DOI: http://doi.org/10.13104/jksmrm.2011.15.1.57
Abstract
- PURPOSE
A new inhomogeneity correction method based on two-point Dixon sequence is proposed to obtain water and fat images at 0.35T, low field magnetic resonance imaging (MRI) system.
MATERIALS AND METHODS
Joint phase-magnitude density function (JPMF) is obtained from the in-phase and out-of-phase images by the two-point Dixon method. The range of the water signal is adjusted from the JPMF, and 3D inhomogeneity map is obtained from the phase of corresponding water volume. The 3D inhomogeneity map is used to correct the inhomogeneity field iteratively.
RESULTS
The proposed water-fat imaging method was successfully applied to various organs. The proposed 3D inhomogeneity correction algorithm provides good performances in overall multi-slice images.
CONCLUSION
The proposed water-fat separation method using JPMF is robust to field inhomogeneity. Three dimensional inhomogeneity map and the iterative inhomogeneity correction algorithm improve water and fat imaging substantially.
Keyword
MeSH Terms
Figure
-
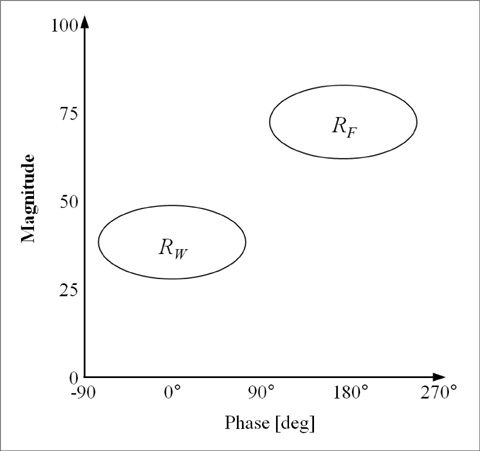
Fig. 1 A joint phase-magnitude density function for water-fat imaging is schematically shown, where RW and RF denote water and fat ranges, respectively.
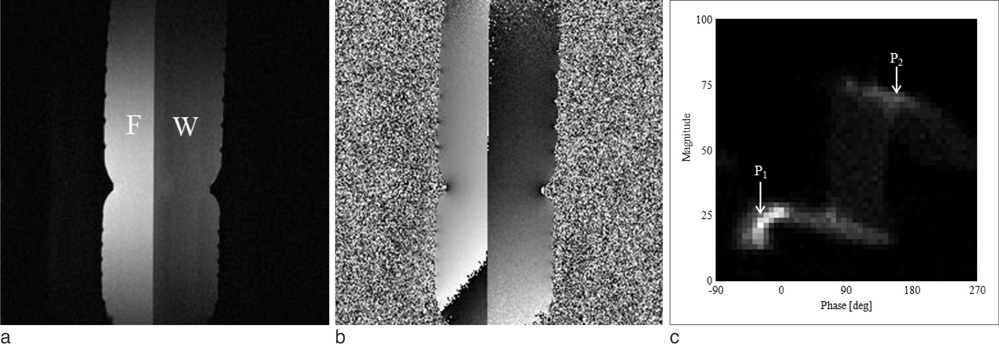
Fig. 2 Water-fat images and corresponding JPMF for a phantom. Magnitude in the in-phase image (a), phase in the out-of-phase image (b), and corresponding JPMF (c). Fat and water are denoted by "F" and "W", respectively in (a). A spin echo-based Dixon sequence was used with repetition time (TR) of 500 ms, and echo time (TE) of 26 ms. P1 and P2 in the JPMF denote the peak populations for water and fat.
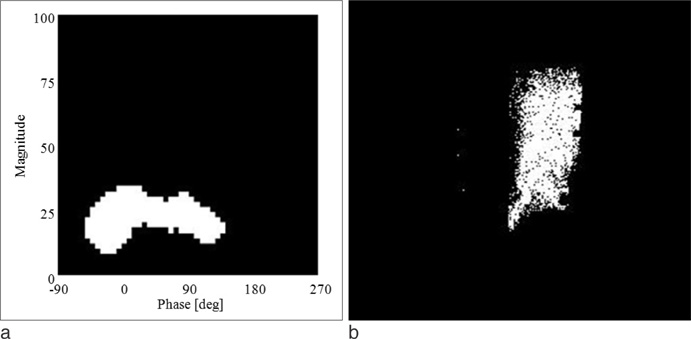
Fig. 3 Two dimensional range of water in the JPMF (a), and corresponding water region (b) in the phantom image shown in Fig. 2.
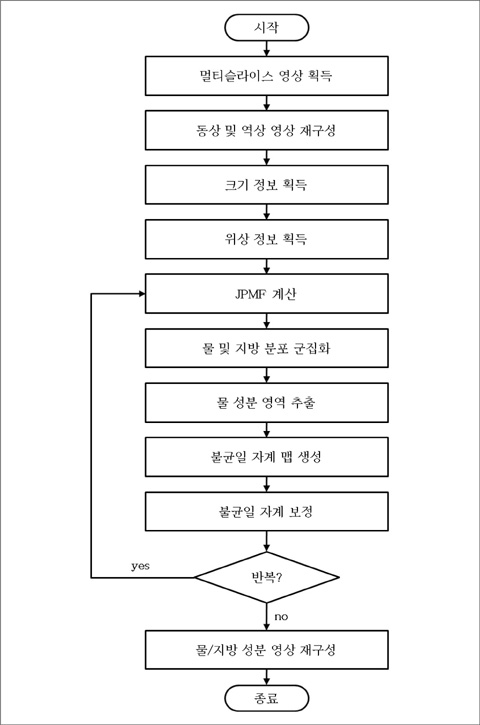
Fig. 4 Flow chart for the proposed water-fat imaging.
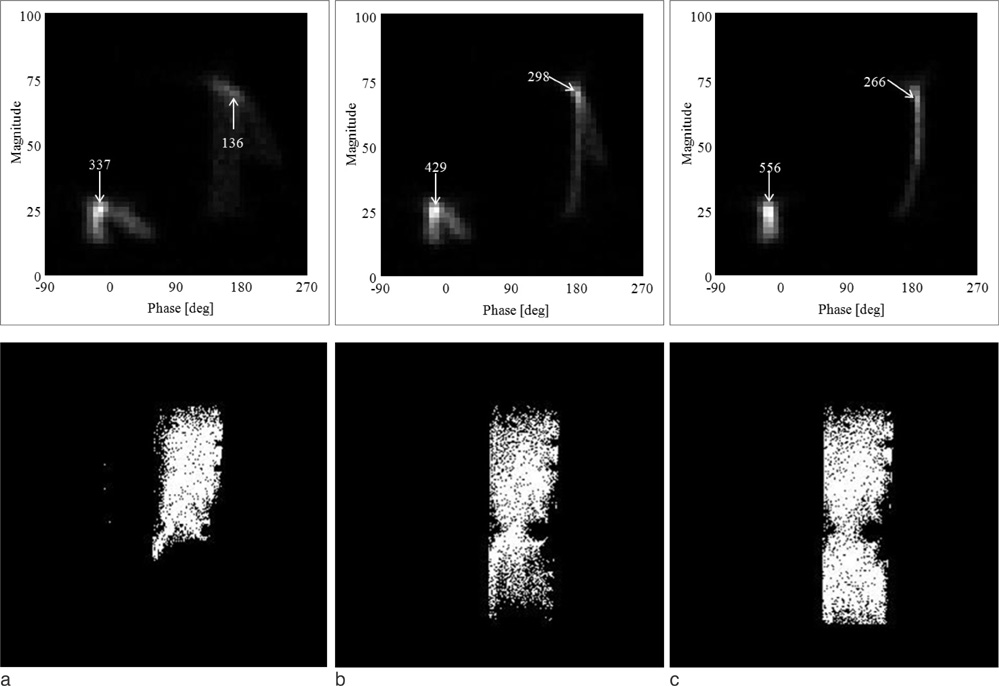
Fig. 5 Change of JPMF and corresponding water region as the number of iterations of the inhomogeneity correction increases. Numbers of iterations are 1(a), 2(b) and 3(c), respectively.
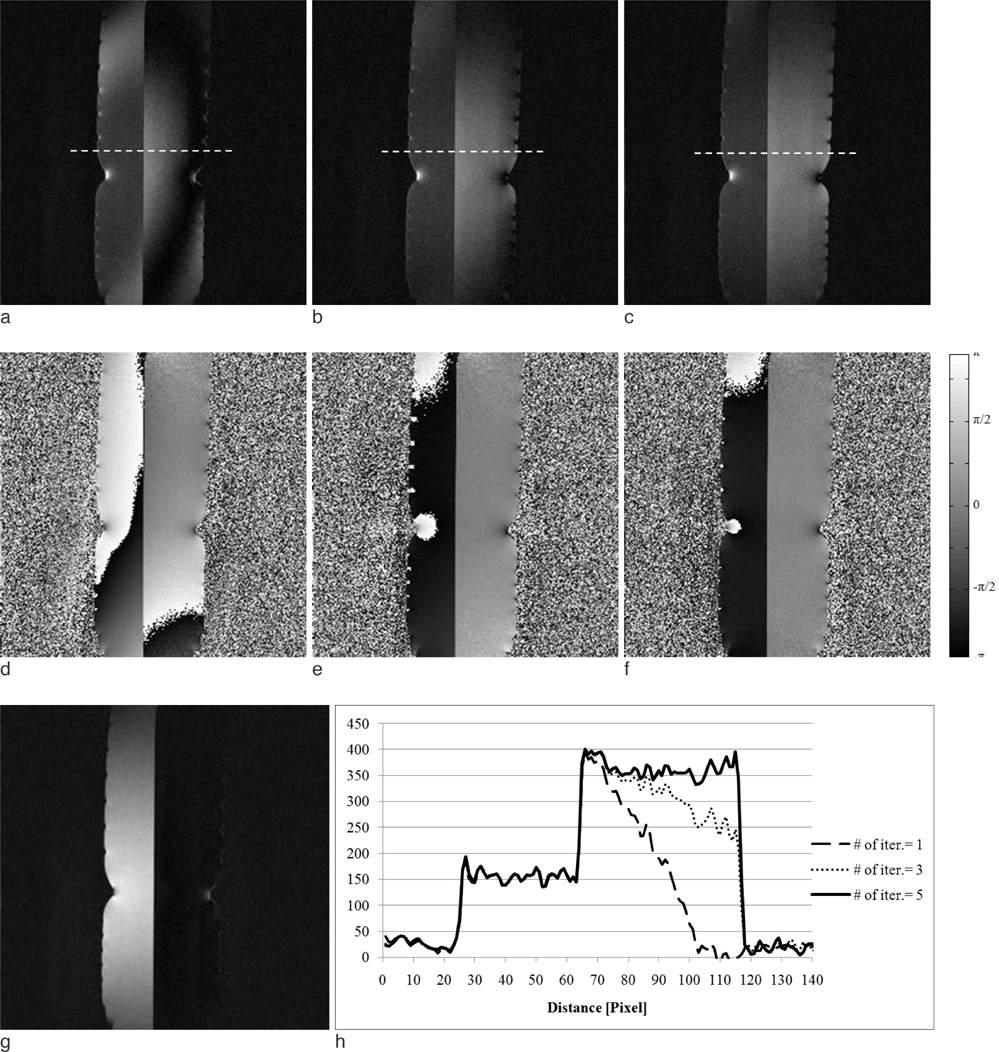
Fig. 6 Water images of the phantom with the number of iterations of the inhomogeneity correction are 1 (a), 3 (b), and 5 (c), respectively. Corresponding phase maps are shown in (d), (e), and (f), respectively. Fat image of the phantom after inhomogeneity correction (iteration number of 5) is shown in (g). The intensity profiles of the water images along the broken lines are shown in (h).
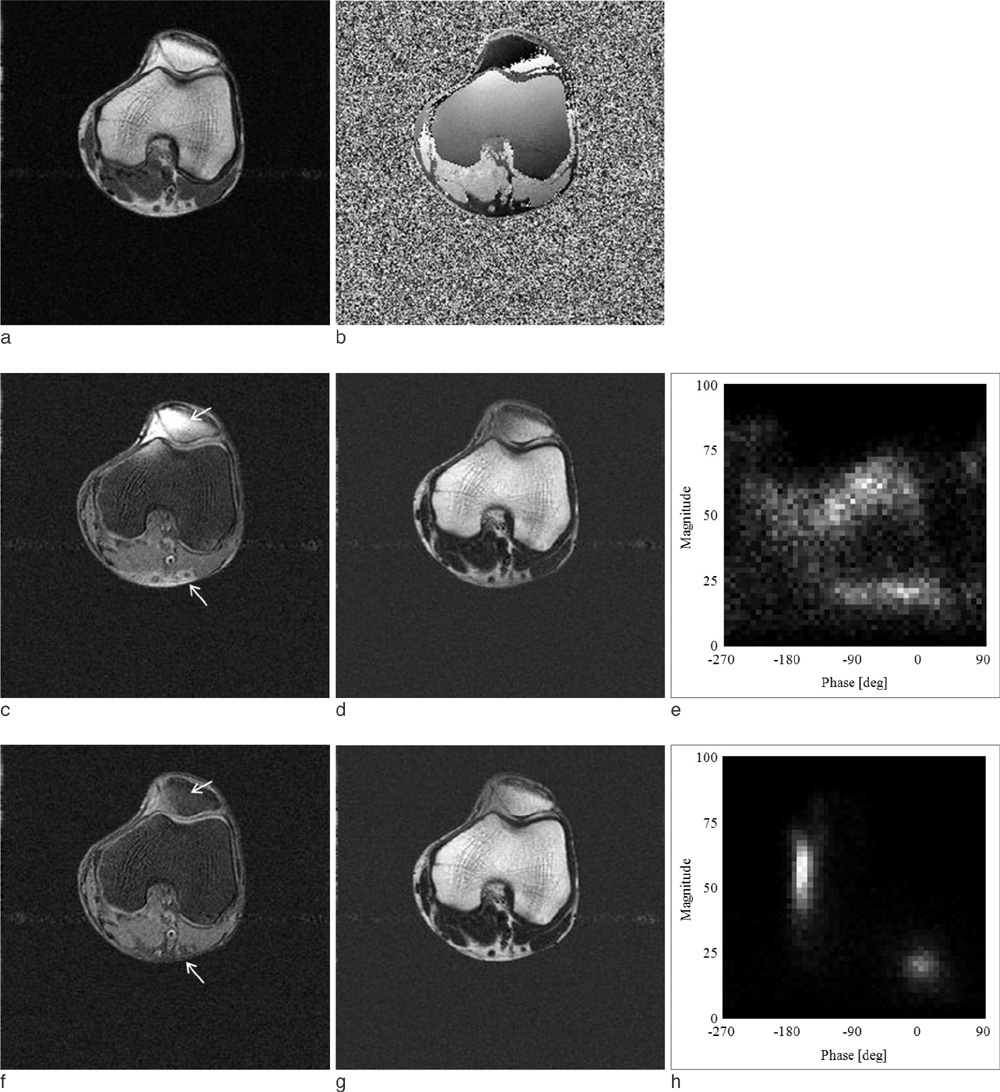
Fig. 7 In-vivo axial knee images of a volunteer. Magnitude of the in-phase image (a), phase of the out-of-phase image (b) obtained by a spin echo sequence at 0.35 T(TR=500 ms, TE=25 ms, FOV=230 mm, spatial resolution= 0.89 mm, flip angle (FA)=90°, slice thickness= 8 mm). Water image, fat image, and corresponding JPMF are shown in (c), (d), and (e), respectively before the inhomogeneity correction. Water image, fat image, and corresponding JPMF after the proposed inhomogeneity correction are shown in (f), (g) and (h), respectively. The number of iterations for inhomogeneity correction was 5. Note the improvements in the water images especially in the regions shown by the arrows.
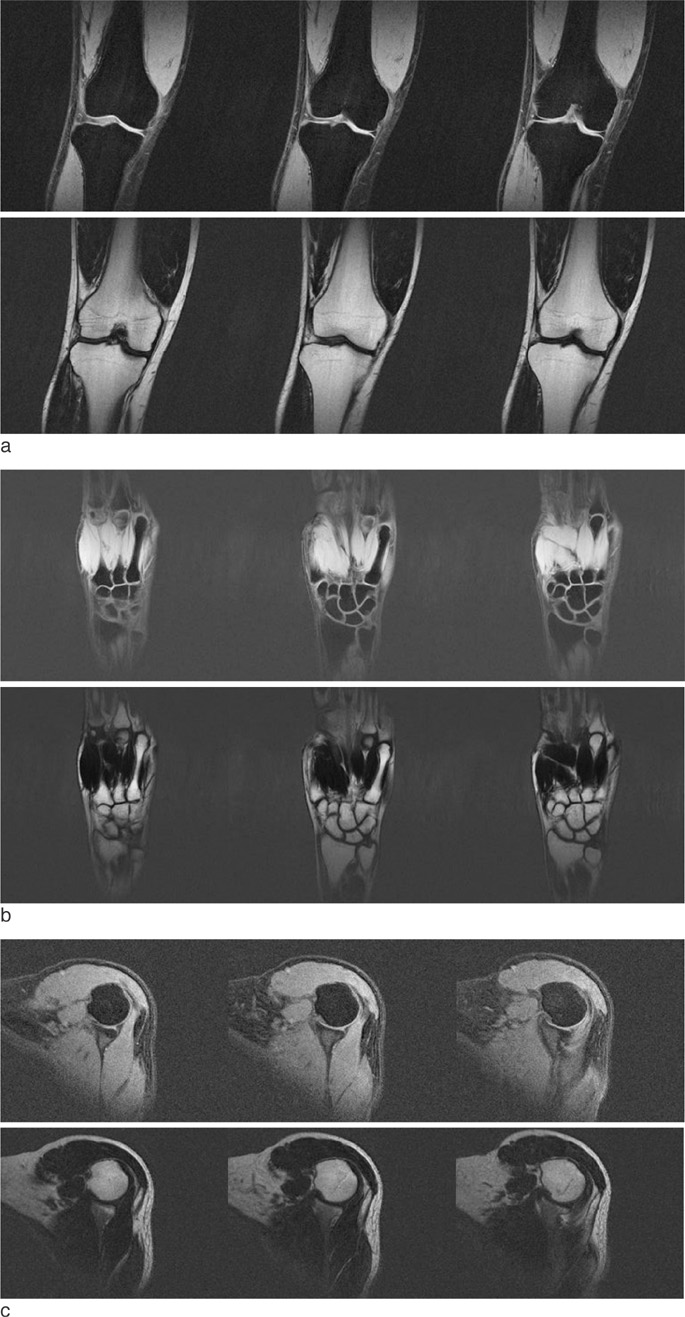
Fig. 8 In-vivo multi-slice water (top) and fat (bottom) images of knee (a), hand (b), and shoulder (c) of volunteers are shown. They are obtained by a gradient echo-based Dixon sequence at 0.35T. The repetition time was 500 ms, TE for the out-of-phase and in-phase imaging was 9.8 ms and 19.6 ms, respectively. Other imaging parameters are: FOV=250 mm, FA=60°, Thickness=5 mm, spatial Resolution=0.97 mm (a); FOV=230 mm, FA=60°, Thickness=3 mm, spatial Resolution=0.89 mm (b); FOV=250 mm, FA=60°, Thickness=5 mm, spatial Resolution=0.97 mm (c).
Reference
-
1. Emmanuelle M, Javier B, Glyn J, Jean R, Xavier M, Anne C. Fat suppression in MR imaging: techniques and pitfalls. Radiographics. 1999. 19:373–382.2. Hussain HK, Chenevert TL, Londy FJ, et al. Hepatic fat fraction: MR imaging for quantitative measurement and display-early experience. Radiology. 2005. 236:1048–1055.3. Guiu B, Petit JM, Loffroy R, et al. Quantification of liver fat content: comparison of triple-echo chemical shift gardient-echo imaging and in vivo proton MR spectroscopy. Radiology. 2009. 250:95–102.4. O'Regan DP, Callaghan MF, Wylezinska-Arridge M, et al. Liver fat content and T2*: simultaneous measurement by using breath-hold multiecho MR imaging at 3T-feasibility. Radiology. 2008. 247:550–557.5. Kellman P, Hernando D, Shah S, et al. Multiecho dixon fat and water separation method for detecting fibrofatty infiltration in the myocardium. Magn Reson Med. 2009. 61:215–221.6. Hu HH, Kim HW, Nayak KS, et al. Comparison of fat-water MRI and single-voxel MRS in the assessment of hepatic and pancreatic fat fractions in humans. Obesity. 2010. 18:841–847.7. Keller PJ, Hunter WW Jr, Schmalbrock P. Multisection fat-water imaging with chemical shift selection presaturation. Radiology. 1987. 164:539–541.8. Bydder GM, Young IR. MR imaging: clinical use of the inversion-recovery sequence. J Comput Assist Tomogr. 1985. 9:659–675.9. Dixon WT. Simple proton spectroscopic imaging. Radiology. 1984. 153:189–194.10. Glover GH, Schneider E. Three-point Dixon Technique for true water/fat decomposition with B0 inhomogeneity correction. Magn Reson Med. 1991. 18:371–383.11. Glover GH. Multipoint dixon technique for true water and fat proton and susceptibility imaging. J Magn Reson Imaging. 1991. 1:521–530.12. Skinner TE, Glover GH. An extended two-point Dixon algorithm for calculating separate water, fat, and B0 images. Magn Reson Med. 1997. 37:628–630.13. Coombs BD, Szumowski J, Coshow W. Two-points Dixon technique for water-fat signal decomposition with B0 inhomogeneity correction. Magn Reson Med. 1997. 38:884–889.14. Ghiglia DC, Pritt MD. Two-dimensional phase unwrapping: theory, algorithm, and software. 1998. New York: John Wiley & Sons.15. Ma J. Breath-hold water and fat imaging using a dual-echo two-point Dixon technique with an efficient and robust phase-correction algorithm. Magn Reson Med. 2004. 52:415–419.16. Schmidt MA, Fraser KM. Two-point Dixon fat-water separation: improving reliability and accuracy in phase correction algorithm. JMRI. 2008. 27:1122–1129.17. Pruessmann KP, et al. SENSE: sensitivity encoding for fast MRI. Magn Reson Med. 1999. 42:952–962.18. Ahn CB, Jo JM, Cho ZH. Magnetic field homogeneity correction algorithm using pseudoinversion formula for NMR imaging. Rev Sci Instrum. 1986. 57(4):683–688.19. Irarrazabal P, Meyer CH, Nishimura DG, Macovski A. Inhomogeneity correction using an estimated linear field map. Magn Reson Med. 1996. 35:278–282.20. Bernstein MA, King KF, Zhou XJ. Handbook of MRI Pulse Sequence. 2004. New York: Elsevier.21. Reeder SB, Wen Z, Yu H, et al. Multicoil Dixon chemical species separation with an iterative least-squares estimation method. Magn Reson Med. 2004. 51:35–45.
- Full Text Links
-
- Actions
-
Cited
- CITED
-
- Close
- Share
-
- Similar articles
-
- Simultaneous Unwrapping Phase and Error Recovery from Inhomogeneity (SUPER) for Quantitative Susceptibility Mapping of the Human Brain
- Higher Order Shimming for Ultra-fast Spiral-Scan Imaging at 3 Tesla MRI System
- Background Gradient Correction using Excitation Pulse Profile for Fat and T2* Quantification in 2D Multi-Slice Liver Imaging
- Estimation of Inhomogeneity Correction Factor in Small Field Dosimetry
- Treatment Planning Correction Using MRI in the Radiotherapy of Cervical Cancer
