Comparison of Parametric and Bootstrap Method in Bioequivalence Test
- Affiliations
-
- 1Department of Pharmacology, College of Medicine, The Catholic University of Korea, Seoul 137-701, Korea. yimds@catholic.ac.kr
- KMID: 1982570
- DOI: http://doi.org/10.4196/kjpp.2009.13.5.367
Abstract
- The estimation of 90% parametric confidence intervals (CIs) of mean AUC and Cmax ratios in bioequivalence (BE) tests are based upon the assumption that formulation effects in log-transformed data are normally distributed. To compare the parametric CIs with those obtained from nonparametric methods we performed repeated estimation of bootstrap-resampled datasets. The AUC and Cmax values from 3 archived datasets were used. BE tests on 1,000 resampled datasets from each archived dataset were performed using SAS (Enterprise Guide Ver.3). Bootstrap nonparametric 90% CIs of formulation effects were then compared with the parametric 90% CIs of the original datasets. The 90% CIs of formulation effects estimated from the 3 archived datasets were slightly different from nonparametric 90% CIs obtained from BE tests on resampled datasets. Histograms and density curves of formulation effects obtained from resampled datasets were similar to those of normal distribution. However, in 2 of 3 resampled log (AUC) datasets, the estimates of formulation effects did not follow the Gaussian distribution. Bias-corrected and accelerated (BCa) CIs, one of the nonparametric CIs of formulation effects, shifted outside the parametric 90% CIs of the archived datasets in these 2 non-normally distributed resampled log (AUC) datasets. Currently, the 80~125% rule based upon the parametric 90% CIs is widely accepted under the assumption of normally distributed formulation effects in log-transformed data. However, nonparametric CIs may be a better choice when data do not follow this assumption.
Figure
-
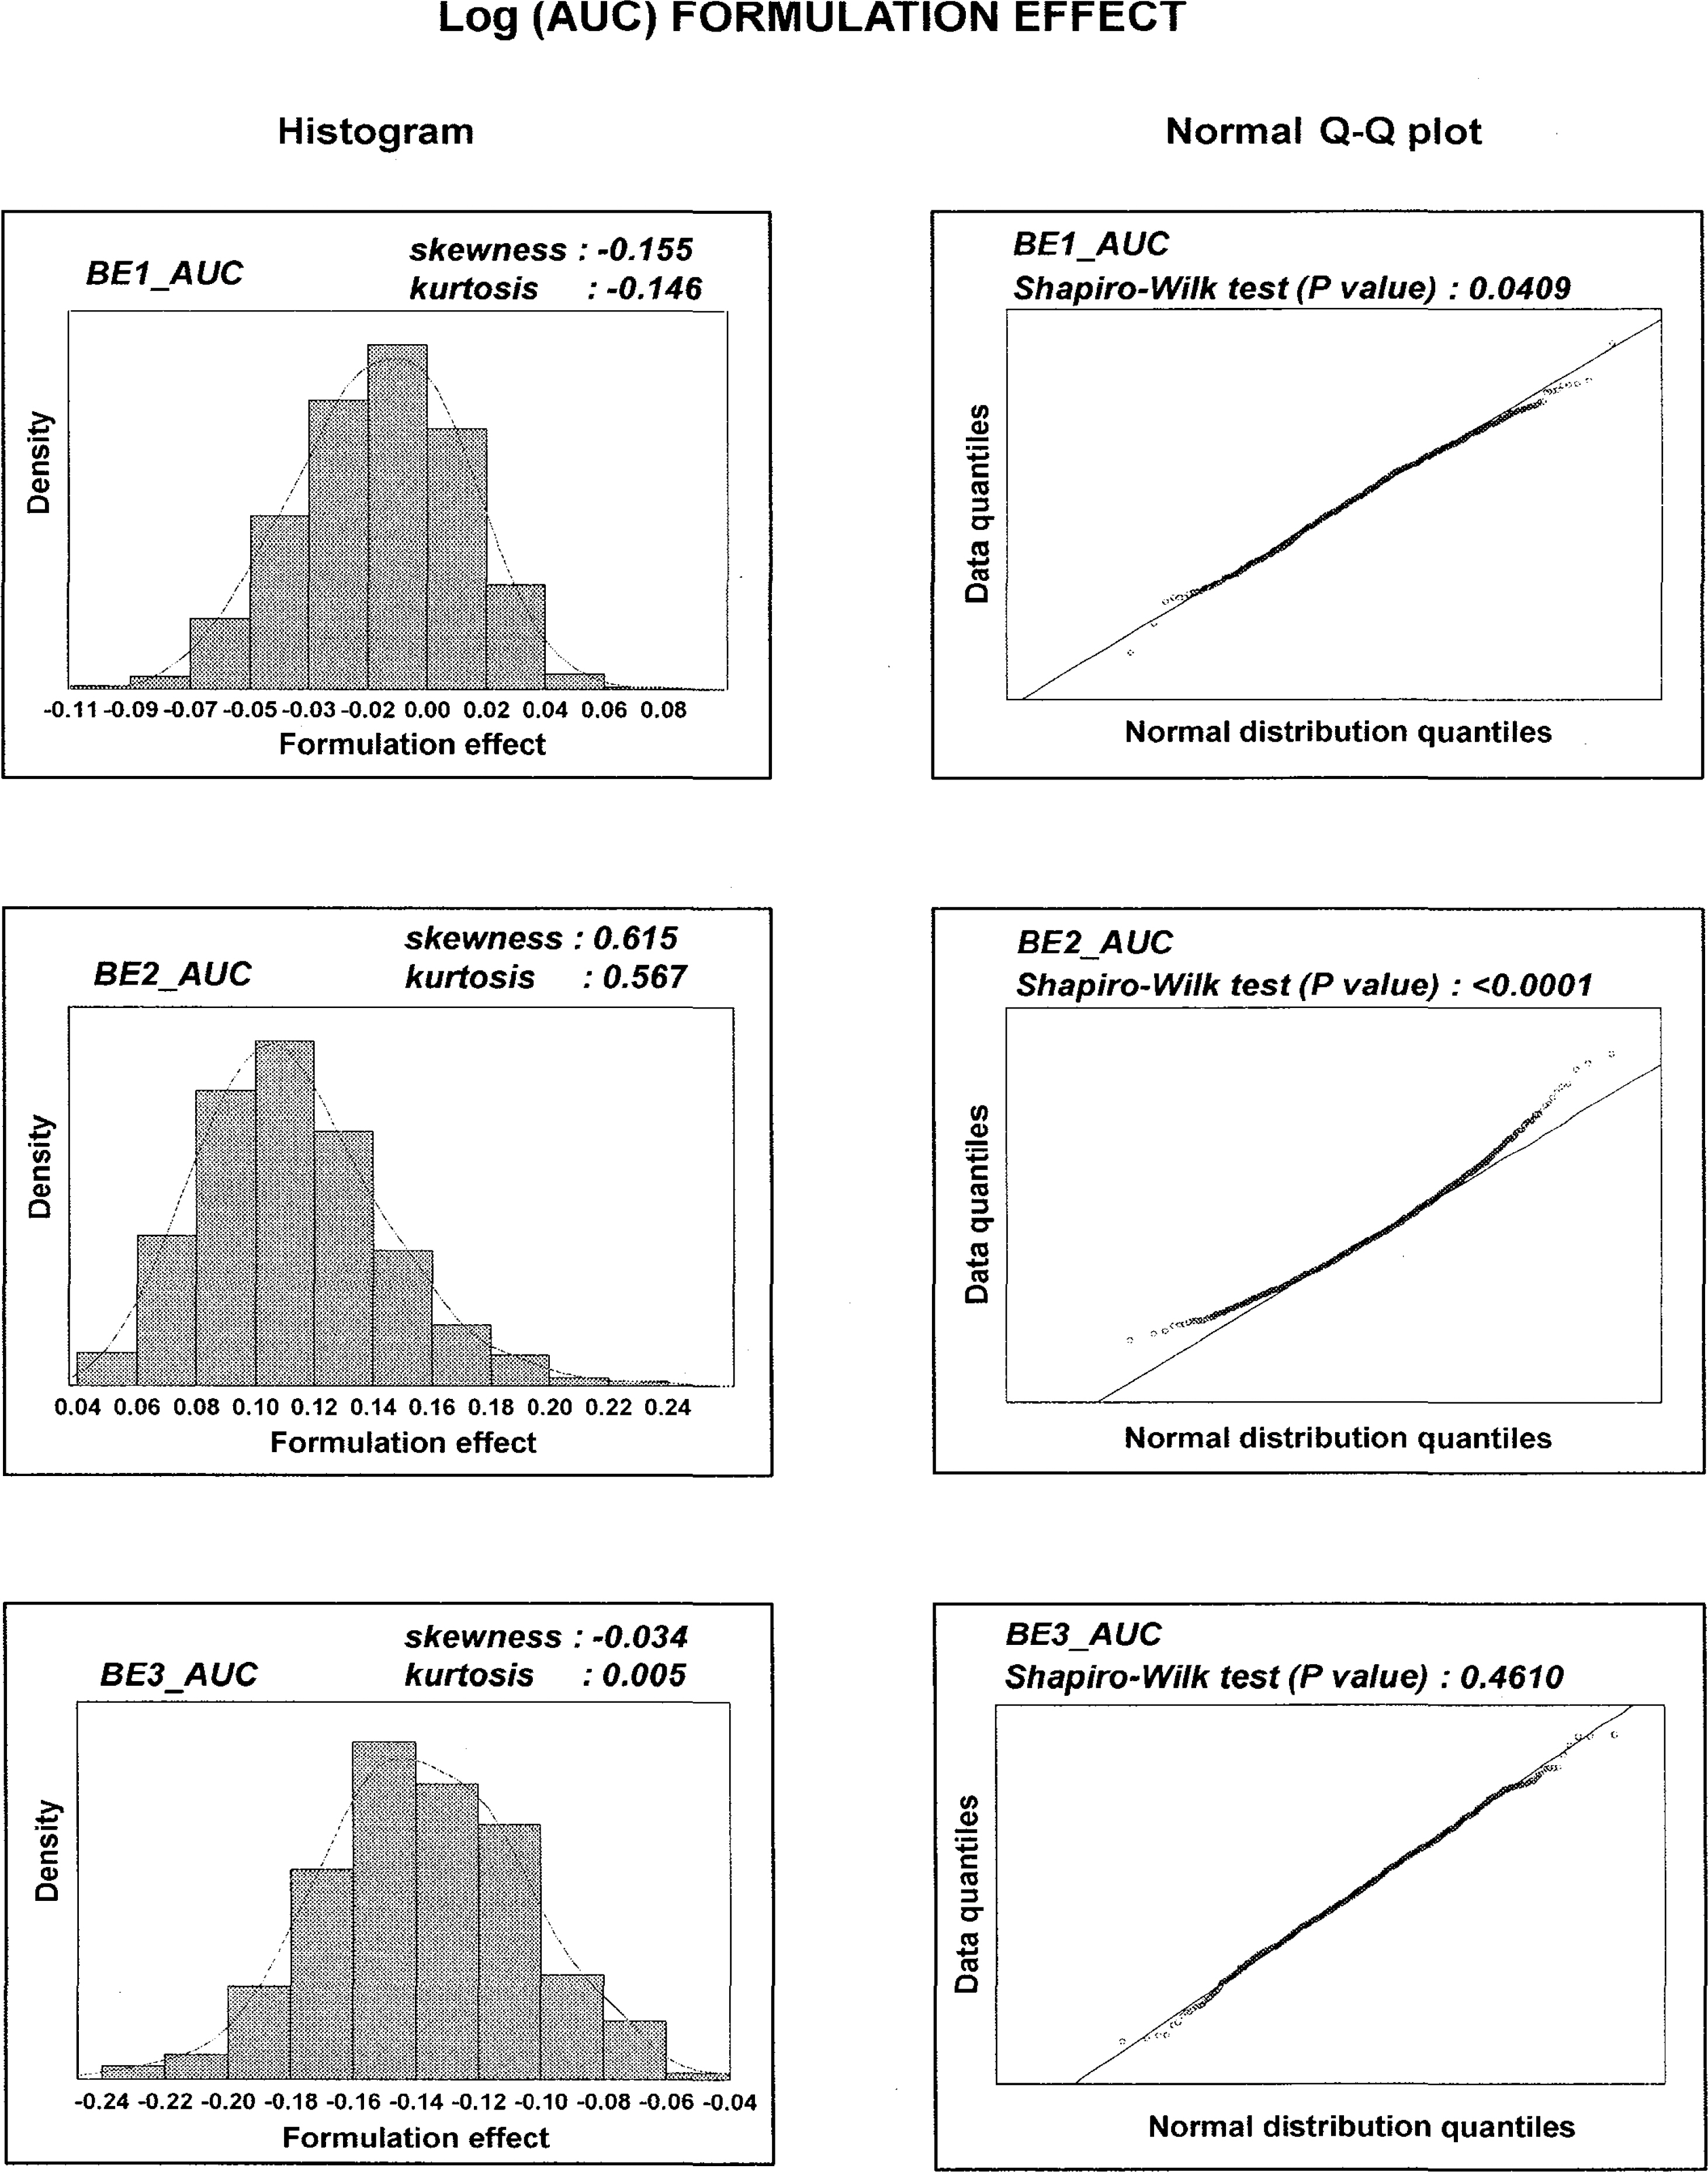
Fig. 1. Histograms and normal Q-Q plots with skewness, kurtosis and Shapiro-Wilk test results showing the distribution of formulation effects (mean differences in log (AUC)s between test and reference formulation) estimates in bootstrap-resampled datasets.
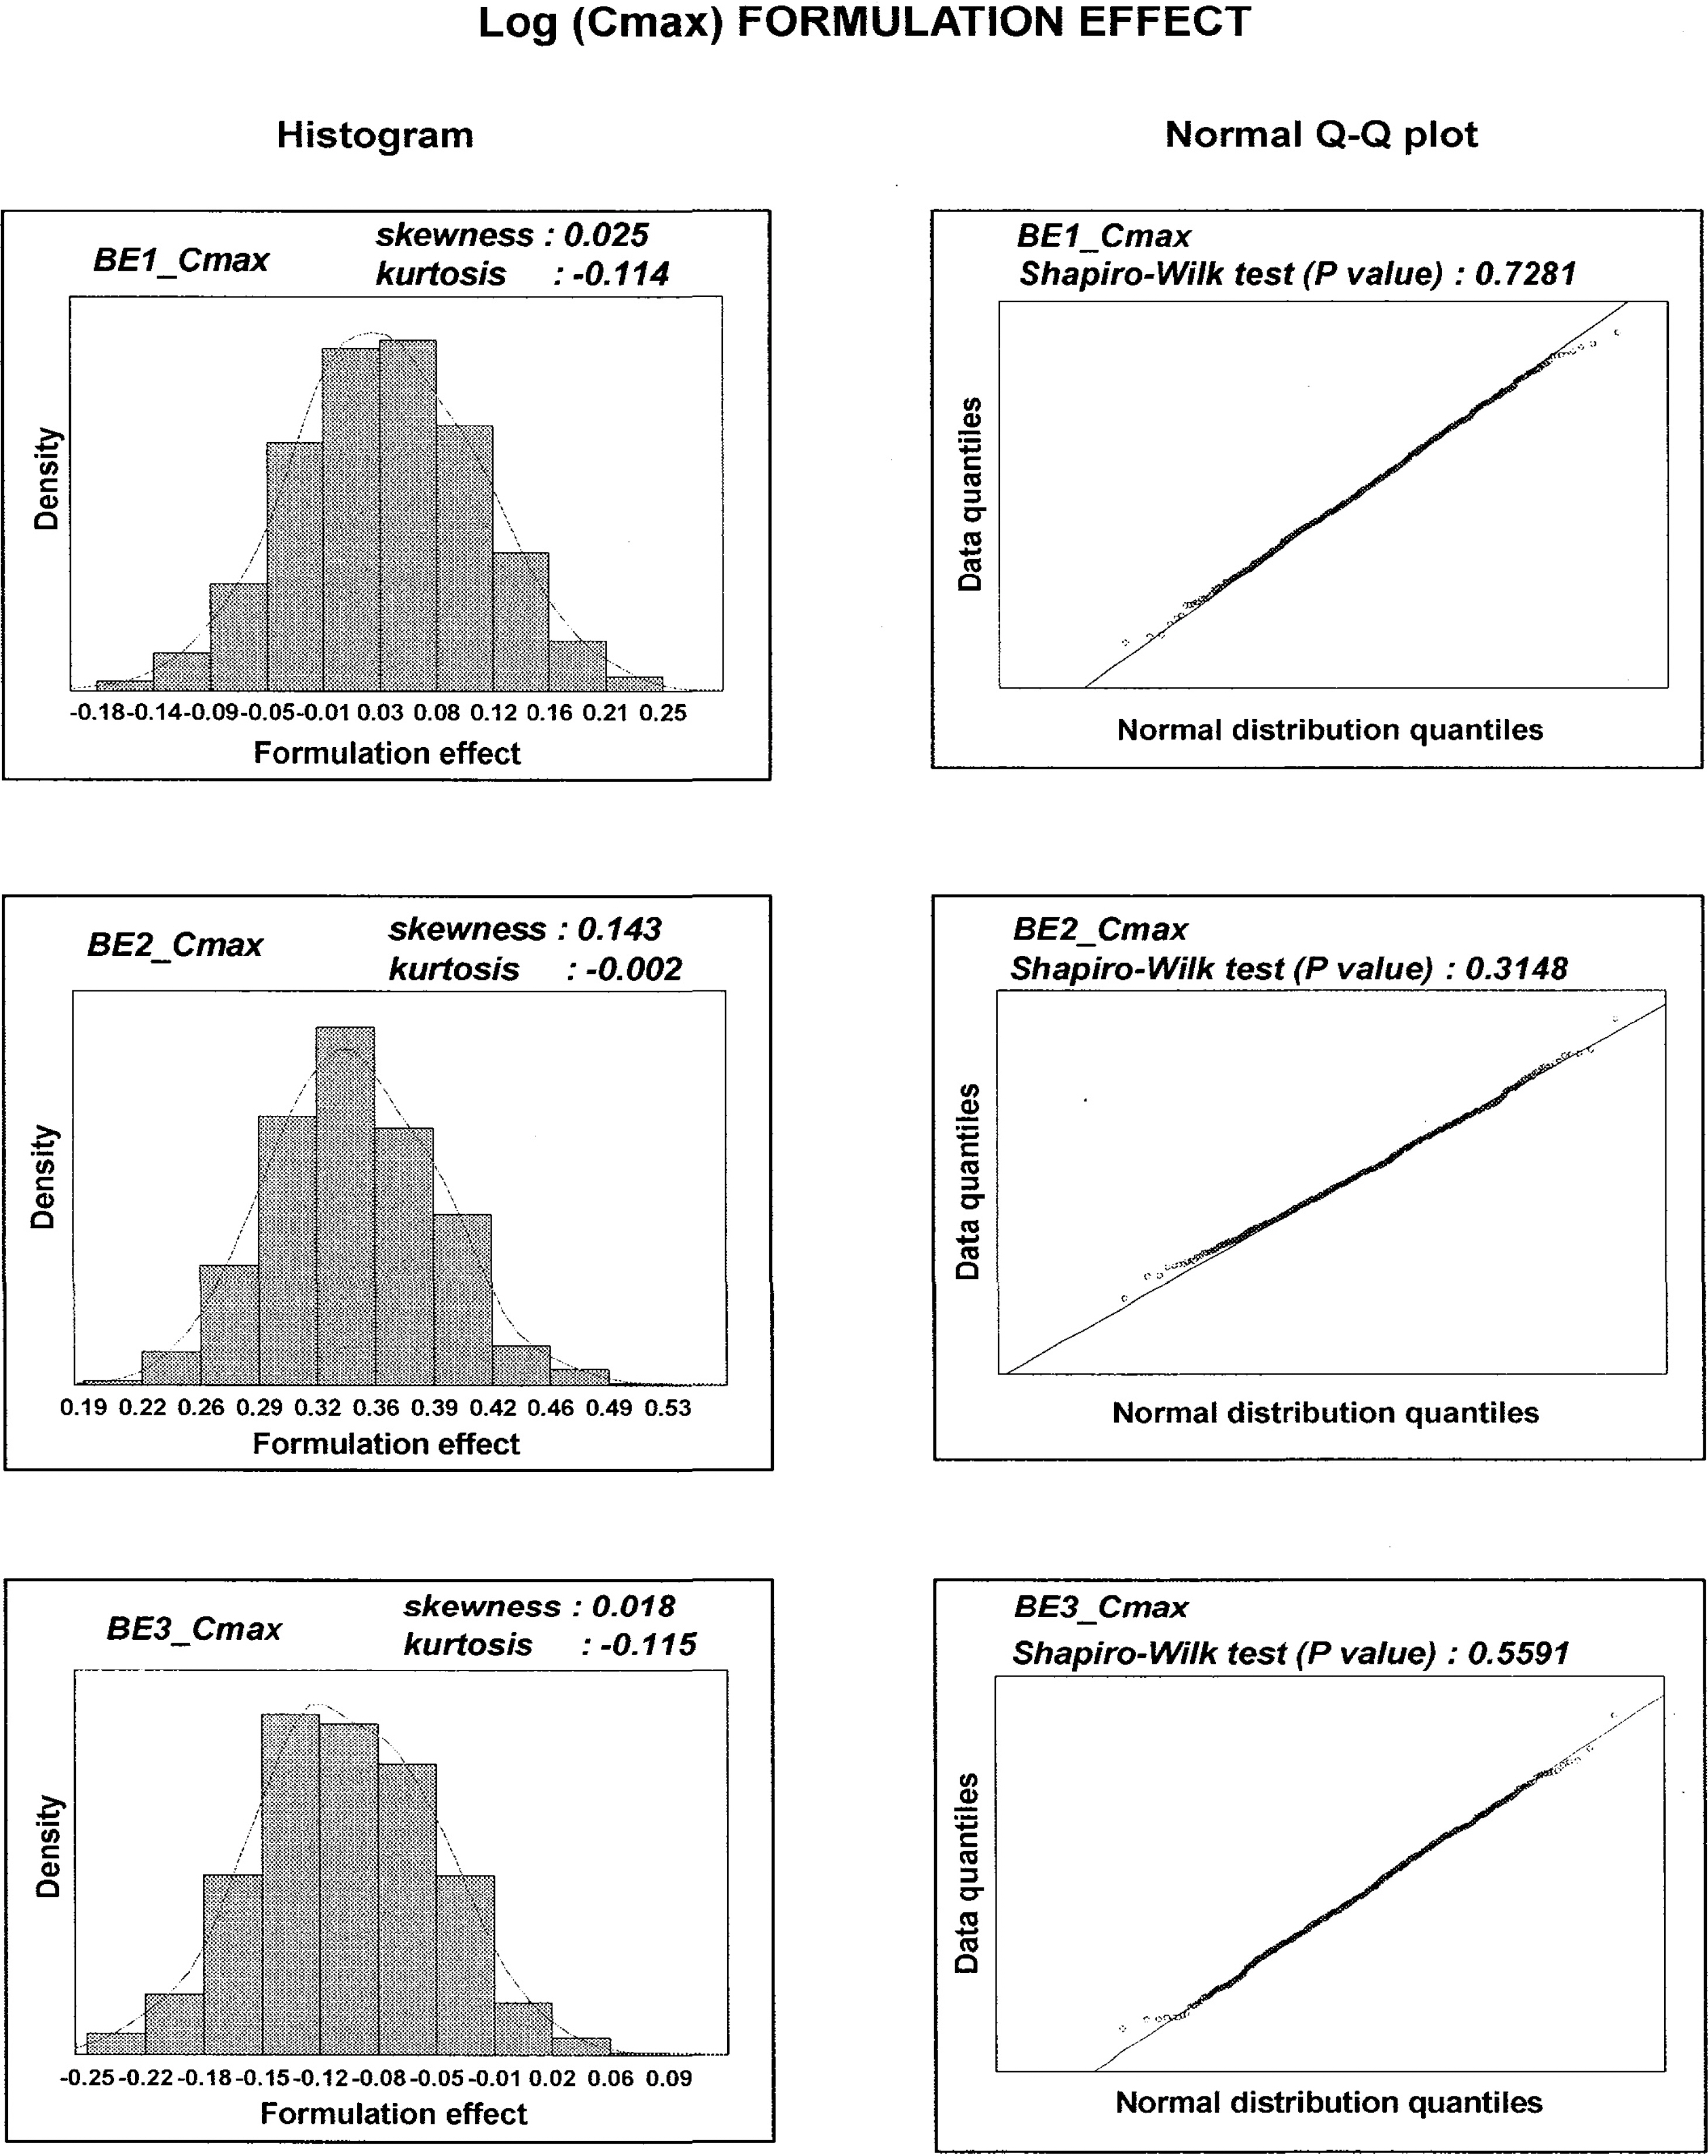
Fig. 2. Histograms and normal Q-Q plots with skewness, kurtosis and Shapiro-Wilk test results showing the distribution of formulation effects (mean differences in log (Cmax) between test and reference formulation) estimates in bootstrap-resampled datasets.
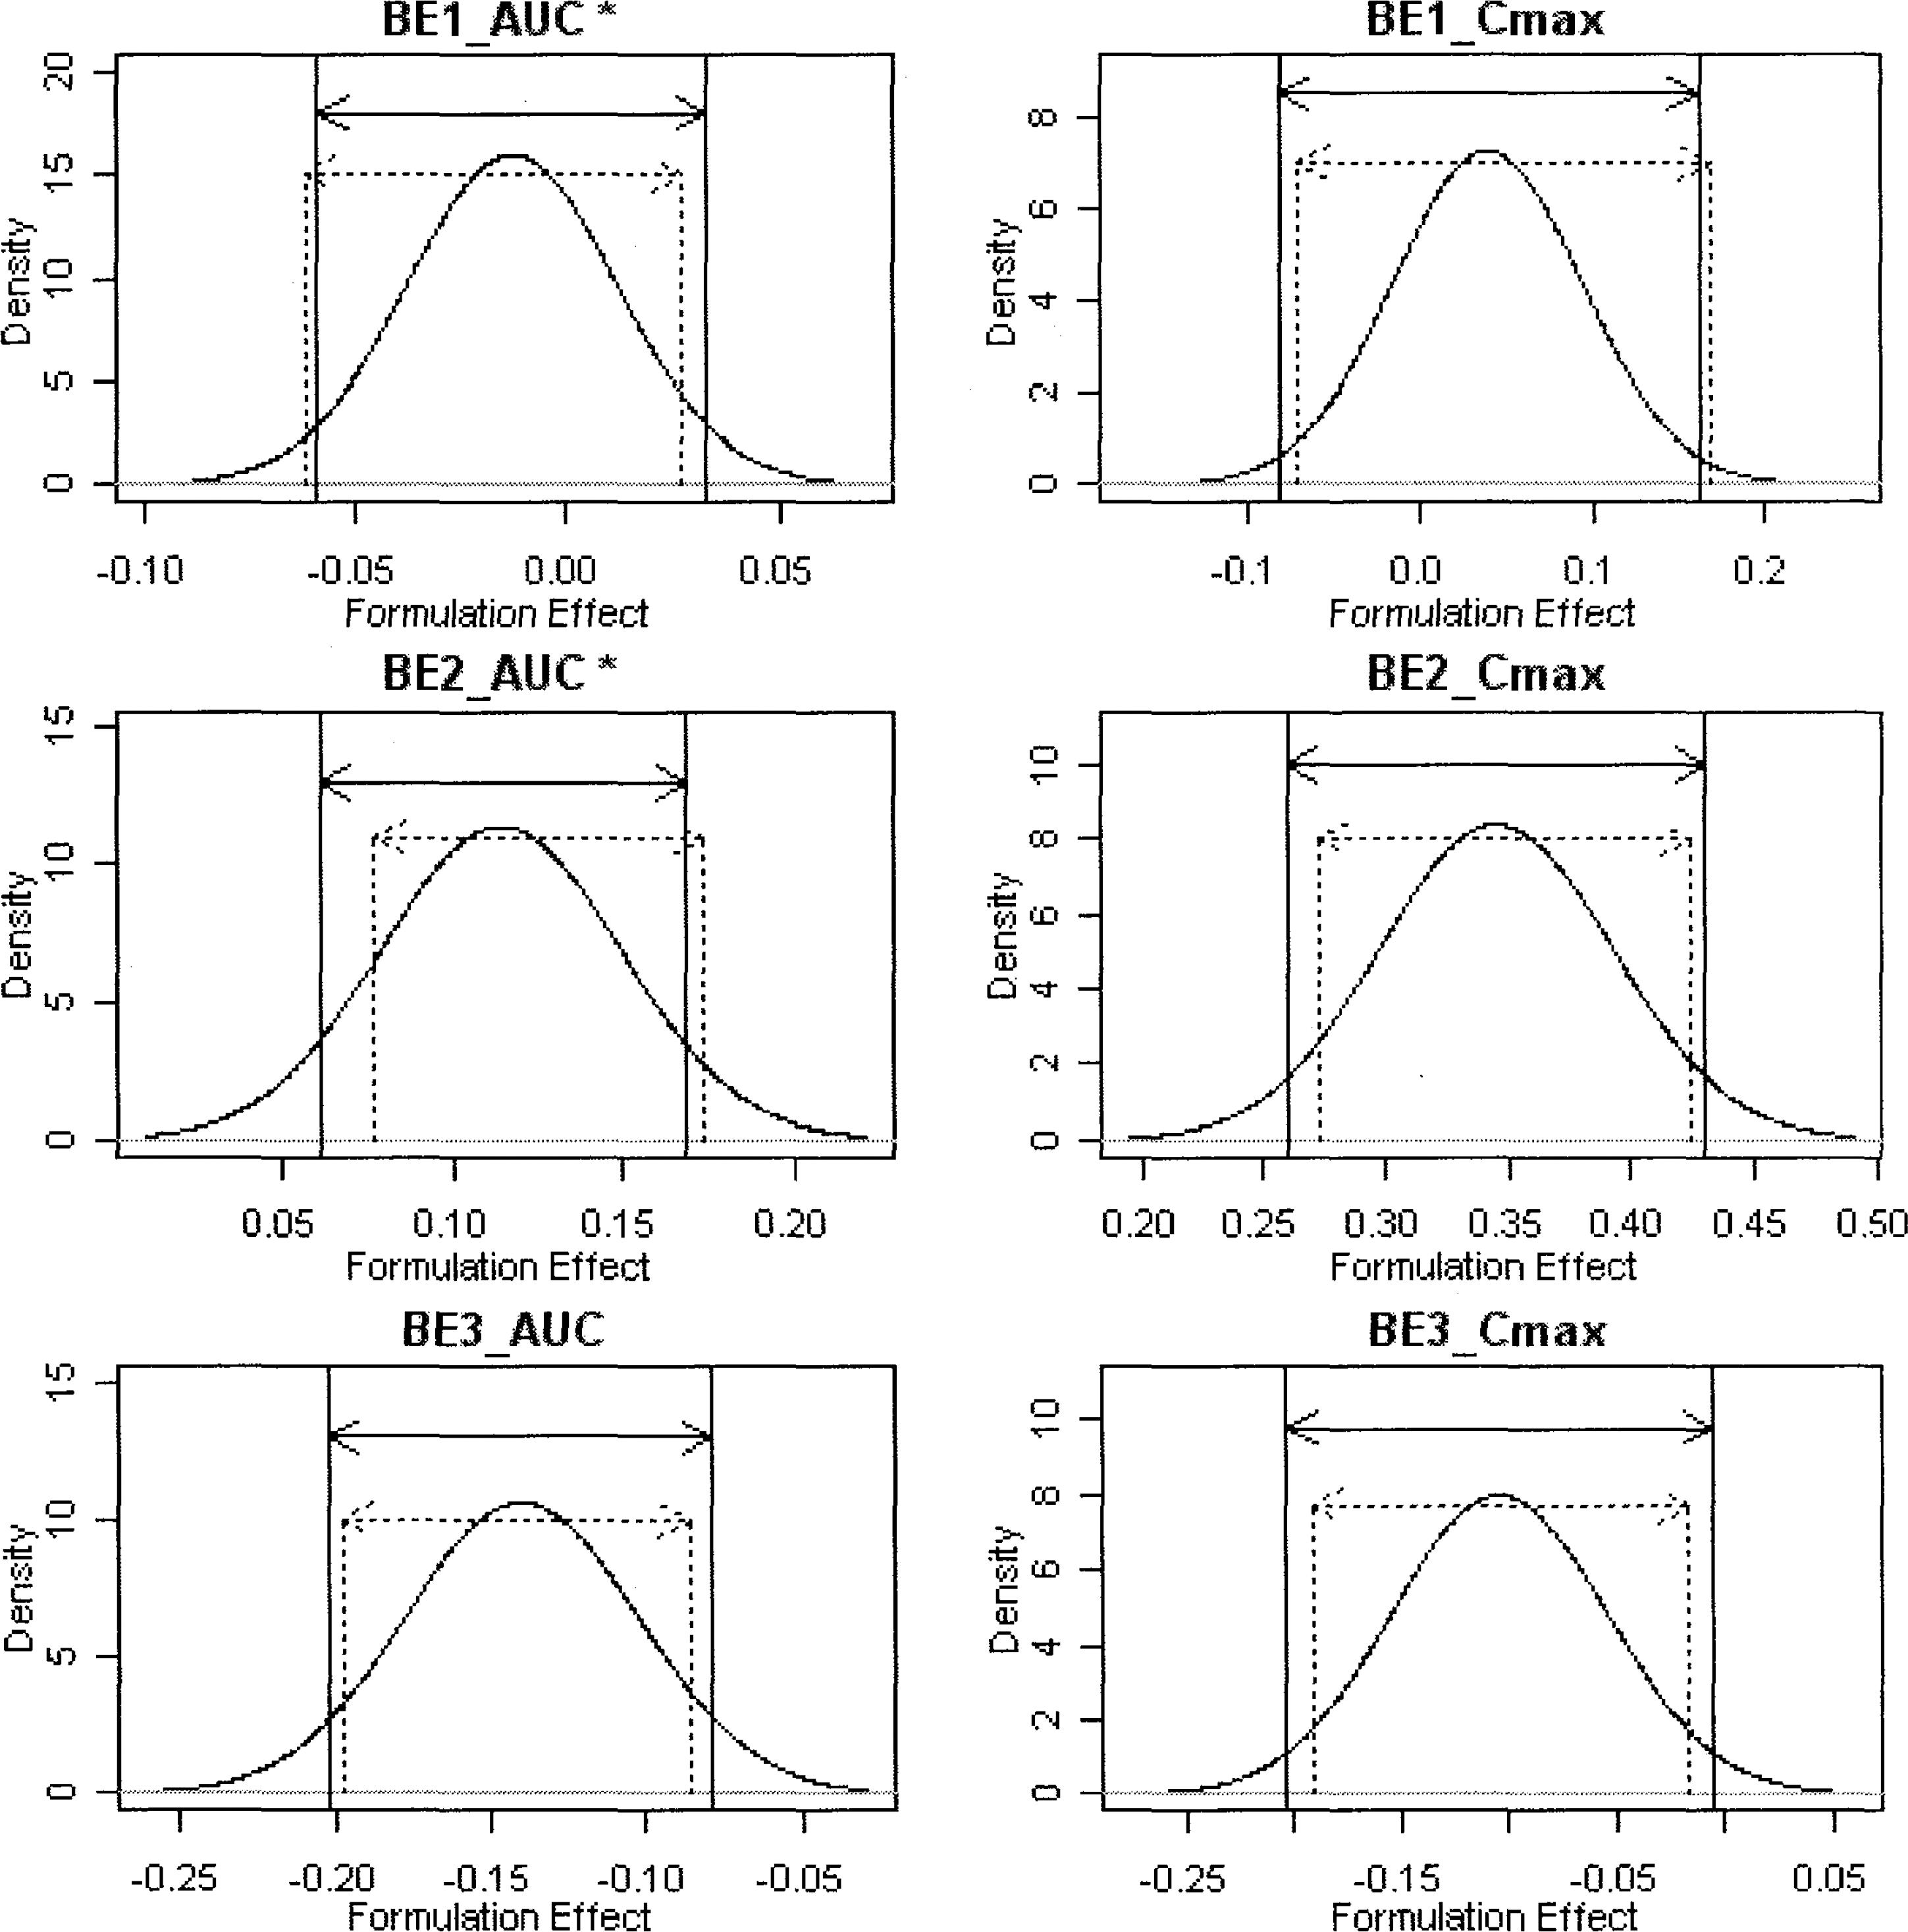
Fig. 3. Comparison of BCa 90% CIs with parametric CIs (solid lines, parametric 5% and 95% points; dotted lines, BCa 5th and 95th percentile points; density curve, anticipated parametric distribution of formulation effects from the archived datasets). ∗BE1_AUC and BE2_AUC were found to have non-normally distributed formulation effects by Shapro-Wilk tests.
Reference
-
References
Bonate PL. Pharmacokinetic-pharmacodynamic modeling and simulation. 1st ed.Springer;New York: p. p. 355–363. 2005.Chow SC. Encyclopedia of biopharmaceutical statistics. 2nd ed.Marcel Dekker;New York: p. p. 83–88. 2003.Efron B., Tibshirani R. An introduction to the bootstrap. Monographs on statistics and applied probability. 1st ed.Chapman & Hall;New York: p. p. 179–201. 372–391,. 1993.EMEA. Questions & Answers on the Bioavailability and Bioequivalence Guideline (EMEA/CHMP/EWP/40326/2006). [EMEA Web site],. http://www.emea.europa.eu/pdfs/human/ewp/4032606en.pdf. European Medicines Agency, Evaluation of Medicines for Human Use. Accessed August 10,. 2009.FDA. Guidance for industry: Statistical Approaches to Establishing Bioequivalence January 2001. [CDER Web site],. http://www.fda.gov/downloads/Drugs/GuidanceComplianceRegulatoryInformation/Guidances/ucm070244.pdf. US Food and Drug Administration, Center for Drug Evaluation and Research. Accessed August 10,. 2009.Henderson AR. The bootstrap: a technique for data-driven statistics. Using computer-intensive analyses to explore experimental data. Clin Chim Acta. 359:1–26. 2005.
ArticleLacey LF., Keene ON., Pritchard JF., Bye A. Common noncompartmental pharmacokinetic variables: are they normally or log-normally distributed? J Biopharm Stat. 7:171–178. 1997.
ArticleMidha KK., Ormsby ED., Hubbard JW., McKay G., Hawes EM., Gavalas L., McGilveray IJ. Logarithmic transformation in bioequivalence: application with two formulations of perphenazine. J Pharm Sci. 82:138–144. 1993.
ArticlePabst G., Jaeger H. Review of methods and criteria for the evaluation of bioequivalence studies. Eur J Clin Pharmacol. 38:5–10. 1990.
ArticlePatterson SD., Jones B. Bioequivalence and the pharmaceutical industry. Pharmaceut Statist. 1:83–95. 2002.
ArticleSprent P., Smeeton NC. Applied nonparametric statistical methods. 3rd ed.Chapman & Hall/CRC;Boca Raton: p. p. 404–437. 2001.Steyn HS., Koeleman HA., Gouws E., Ritschel WA. An approach to select the appropriate statistical method for testing bioequivalence. Int J Clin Pharmacol Ther Toxicol. 29:156–160. 1991.
