Korean J Ophthalmol.
2014 Apr;28(2):164-169. 10.3341/kjo.2014.28.2.164.
Using ImageJ to Evaluate Optic Disc Pallor in Traumatic Optic Neuropathy
- Affiliations
-
- 1Department of Ophthalmology, Kim's Eye Hospital, Seoul, Korea. ungsookim@kimeye.com
- 2Department of Ophthalmology, Konyang University College of Medicine, Daejeon, Korea.
- KMID: 1792111
- DOI: http://doi.org/10.3341/kjo.2014.28.2.164
Abstract
- PURPOSE
To evaluate optic disc pallor using ImageJ in traumatic optic neuropathy (TON).
METHODS
This study examined unilateral TON patients. The optic disc was divided into 4 quadrants (temporal, superior, nasal, and inferior), consistent with the quadrants on optical coherence tomography (OCT) retinal nerve fiber layer (RNFL) thickness maps. Optic disc photography was performed and disc pallor was quantified using gray scale photographic images imported into ImageJ software. The correlation between optic disc pallor and RNFL thickness was examined in each quadrant.
RESULTS
A total of 35 patients (31 male, 4 female) were enrolled in the study. The mean participant age was 34.8 +/- 15.0 years (range, 5 to 63 years). Overall RNFL thickness decreased in 6 patients, with thinning most often occurring in the inferior quadrant (28 of 35 eyes). There was a significant correlation between optic disc pallor and RNFL thickness (superior, rho = -0.358, p = 0.04; inferior, rho = -0.345, p = 0.04; nasal, rho = -0.417, p = 0.01; temporal, rho = -0.390, p = 0.02). The highest level of correspondence between disc pallor and RNFL thickness values outside of the normative 95th percentiles was 39.3% and occurred in the inferior quadrant.
CONCLUSIONS
Optic disc pallor in TON was quantified with ImageJ and was significantly correlated with RNFL thickness abnormalities. Thus, ImageJ evaluations of disc pallor may be useful for evaluating RNFL thinning, as verified by OCT RNFL analyses.
MeSH Terms
-
Adolescent
Adult
Child
Child, Preschool
Colorimetry/methods/standards
Diagnosis, Computer-Assisted/*methods/standards
Female
Humans
Male
Middle Aged
Optic Atrophy/etiology/*pathology
Optic Nerve Diseases/etiology/*pathology
Optic Nerve Injuries/*pathology
Photography/*methods/standards
Reproducibility of Results
Software
Tomography, Optical Coherence/*methods/standards
Trauma Severity Indices
Young Adult
Figure
-

Fig. 1 Optic disc brightness score evaluation method. T = temporal; S = superior; N = nasal; I = inferior. *Largest inferior vessel.
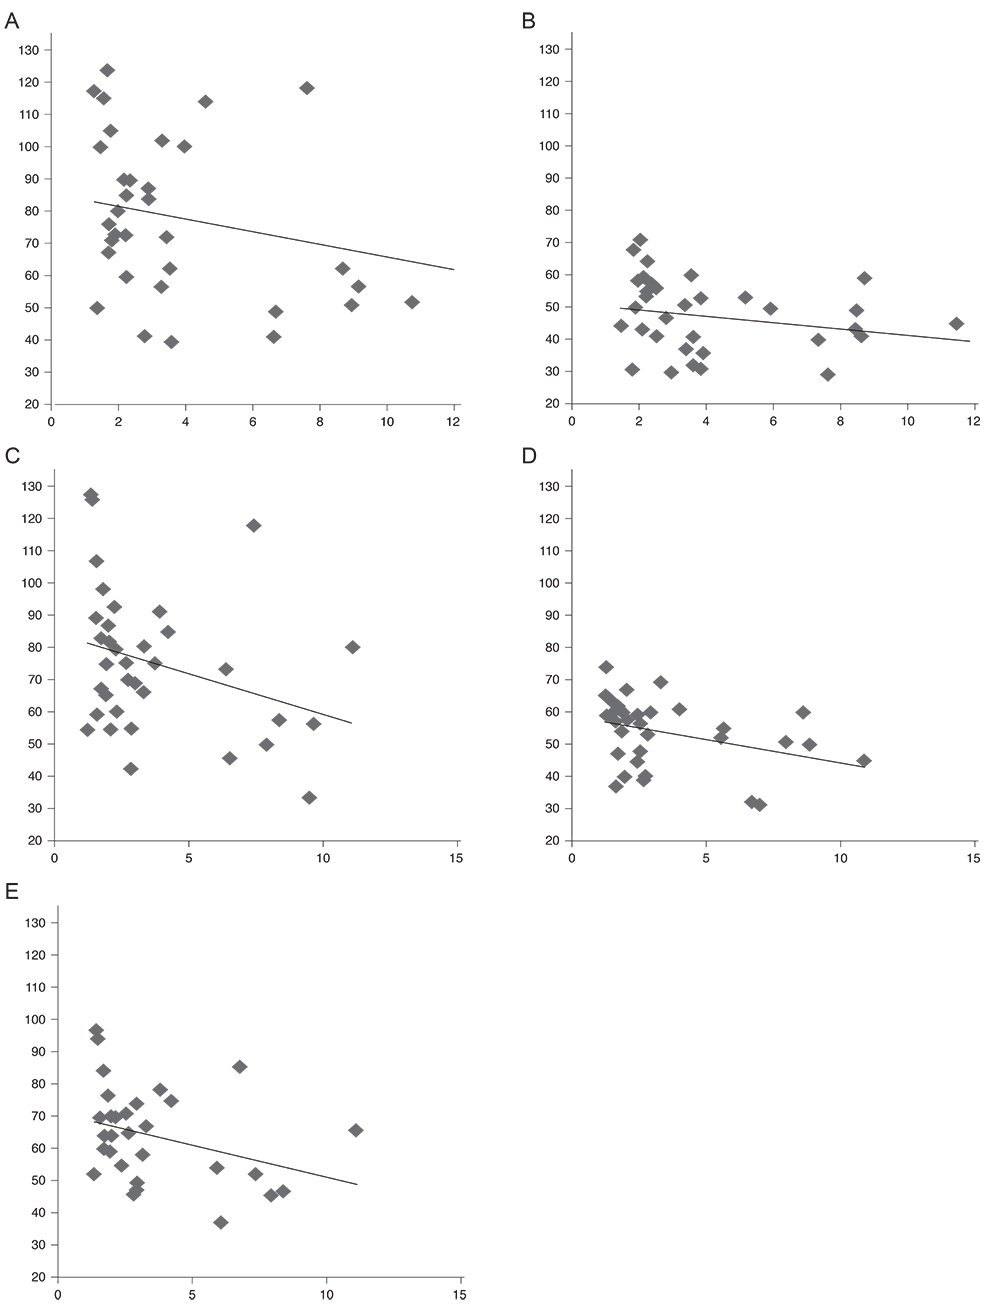
Fig. 2 Correlation between the optic disc brightness score (horizontal axis) and retinal nerve fiber layer thickness (vertical axis, µm). (A) Superior quadrant (rho = -0.358, p = 0.04). (B) Temporal quadrant (rho = -0.358, p = 0.04). (C) Inferior quadrant (rho = -0.345, p = 0.04). (D) Nasal quadrant (rho = -0.417, p = 0.01). (E) Total disc (rho = -0.390, p = 0.02).

Fig. 3 Rate of concordance between the 95% confidence interval area of optic disc brightness and 95% confidence interval area of retinal nerve fiber layer thickness.
Reference
-
1. Quigley HA, Anderson DR. The histologic basis of optic disk pallor in experimental optic atrophy. Am J Ophthalmol. 1977; 83:709–717.2. Budenz DL, Chang RT, Huang X, et al. Reproducibility of retinal nerve fiber thickness measurements using the stratus OCT in normal and glaucomatous eyes. Invest Ophthalmol Vis Sci. 2005; 46:2440–2443.3. Flammer J, Mozaffarieh M. What is the present pathogenetic concept of glaucomatous optic neuropathy? Surv Ophthalmol. 2007; 52:Suppl 2. S162–S173.4. Grieshaber MC, Mozaffarieh M, Flammer J. What is the link between vascular dysregulation and glaucoma? Surv Ophthalmol. 2007; 52:Suppl 2. S144–S154.5. Mansouri K, Leite MT, Medeiros FA, et al. Assessment of rates of structural change in glaucoma using imaging technologies. Eye (Lond). 2011; 25:269–277.6. Marzoli SB, Ciasca P, Curone M, et al. Quantitative analysis of optic nerve damage in idiopathic intracranial hypertension (IIH) at diagnosis. Neurol Sci. 2013; 34:Suppl 1. S143–S145.7. Miller JM, Caprioli J. Videographic quantification of optic disc pallor. Invest Ophthalmol Vis Sci. 1988; 29:320–323.8. Schwartz B, Kern J. Scanning microdensitometry of optic disc pallor in glaucoma. Arch Ophthalmol. 1977; 95:2159–2165.9. Kim US, Kim SJ, Baek SH, et al. Quantitative analysis of optic disc color. Korean J Ophthalmol. 2011; 25:174–177.10. Medeiros FA, Moura FC, Vessani RM, Susanna R Jr. Axonal loss after traumatic optic neuropathy documented by optical coherence tomography. Am J Ophthalmol. 2003; 135:406–408.11. Fogagnolo P, Romano S, Ranno S, et al. Diagnostic assessment of normal and pale optic nerve heads by confocal scanning laser ophthalmoscope and stereophotography. J Glaucoma. 2011; 20:10–14.12. Quigley HA, Addicks EM. Regional differences in the structure of the lamina cribrosa and their relation to glaucomatous optic nerve damage. Arch Ophthalmol. 1981; 99:137–143.13. Bendschneider D, Tornow RP, Horn FK, et al. Retinal nerve fiber layer thickness in normals measured by spectral domain OCT. J Glaucoma. 2010; 19:475–482.14. Lee JY, Hwang YH, Lee SM, Kim YY. Age and retinal nerve fiber layer thickness measured by spectral domain optical coherence tomography. Korean J Ophthalmol. 2012; 26:163–168.15. Vilser W, Nagel E, Seifert BU, et al. Quantitative assessment of optic nerve head pallor. Physiol Meas. 2008; 29:451–457.
- Full Text Links
-
- Actions
-
Cited
- CITED
-
- Close
- Share
-
- Similar articles
-
- The Etiology of Optic Neuropathy
- Comparison of Optic Disc Appearance in Anterior ischemic optic neuropathy and Optic neuritis
- A Case of Meningioma Masquerading as Ischemic Optic Neuropathy
- Correlation between Visual Acuity and Retinal Nerve Fiber Layer Thickness in Optic Neuropathies
- Optic Neuritis Mimicking Ischemic Optic Neuropathy and Optic Glioma
