Korean J Ophthalmol.
2013 Dec;27(6):433-439. 10.3341/kjo.2013.27.6.433.
Comparison of Choroidal Thickness in Patients with Diabetes by Spectral-domain Optical Coherence Tomography
- Affiliations
-
- 1Department of Ophthalmology, Hallym University Chuncheon Sacred Heart Hospital, Chuncheon, Korea.
- 2Department of Ophthalmology, Seoul Metropolitan Dongbu Hospital, Seoul, Korea. jiwoneye@hallym.or.kr
- KMID: 1792079
- DOI: http://doi.org/10.3341/kjo.2013.27.6.433
Abstract
- PURPOSE
To evaluate choroidal thickness in diabetes patients using spectral-domain optical coherence tomography.
METHODS
We examined 203 eyes of 203 diabetic participants and 48 eyes of 48 healthy controls. The choroidal thickness at the foveal lesion was measured by enhanced-depth imaging optical coherence tomography. The participants were grouped according to diabetic retinopathy grade: no diabetic change, mild-to-moderate or severe non-proliferative, or proliferative diabetic retinopathy. The study parameters included history, age, axial length, intraocular pressure, central retinal thickness, fasting glucose, and blood pressure.
RESULTS
The subfoveal choroidal thickness was thinner in eyes with non-proliferative or proliferative diabetic retinopathy than in normal eyes (p < 0.01). However, there was no difference between eyes with non-proliferative and proliferative diabetic retinopathy or between eyes with no diabetic change and the controls. Eyes exhibiting macular edema showed no significant difference in choroidal thickness compared with eyes having normal macular contours.
CONCLUSIONS
The central choroid is thinner when eyes show diabetic changes on the retina. However, the presence of diabetic macular edema or proliferative change is not associated with more pronounced choroidal thinning.
MeSH Terms
Figure
-
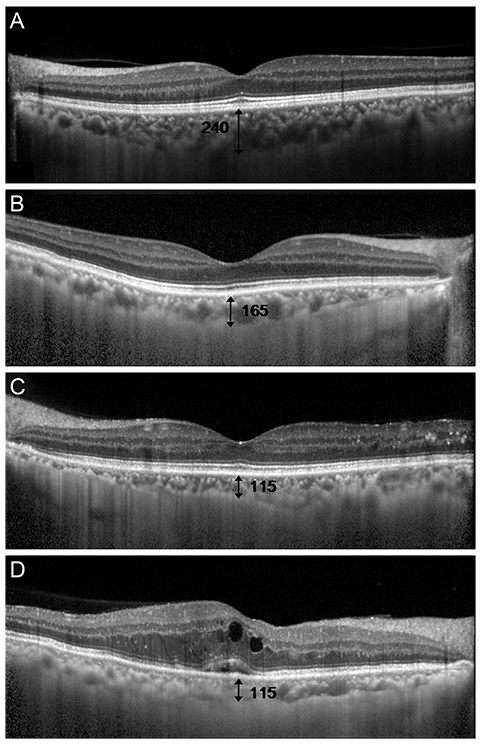
Fig. 1 Optical coherence tomography images using enhanced-depth imaging. The choroidal thickness (white arrow) was defined as the vertical distance from the hyperreflective line of the Bruch's membrane to the outermost hyperreflective line, as measured in micrometers. (A) Representative scan of a normal individual. (B) Representative scan of an individual with severe non-proliferative diabetic retinopathy; note that the choroid is thinner than in the normal individual. (C) Representative scan of an individual with proliferative diabetic retinopathy (PDR). The image shows normal macular contours. (D) Representative scan of an individual with PDR and macular edema.
Reference
-
1. Cunha-Vaz J, Faria de Abreu JR, Campos AJ. Early breakdown of the blood-retinal barrier in diabetes. Br J Ophthalmol. 1975; 59:649–656.2. Hidayat AA, Fine BS. Diabetic choroidopathy: light and electron microscopic observations of seven cases. Ophthalmology. 1985; 92:512–522.3. Weinberger D, Kramer M, Priel E, et al. Indocyanine green angiographic findings in nonproliferative diabetic retinopathy. Am J Ophthalmol. 1998; 126:238–247.4. Shiragami C, Shiraga F, Matsuo T, et al. Risk factors for diabetic choroidopathy in patients with diabetic retinopathy. Graefes Arch Clin Exp Ophthalmol. 2002; 240:436–442.5. Regatieri CV, Branchini L, Fujimoto JG, Duker JS. Choroidal imaging using spectral-domain optical coherence tomography. Retina. 2012; 32:865–876.6. Early Treatment Diabetic Retinopathy Study Research Group. Grading diabetic retinopathy from stereoscopic color fundus photographs: an extension of the modified Airlie House classification. ETDRS report number 10. Ophthalmology. 1991; 98:5 Suppl. 786–806.7. Spaide RF, Koizumi H, Pozzoni MC. Enhanced depth imaging spectral-domain optical coherence tomography. Am J Ophthalmol. 2008; 146:496–500.8. Tilton RG, LaRose LS, Kilo C, Williamson JR. Absence of degenerative changes in retinal and uveal capillary pericytes in diabetic rats. Invest Ophthalmol Vis Sci. 1986; 27:716–721.9. Kobayashi S, Fukuta M, Kontani H, et al. A quantitative assay for angiogenesis of cultured choroidal tissues in streptozotocin-diabetic Wistar and spontaneously diabetic GK rats. Jpn J Pharmacol. 1998; 78:471–478.10. MacGregor LC, Rosecan LR, Laties AM, Matschinsky FM. Altered retinal metabolism in diabetes. I. Microanalysis of lipid, glucose, sorbitol, and myo-inositol in the choroid and in the individual layers of the rabbit retina. J Biol Chem. 1986; 261:4046–4051.11. Lutty GA, McLeod DS, Merges C, et al. Localization of vascular endothelial growth factor in human retina and choroid. Arch Ophthalmol. 1996; 114:971–977.12. Margolis R, Spaide RF. A pilot study of enhanced depth imaging optical coherence tomography of the choroid in normal eyes. Am J Ophthalmol. 2009; 147:811–815.13. Ikuno Y, Kawaguchi K, Nouchi T, Yasuno Y. Choroidal thickness in healthy Japanese subjects. Invest Ophthalmol Vis Sci. 2010; 51:2173–2176.14. McCourt EA, Cadena BC, Barnett CJ, et al. Measurement of subfoveal choroidal thickness using spectral domain optical coherence tomography. Ophthalmic Surg Lasers Imaging. 2010; 41:Suppl. S28–S33.15. Linsenmeier RA, Padnick-Silver L. Metabolic dependence of photoreceptors on the choroid in the normal and detached retina. Invest Ophthalmol Vis Sci. 2000; 41:3117–3123.16. Bearse MA Jr, Han Y, Schneck ME, Adams AJ. Retinal function in normal and diabetic eyes mapped with the slow flash multifocal electroretinogram. Invest Ophthalmol Vis Sci. 2004; 45:296–304.17. Geyer O, Neudorfer M, Snir T, et al. Pulsatile ocular blood f low in diabetic retinopathy. Acta Ophthalmol Scand. 1999; 77:522–525.18. Langham ME, Grebe R, Hopkins S, et al. Choroidal blood flow in diabetic retinopathy. Exp Eye Res. 1991; 52:167–173.19. Nagaoka T, Kitaya N, Sugawara R, et al. Alteration of choroidal circulation in the foveal region in patients with type 2 diabetes. Br J Ophthalmol. 2004; 88:1060–1063.20. Schocket LS, Brucker AJ, Niknam RM, et al. Foveolar choroidal hemodynamics in proliferative diabetic retinopathy. Int Ophthalmol. 2004; 25:89–94.21. Esmaeelpour M, Povazay B, Hermann B, et al. Mapping choroidal and retinal thickness variation in type 2 diabetes using three-dimensional 1060-nm optical coherence tomography. Invest Ophthalmol Vis Sci. 2011; 52:5311–5316.22. UK Prospective Diabetes Study Group. Tight blood pressure control and risk of macrovascular and microvascular complications in type 2 diabetes: UKPDS 38. BMJ. 1998; 317:703–713.23. Yang L, Gong H, Wang Y, et al. Nicotine alters morphology and function of retinal pigment epithelial cells in mice. Toxicol Pathol. 2010; 38:560–567.24. Li XQ, Larsen M, Munch IC. Subfoveal choroidal thickness in relation to sex and axial length in 93 Danish university students. Invest Ophthalmol Vis Sci. 2011; 52:8438–8441.25. Fujiwara T, Imamura Y, Margolis R, et al. Enhanced depth imaging optical coherence tomography of the choroid in highly myopic eyes. Am J Ophthalmol. 2009; 148:445–450.26. Usui S, Ikuno Y, Akiba M, et al. Circadian changes in subfoveal choroidal thickness and the relationship with circulatory factors in healthy subjects. Invest Ophthalmol Vis Sci. 2012; 53:2300–2307.27. Tan CS, Ouyang Y, Ruiz H, Sadda SR. Diurnal variation of choroidal thickness in normal, healthy subjects measured by spectral domain optical coherence tomography. Invest Ophthalmol Vis Sci. 2012; 53:261–266.
- Full Text Links
-
- Actions
-
Cited
- CITED
-
- Close
- Share
-
- Similar articles
-
- Choroidal Thickness at the Outside of Fovea in Diabetic Retinopathy Using Spectral-Domain Optical Coherence Tomography
- Choroidal Thickness in Primary Open-Angle Glaucoma Using Spectral-Domain Optical Coherence Tomography
- Subfoveal Choroidal Thickness in Fellow Eyes of Patients with Central Serous Chorioretinopathy
- The Relationship among Refractive Power, Axial Length and Choroidal Thickness Measured by SD-OCT in Myopia
- Measurement of Choroidal Thickness in Normal Eyes Using 3D OCT-1000 Spectral Domain Optical Coherence Tomography
