Quantitative Determination of Plasmodium Parasitemia by Flow Cytometry and Microscopy
- Affiliations
-
- 1Department of Biochemistry, Graduate School of Medicine, Gachon University, Incheon, Korea.
- 2Department of Microbiology, Graduate School of Medicine, Gachon University, Incheon, Korea. hpmicca@gmail.com
- KMID: 1778817
- DOI: http://doi.org/10.3346/jkms.2012.27.10.1137
Abstract
- The traditional light microscopy has limitations for precise growth assays of malaria parasites in culture or for assessment of new compounds for antimalarial activity; the speed and high reproducibility of flow cytometry can overcome these limitations. A flow cytometric method using PicoGreen, a DNA-binding fluorochrome, was developed with optimal precision suitable for performing growth assays of low-parasitemia field isolates. In addition, intra- and inter-person reproducibility of the flow cytometric and the microscopic method were compared in order to quantitatively demonstrate the improved precision. RNase treatment contributed to the precision of the flow cytometric measurements by enhancing the signal-to-noise ratios. Coefficients of variation of the method were smaller than 10% for 0.1% or higher parasitemia samples. The intra- and inter-person coefficients of variation of the flow cytometric method were three to six times smaller than those of the microscopic method. The flow cytometric method developed in this study yielded substantially more precise results than the microscopic method, allowing determination of parasitemia levels of 0.1% or higher, with coefficients of variation smaller than 10%. Thus, the PicoGreen method could be a reliable high sensitivity assay for analysis of low parasitemia samples and might be applied to a high throughput system testing antimalarial drug activity.
Keyword
MeSH Terms
Figure
-
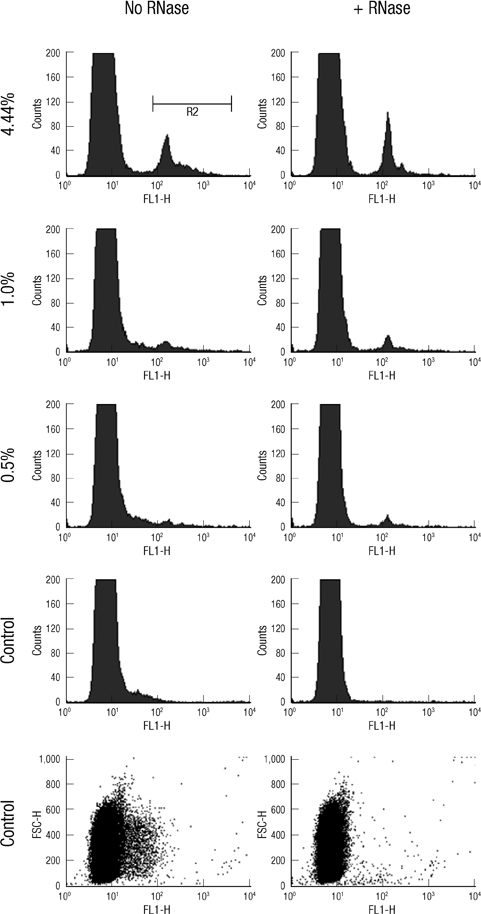
Fig. 1 Effect of RNase treatment. A 4.44% parasitemia sample (measured by microscopy) was diluted to prepare 1% and 0.5% parasitemia samples. Each of these three samples and an uninfected control sample were divided into two portions, and the two sets were incubated in a 37℃ water bath for 30 min: the first set without RNase and the second with RNase.

Fig. 2 Effect of PicoGreen concentration (1 × is the concentration suggested by the manufacturer).
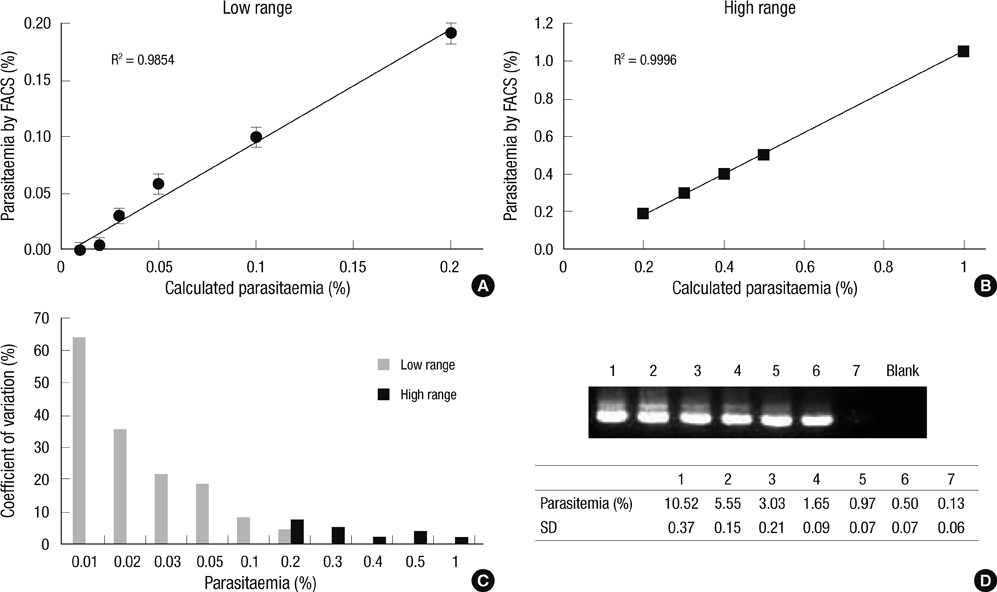
Fig. 3 Precision of parasitemia determination by flow cytometry. An in vitro culture of P. falciparum was diluted to prepare samples of the desired parasitemia levels. (A) Each of the low range samples was measured 10 times. After deleting the largest and smallest values, the average and standard deviation were calculated for the remaining eight samples. (B) The data for each of the high range samples were obtained from five repeated measurements without deletion. (C) The coefficient of variation for each parasitemia was calculated by dividing the standard deviation by the true parasitemia, assuming perfectly accurate serial dilution. (D) 1.5% agarose gel showing PCR product obtained by nested multiplex PCR for 205 bp segment. DNA was extracted from the P. falciparum infected red blood cells. The % values of parasitemia, denoted in the table, were calculated by microscopic observation, and SD in the table means standard deviation.
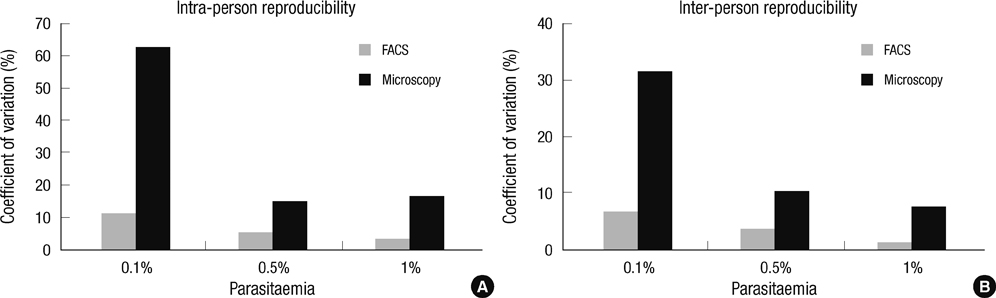
Fig. 4 Reproducibility of parasitemia determination by flow cytometry and microscopy. Each of three examiners measured each sample five times. Each of the intra-person CVs is the average of three intra-person CVs obtained by the three examiners. The above experiment was repeated twice, and the graphs represent the average of the two experiments.
Reference
-
1. Desjardins RE, Canfield CJ, Haynes JD, Chulay JD. Quantitative assessment of antimalarial activity in vitro by a semiautomated microdilution technique. Antimicrob Agents Chemother. 1979. 16:710–718.2. Brown GV, Battye FL, Howard RJ. Separation of stages of Plasmodium falciparum-infected cells by means of a fluorescence-activated cell sorter. Am J Trop Med Hyg. 1980. 29:1147–1149.3. Barkan D, Ginsburg H, Golenser J. Optimisation of flow cytometric measurement of parasitaemia in plasmodium-infected mice. Int J Parasitol. 2000. 30:649–653.4. Chevalley S, Coste A, Lopez A, Pipy B, Valentin A. Flow cytometry for the evaluation of anti-plasmodial activity of drugs on Plasmodium falciparum gametocytes. Malar J. 2010. 9:49.5. Persson KE, Lee CT, Marsh K, Beeson JG. Development and optimization of high-throughput methods to measure Plasmodium falciparum-specific growth inhibitory antibodies. J Clin Microbiol. 2006. 44:1665–1673.6. van der Heyde HC, Elloso MM, vande Waa J, Schell K, Weidanz WP. Use of hydroethidine and flow cytometry to assess the effects of leukocytes on the malarial parasite Plasmodium falciparum. Clin Diagn Lab Immunol. 1995. 2:417–425.7. Whaun JM, Rittershaus C, Ip SH. Rapid identification and detection of parasitized human red cells by automated flow cytometry. Cytometry. 1983. 4:117–122.8. Wilson DW, Crabb BS, Beeson JG. Development of fluorescent Plasmodium falciparum for in vitro growth inhibition assays. Malar J. 2010. 9:152.9. Baniecki ML, Wirth DF, Clardy J. High-throughput Plasmodium falciparum growth assay for malaria drug discovery. Antimicrob Agents Chemother. 2007. 51:716–723.10. Collins WE, Sullivan JS, Jeffery GM, Williams A, Galland GG, Nace D, Williams T, Barnwell JW. The Chesson strain of plasmodium vivax in humans and different species of Aotus monkeys. Am J Trop Med Hyg. 2009. 80:152–159.11. Huh AJ, Kwak YG, Kim ES, Lee KS, Yeom JS, Cho YK, Kim CS, Park JW. Parasitemia characteristics of Plasmodium vivax malaria patients in the Republic of Korea. J Korean Med Sci. 2011. 26:42–46.12. Ahn SY, Shin MY, Kim YA, Yoo JA, Kwak DH, Jung YJ, Jun G, Ryu SH, Yeom JS, Ahn JY, et al. Magnetic separation: a highly effective method for synchronization of cultured erythrocytic Plasmodium falciparum. Parasitol Res. 2008. 102:1195–1200.13. Snounou G, Viriyakosol S, Zhu XP, Jarra W, Pinheiro L, do Rosario VE, Thaithong S, Brown KN. High sensitivity of detection of human malaria parasites by the use of nested polymerase chain reaction. Mol Biochem Parasitol. 1993. 61:315–320.14. Carlton JM, Adams JH, Silva JC, Bidwell SL, Lorenzi H, Caler E, Crabtree J, Angiuoli SV, Merino EF, Amedeo P, et al. Comparative genomics of the neglected human malaria parasite Plasmodium vivax. Nature. 2008. 455:757–763.15. Gronowicz G, Swift H, Steck TL. Maturation of the reticulocyte in vitro. J Cell Sci. 1984. 71:177–197.16. Marie D, Vaulot D, Partensky F. Application of the novel nucleic acid dyes YOYO-1, YO-PRO-1, and PicoGreen for flow cytometric analysis of marine prokaryotes. Appl Environ Microbiol. 1996. 62:1649–1655.17. Bharti AR, Patra KP, Chuquiyauri R, Kosek M, Gilman RH, Llanos-Cuentas A, Vinetz JM. Polymerase chain reaction detection of Plasmodium vivax and Plasmodium falciparum DNA from stored serum samples: implications for retrospective diagnosis of malaria. Am J Trop Med Hyg. 2007. 77:444–446.
- Full Text Links
-
- Actions
-
Cited
- CITED
-
- Close
- Share
-
- Similar articles
-
- Diagnosis and Treatment Monitoring of Plasmodium vivax Malaria using the OptiMAL test in South Korean oldiers
- Retinal Hemorrhage in an Adult with P. vivax Malaria
- Clinical implication and detection of anti-neutrophil cytoplasmicantibody: comparison of fluorescent microscopy with flow cytometry
- Mwasurement of staphylococcus aureus phagocytosis by human leukocytes: comparison of flow cytometry with immune microscopy
- Advances in Automated Urinalysis Systems, Flow Cytometry and Digitized Microscopy
