Small Increases in Plasma Sodium Are Associated with Higher Risk of Mortality in a Healthy Population
- Affiliations
-
- 1Department of Internal Medicine, Eulji General Hospital, Eulji University College of Medicine, Seoul, Korea.
- 2Department of Internal Medicine, Seoul National University College of Medicine, Seoul, Korea. mednep@snubh.org
- 3Inje University Seoul Paik Hospital, Seoul, Korea.
- 4Department of Internal Medicine, Seoul National University Bundang Hospital, Seongnam, Korea.
- 5Renal Institute, Seoul National University Medical Research Center, Seoul, Korea.
- KMID: 1777499
- DOI: http://doi.org/10.3346/jkms.2013.28.7.1034
Abstract
- Elevated blood pressure (BP) is the most common cause of cardiovascular disease. Salt intake has a strong influence on BP, and plasma sodium (pNa) is increased with progressive increases in salt intake. However, the associations with pNa and BP had been reported inconsistently. We evaluated the association between pNa and BP, and estimated the risks of all-cause-mortality according to pNa levels. On the basis of data collected from health checkups during 1995-2009, 97,009 adult subjects were included. Positive correlations between pNa and systolic BP, diastolic BP, and pulse pressure (PP) were noted in participants with pNa > or =138 mM/L (P<0.001). In participants aged > or =50 yr, SBP, DBP, and PP were positively associated with pNa. In participants with metabolic syndrome components, the differences in SBP and DBP according to pNa were greater (P<0.001). A cumulative incidence of mortality was increased with increasing pNa in women aged > or =50 yr during the median 4.2-yr-follow-up (P<0.001). In women, unadjusted risks for mortality were increased according to sodium levels. After adjustment, pNa > or =145 mM/L was related to mortality. The positive correlation between pNa and BP is stronger in older subjects, women, and subjects with metabolic syndrome components. The incidence and adjusted risks of mortality increase with increasing pNa in women aged > or =50 yr.
Keyword
MeSH Terms
Figure
-
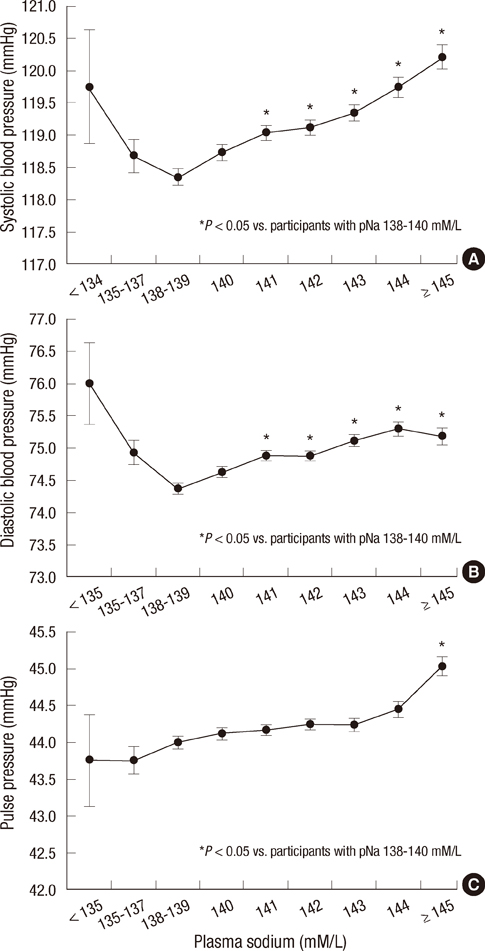
Fig. 1 Distribution of systolic blood pressure (SBP), diastolic blood pressure (DBP), and pulse pressue (PP) according to plasma sodium (pNa) levels. (A) SBP according to pNa levels. SBP in participants with pNa ≥ 141 mM/L was significantly higher than in pNa 138-139 mM/L (P = 0.002), and SBP was not significantly different among participants with pNa < 134 and pNa 138-139 mM/L. The SBP is adjusted by age, estimated glomerular filtration rate, body mass index, total serum cholesterol, protein, calcium, phosphorus, glucose, potassium, HDL cholesterol, and alkaline phosphatase using co-variance analysis (ANCOVA). Error bars indicate the standard error of the mean. (B) DBP according to pNa levels. DBP in participants with pNa ≥ 141 mM/L was significantly higher than in participants with pNa 138-139 mM/L (P < 0.001). The DBP is adjusted by age, estimated glomerular filtration rate, body mass index, total serum cholesterol, protein, calcium, phosphorus, glucose, potassium, HDL cholesterol, and alkaline phosphatase using co-variance analysis (ANCOVA). Error bars indicate the standard error of the mean. (C) PP according to pNa levels. Only pulse pressure (PP) in pNa ≥ 145 mM/L participants was significantly higher than in pNa 138-189 mM/L participants. The PP is adjusted by age, estimated glomerular filtration rate, body mass index, total serum cholesterol, protein, calcium, phosphorus, glucose, potassium, HDL cholesterol, and alkaline phosphatase using co-variance analysis (ANCOVA). Error bars indicate the standard error of the mean. *P < 0.05 vs participants with pNa 138-140 mM/L.
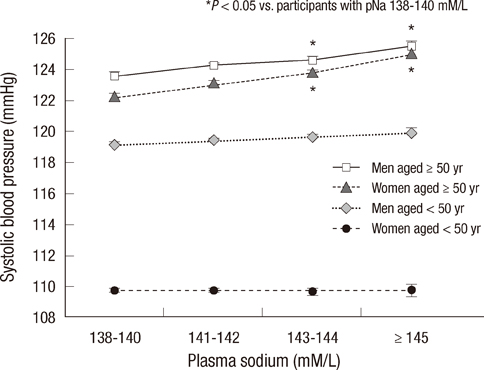
Fig. 2 The distribution of systolic blood pressure (SBP) according to sodium groups stratified by age and gender. The SBP is adjusted by age, estimated glomerular filtration rate, body mass index, serum total cholesterol, protein, calcium, phosphorous, glucose, potassium, HDL cholesterol, and alkaline phosphatase using co-variance analysis (ANCOVA). Error bars indicate the standard error of the mean. *P < 0.05 vs participants with pNa 138-140 mM/L.
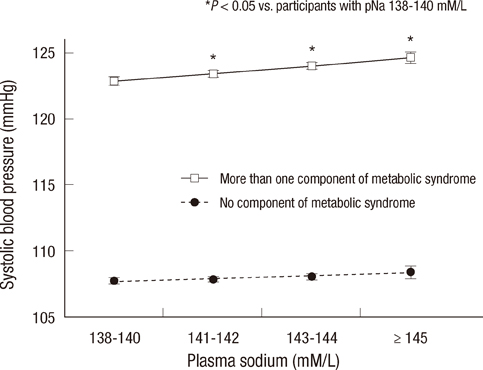
Fig. 3 The distribution of systolic blood pressure (SBP) according to sodium groups in participants with and without components of metabolic syndrome. The SBP is adjusted by age, estimated glomerular filtration rate, body mass index, serum total cholesterol, protein, calcium, phosphorous, glucose, potassium, HDL cholesterol, and alkaline phosphatase using co-variance analysis (ANCOVA). Error bars indicate the standard error of the mean. *P < 0.05 vs participants with pNa 138-140 mM/L.

Fig. 4 Survival curves for all-cause mortality of all participants and women aged ≥ 50 yr according to sodium groups. (A) All participants. The participants were categorized according to plasma sodium: group 1, 138-140 mM/L; group 2, 141-142 mM/L; group 3, 143-144 mM/L; and group 4, ≥ 145 mM/L. (B) Women aged ≥ 50 yr.
Reference
-
1. Lewington S, Clarke R, Qizilbash N, Peto R, Collins R. Prospective Studies Collaboration. Age-specific relevance of usual blood pressure to vascular mortality: a meta-analysis of individual data for one million adults in 61 prospective studies. Lancet. 2002. 360:1903–1913.2. Stamler J, Rose G, Elliott P, Dyer A, Marmot M, Kesteloot H, Stamler R. Findings of the International Cooperative INTERSALT Study. Hypertension. 1991. 17:I9–I15.3. He FJ, Marciniak M, Visagie E, Markandu ND, Anand V, Dalton RN, MacGregor GA. Effect of modest salt reduction on blood pressure, urinary albumin, and pulse wave velocity in white, black, and Asian mild hypertensives. Hypertension. 2009. 54:482–488.4. Bibbins-Domingo K, Chertow GM, Coxson PG, Moran A, Lightwood JM, Pletcher MJ, Goldman L. Projected effect of dietary salt reductions on future cardiovascular disease. N Engl J Med. 2010. 362:590–599.5. De Wardener HE, He FJ, MacGregor GA. Plasma sodium and hypertension. Kidney Int. 2004. 66:2454–2466.6. Reuter S, Büssemaker E, Hausberg M, Pavenstädt H, Hillebrand U. Effect of excessive salt intake: role of plasma sodium. Curr Hypertens Rep. 2009. 11:91–97.7. He FJ, Markandu ND, Sagnella GA, de Wardener HE, MacGregor GA. Plasma sodium: ignored and underestimated. Hypertension. 2005. 45:98–102.8. Suckling RJ, He FJ, Markandu ND, MacGregor GA. Dietary salt influences postprandial plasma sodium concentration and systolic blood pressure. Kidney Int. 2012. 81:407–411.9. Bulpitt CJ, Shipley MJ, Semmence A. Blood pressure and plasma sodium and potassium. Clin Sci (Lond). 1981. 61:Suppl 7. 85s–87s.10. Komiya I, Yamada T, Takasu N, Asawa T, Akamine H, Yagi N, Nagasawa Y, Ohtsuka H, Miyahara Y, Sakai H, et al. An abnormal sodium metabolism in Japanese patients with essential hypertension, judged by serum sodium distribution, renal function and the renin-aldosterone system. J Hypertens. 1997. 15:65–72.11. Wannamethee G, Whincup PH, Shaper AG, Lever AF. Serum sodium concentration and risk of stroke in middle-aged males. J Hypertens. 1994. 12:971–979.12. Schou M, Valeur N, Torp-Pedersen C, Gustafsson F, Køber L. Plasma sodium and mortality risk in patients with myocardial infarction and a low LVEF. Eur J Clin Invest. 2011. 41:1237–1244.13. Guerin MD, Martin AH, Sikaris KA. Change in plasma sodium concentration associated with mortality. Clin Chem. 1992. 38:317.14. Sarhill N, Mahmoud FA, Christie R, Tahir A. Assessment of nutritional status and fluid deficits in advanced cancer. Am J Hosp Palliat Care. 2003. 20:465–473.15. Levey AS, Coresh J, Greene T, Stevens LA, Zhang YL, Hendriksen S, Kusek JW, Van Lente F. Chronic Kidney Disease Epidemiology Collaboration. Using standardized serum creatinine values in the modification of diet in renal disease study equation for estimating glomerular filtration rate. Ann Intern Med. 2006. 145:247–254.16. Grundy SM, Cleeman JI, Daniels SR, Donato KA, Eckel RH, Franklin BA, Gordon DJ, Krauss RM, Savage PJ, Smith SC Jr, et al. Diagnosis and management of the metabolic syndrome: an American Heart Association/National Heart, Lung, and Blood Institute Scientific Statement. Circulation. 2005. 112:2735–2752.17. Oh SW, Baek SH, Kim YC, Goo HS, Heo NJ, Na KY, Chae DW, Kim S, Chin HJ. Mild decrease in estimated glomerular filtration rate and proteinuria are associated with all-cause and cardiovascular mortality in the general population. Nephrol Dial Transplant. 2012. 27:2284–2290.18. Oberleithner H, Riethmüller C, Schillers H, MacGregor GA, de Wardener HE, Hausberg M. Plasma sodium stiffens vascular endothelium and reduces nitric oxide release. Proc Natl Acad Sci U S A. 2007. 104:16281–16286.19. Fujiwara N, Osanai T, Kamada T, Katoh T, Takahashi K, Okumura K. Study on the relationship between plasma nitrite and nitrate level and salt sensitivity in human hypertension: modulation of nitric oxide synthesis by salt intake. Circulation. 2000. 101:856–861.20. Korkushko OV, Asinova MI, Ershova GS. Changes in reactivity of the renin-angiotensin-aldosterone system in old age as a risk factor in the development of hypertension. Kardiologiia. 1985. 25:33–36.21. Chappell MC, Yamaleyeva LM, Westwood BM. Estrogen and salt sensitivity in the female mRen(2): Lewis rat. Am J Physiol Regul Integr Comp Physiol. 2006. 291:R1557–R1563.22. Cohen JA, Lindsey SH, Pirro NT, Brosnihan KB, Gallagher PE, Chappell MC. Influence of estrogen depletion and salt loading on renal angiotensinogen expression in the mRen(2): Lewis strain. Am J Physiol Renal Physiol. 2010. 299:F35–F42.23. Shimamoto K, Hirata A, Fukuoka M, Higashiura K, Miyazaki Y, Shiiki M, Masuda A, Nakagawa M, Iimura O. Insulin sensitivity and the effects of insulin on renal sodium handling and pressor systems in essential hypertensive patients. Hypertension. 1994. 23:I29–I33.24. Chen J, Gu D, Huang J, Rao DC, Jaquish CE, Hixson JE, Chen CS, Chen J, Lu F, Hu D, et al. Metabolic syndrome and salt sensitivity of blood pressure in non-diabetic people in China: a dietary intervention study. Lancet. 2009. 373:829–835.25. Montasser ME, Douglas JA, Roy-Gagnon MH, Van Hout CV, Weir MR, Vogel R, Parsa A, Steinle NI, Snitker S, Brereton NH, et al. Determinants of blood pressure response to low-salt intake in a healthy adult population. J Clin Hypertens (Greenwich). 2011. 13:795–800.26. Chen J. Sodium sensitivity of blood pressure in Chinese populations. Curr Hypertens Rep. 2010. 12:127–134.27. Lee SW, Kim YC, Oh SW, Koo HS, Na KY, Chae DW, Kim S, Chin HJ. Trends in the prevalence of chronic kidney disease, other chronic diseases and health-related behaviors in an adult Korean population: data from the Korean National Health and Nutrition Examination Survey (KNHANES). Nephrol Dial Transplant. 2011. 26:3975–3980.28. U.S. Department of Agriculture, Agricultural Research Service. Nutrient intakes from food: mean amounts consumed per individual, one day, 2005-2006. 2008. accessed on 22 December 2012. Available at http://www.ars.usda.gov/SP2UserFiles/Place/12355000/pdf/0506/Table_1_NIF_05.pdf.29. Sweitzer NK, Shenoy M, Stein JH, Keles S, Palta M, LeCaire T, Mitchell GF. Increases in central aortic impedance precede alterations in arterial stiffness measures in type 1 diabetes. Diabetes Care. 2007. 30:2886–2891.30. Astrup AS, Tarnow L, Pietraszek L, Schalkwijk CG, Stehouwer CD, Parving HH, Rossing P. Markers of endothelial dysfunction and inflammation in type 1 diabetic patients with or without diabetic nephropathy followed for 10 years: association with mortality and decline of glomerular filtration rate. Diabetes Care. 2008. 31:1170–1176.
- Full Text Links
-
- Actions
-
Cited
- CITED
-
- Close
- Share
-
- Similar articles
-
- Immediate Changes of Plasma Potassium , Sodium and Chloride Concentrations After the Intravenous Injection of Single-Dose Diazepam
- Sodium Balance in Maintenance Hemodialysis
- Association between dietary sodium intake and disease burden and mortality in Koreans between 1998 and 2016: The Korea National Health and Nutrition Examination Survey
- A Study on Plasma Antidiuretic Hormone and Serum Sodium Levels of Cord Blood in the Newborn Infants
- High Sodium Intake: Review of Recent Issues on Its Association with Cardiovascular Events and Measurement Methods
