CT Venography for Deep Vein Thrombosis Using a Low Tube Voltage (100 kVp) Setting Could Increase Venous Enhancement and Reduce the Amount of Administered Iodine
- Affiliations
-
- 1Department of Radiology, Yonsei University College of Medicine, Gangnam Severance Hospital, Seoul 135-720, Korea. jjchung@yuhs.ac
- KMID: 1482776
- DOI: http://doi.org/10.3348/kjr.2013.14.2.183
Abstract
OBJECTIVE
To investigate the validity of the 100 kVp setting in CT venography (CTV) in the diagnosis of deep vein thrombosis (DVT), and to evaluate the feasibility of reducing the amount of administered iodine in this setting.
MATERIALS AND METHODS
After receiving the contrast medium (CM) of 2.0 mL/kg, 88 patients underwent CTV of the pelvis and lower extremities by using one of four protocols: Group A, 120 kVp setting and 370 mgI/mL CM; group B, 120 kVp and 300 mgI/mL; group C, 100 kVp and 370 mgI/mL; group D, 100 kVp and 300 mgI/mL. The groups were evaluated for venous attenuation, vein-to-muscle contrast-to-noise ratio (CNRVEIN), DVT-to-vein contrast-to-noise ratio (CNRDVT), and subjective degree of venous enhancement and image quality.
RESULTS
Venous attenuation and CNRVEIN were significantly higher in group C (144.3 Hounsfield unit [HU] and 11.9), but there was no significant difference between group A (118.0 HU and 8.2) and D (122.4 HU and 7.9). The attenuation value of DVT was not significantly different among the four groups, and group C had a higher absolute CNRDVT than the other groups. The overall diagnostic image quality and venous enhancement were significantly higher in group C, but there was no difference between groups A and D.
CONCLUSION
The 100 kVp setting in CTV substantially help improve venous enhancement and CNRVEIN. Furthermore, it enables to reduce the amount of administered iodine while maintaining venous attenuation, as compared with the 120 kVp setting.
Keyword
MeSH Terms
-
Contrast Media/administration & dosage
Feasibility Studies
Female
Humans
Iohexol/administration & dosage/analogs & derivatives
Linear Models
Lower Extremity/blood supply/*radiography
Male
Middle Aged
Phantoms, Imaging
Phlebography/*methods
Statistics, Nonparametric
Tomography, X-Ray Computed/*methods
Venous Thrombosis/*radiography
Contrast Media
Iohexol
Figure
-
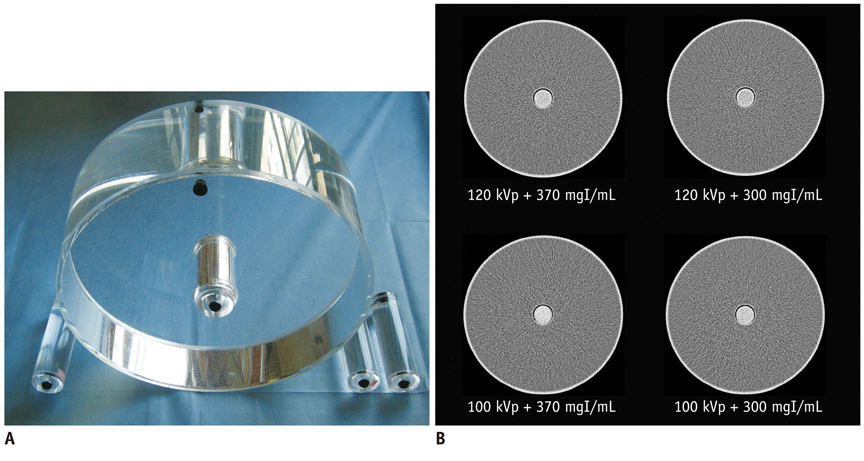
Fig. 1 Cylindrical water phantom and CT images of phantom. A. 300 mm-diameter cylindrical water phantom simulated abdomen of patients with intermediate body weight. 25 mm-diameter tube filled with diluted contrast medium (CM) was inserted into center of phantom. B. Transverse 1 mm CT scans of phantom obtained at 120 kVp with 1.4% 370 mgI/mL CM, 120 kVp with 1.4% 300 mgI/mL CM, 100 kVp with 1.4% 370 mgI/mL CM, and 100 kVp with 1.4% 300 mgI/mL CM. 1.4% concentration of CM in tube resulted in mean CT attenuation values most similar to those obtained for CT venography in clinical studies (113.0 Hounsfield unit (HU) in 120 kVp with 370 mgI/mL CM, 94.2 HU in 120 kVp with 300 mgI/mL CM, 145.0 HU in 100 kVp with 370 mgI/mL CM, and 116.0 HU in 100 kVp with 300 mgI/mL CM).
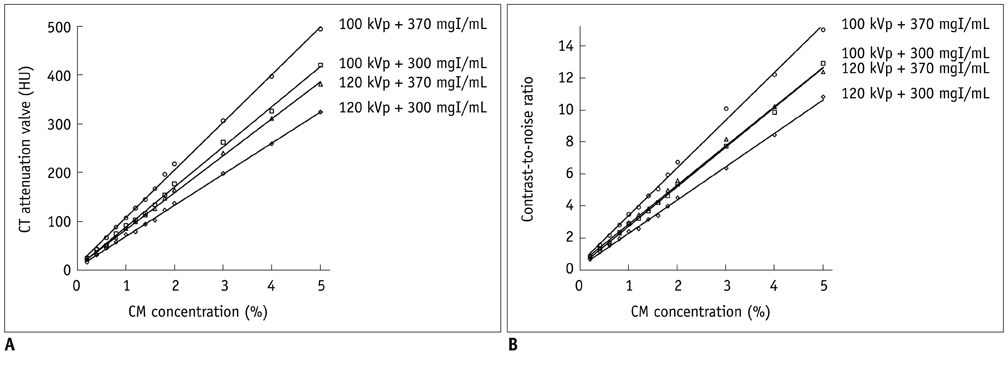
Fig. 2 Graphs showing results of phantom study. A. Relationship between CT attenuation value and contrast medium (CM) concentration was: for 100 kVp with high concentration CM (HC-CM), y = 97.7x + 10.3 (r = 0.999); for 100 kVp with moderate concentration CM (MC-CM), y = 82.2x + 6.4 (r = 0.998); for 120 kVp with HC-CM, y = 75.7x + 7.8 (r = 0.999); and for 120 kVp with MC-CM, y = 63.7x + 5.7 (r = 0.999). B. Relationship between contrast-to-noise ratio (CNR) and CM concentration was: for 100 kVp with HC-CM, y = 3.0x + 0.5 (r = 0.996); for 100 kVp with MC-CM, y = 2.5x + 0.3 (r = 0.998); for 120 kVp with HC-CM, y = 2.5x + 0.4 (r = 0.997); and for 120 kVp with MC-CM, y = 2.1x + 0.3 (r = 0.999).

Fig. 3 Graphs showing results of clinical study. Box-and-whisker plot showing median (middle line of each box), quartiles (top and bottom lines of each box), and upper and lower adjacent (upper and lower whiskers for each box) of mean attenuation value of veins (A), vein-to-muscle contrast-to-noise ratio (CNRVEIN) (B), mean attenuation value of deep vein thrombosis (DVT) (C), and DVT-to-vein contrast-to-noise ratio (CNRDVT) (D). Dotted lines = no significant difference between two groups. Solid lines = significant difference between two groups. A, B. Mean venous attenuation value and CNRVEIN in group C (100 kVp and 370 mgI/mL setting) were significantly higher than those of other groups. There was no difference in venous attenuation value and CNRVEIN between group A (120 kVp and 370 mgI/mL setting) and group D (100 kVp and 300 mgI/mL setting). C, D. Mean DVT attenuation value and CNRDVT was not significantly different among four groups. CNRDVT in group C was lower than that of other groups but this was not significant.
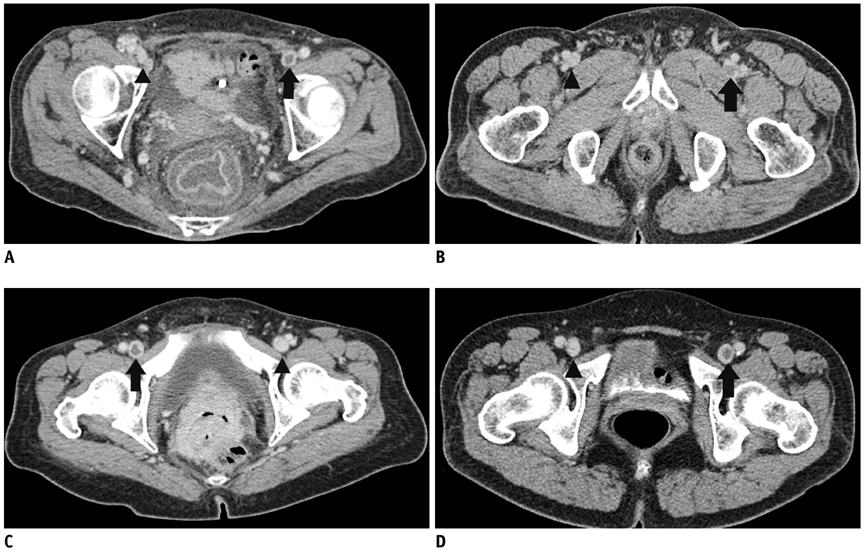
Fig. 4 Comparison of attenuations of veins and deep vein thrombosis (DVT) on axial CTV images obtained in (A) 120 kVp and 370 mgI/mL setting, (B) 120 kVp and 300 mgI/mL setting, (C) 100 kVp and 370 mgI/mL setting, and (D) 100 kVp and 300 mgI/mL contrast medium setting from representative patient of each group. Attenuation values and vein-to-muscle contrast-to-noise ratio of non-thrombosed vein (arrow head) in these patients were 124.3 HU and 8.2 in (A), 98.1 HU and 6.5 in (B), 144.1 HU and 12.3 in (C), and 129.4 HU and 8.9 in (D). Attenuation values of DVT (arrow) and DVT-to-vein contrast-to-noise ratio were 32.8 HU and -14.8 in (A), 50.2 HU and -8.3 in (B), 43.4 HU and -16.8 in (C), and 28.4 HU and -14.9 in (D). Subjective scores for venous enhancement, image noise, and overall diagnostic image quality were 2.0, 3.0, and 3.0 in (A), 2.0, 3.0, and 2.0 in (B), 3.0, 3.0, and 3.0 in (C), and 2.0, 3.0, and 3.0 in (D). CVT = computed tomoraphy venography, HU = Hounsfield unit
Cited by 2 articles
-
Image Quality and Radiation Dose in CT Venography Using Model-Based Iterative Reconstruction at 80 kVp versus Adaptive Statistical Iterative Reconstruction-V at 70 kVp
Chankue Park, Ki Seok Choo, Jin Hyeok Kim, Kyung Jin Nam, Ji Won Lee, Jin You Kim
Korean J Radiol. 2019;20(7):1167-1175. doi: 10.3348/kjr.2018.0897.Comparison of Image Qualities of 80 kVp and 120 kVp CT Venography Using Model-Based Iterative Reconstruction at Same Radiation Dose
Hyun Jung Baek, Ki Seok Choo, Kyung Jin Nam, Jae-Yeon Hwang, Ji Won Lee, Jin You Kim, Hyuk Jae Jung
J Korean Soc Radiol. 2018;78(4):235-241. doi: 10.3348/jksr.2018.78.4.235.
Reference
-
1. Hirsh J, Hoak J. Management of deep vein thrombosis and pulmonary embolism. A statement for healthcare professionals. Council on Thrombosis (in consultation with the Council on Cardiovascular Radiology), American Heart Association. Circulation. 1996. 93:2212–2245.2. Byun SS, Kim JH, Kim YJ, Jeon YS, Park CH, Kim WH. Evaluation of deep vein thrombosis with multidetector row CT after orthopedic arthroplasty: a prospective study for comparison with Doppler sonography. Korean J Radiol. 2008. 9:59–66.3. Cham MD, Yankelevitz DF, Shaham D, Shah AA, Sherman L, Lewis A, et al. The Pulmonary Angiography-Indirect CT Venography Cooperative Group. Deep venous thrombosis: detection by using indirect CT venography. Radiology. 2000. 216:744–751.4. Loud PA, Katz DS, Bruce DA, Klippenstein DL, Grossman ZD. Deep venous thrombosis with suspected pulmonary embolism: detection with combined CT venography and pulmonary angiography. Radiology. 2001. 219:498–502.5. Duwe KM, Shiau M, Budorick NE, Austin JH, Berkmen YM. American Roentgen Ray Society. Evaluation of the lower extremity veins in patients with suspected pulmonary embolism: a retrospective comparison of helical CT venography and sonography. 2000 ARRS Executive Council Award I. AJR Am J Roentgenol. 2000. 175:1525–1531.6. Lim KE, Hsu WC, Hsu YY, Chu PH, Ng CJ. Deep venous thrombosis: comparison of indirect multidetector CT venography and sonography of lower extremities in 26 patients. Clin Imaging. 2004. 28:439–444.7. Yavas US, Calisir C, Ozkan IR. The interobserver agreement between residents and experienced radiologists for detecting pulmonary embolism and DVT with using CT pulmonary angiography and indirect CT venography. Korean J Radiol. 2008. 9:498–502.8. Arakawa H, Kohno T, Hiki T, Kaji Y. CT pulmonary angiography and CT venography: factors associated with vessel enhancement. AJR Am J Roentgenol. 2007. 189:156–161.9. Lee W, Chung JW, Yin YH, Jae HJ, Kim SJ, Ha J, et al. Three-Dimensional CT venography of varicose veins of the lower extremity: image quality and comparison with doppler sonography. AJR Am J Roentgenol. 2008. 191:1186–1191.10. Taffoni MJ, Ravenel JG, Ackerman SJ. Prospective comparison of indirect CT venography versus venous sonography in ICU patients. AJR Am J Roentgenol. 2005. 185:457–462.11. Begemann PG, Bonacker M, Kemper J, Guthoff AE, Hahn KE, Steiner P, et al. Evaluation of the deep venous system in patients with suspected pulmonary embolism with multi-detector CT: a prospective study in comparison to Doppler sonography. J Comput Assist Tomogr. 2003. 27:399–409.12. Stein PD, Fowler SE, Goodman LR, Gottschalk A, Hales CA, Hull RD, et al. Multidetector computed tomography for acute pulmonary embolism. N Engl J Med. 2006. 354:2317–2327.13. Kalva SP, Jagannathan JP, Hahn PF, Wicky ST. Venous thromboembolism: indirect CT venography during CT pulmonary angiography--should the pelvis be imaged? Radiology. 2008. 246:605–611.14. Goodman LR, Stein PD, Matta F, Sostman HD, Wakefield TW, Woodard PK, et al. CT venography and compression sonography are diagnostically equivalent: data from PIOPED II. AJR Am J Roentgenol. 2007. 189:1071–1076.15. Curry TS, Dowdey JE, Murry RC. Curry TS, Dowdey JE, Murry RC, editors. Christensen's physics of diagnostic radiology. Basic interactions between X-rays and matter. 1990. 4th ed. Philadelphia, PA: Lippincott Williams & Wilkins;61–69.16. Schindera ST, Graca P, Patak MA, Abderhalden S, von Allmen G, Vock P, et al. Thoracoabdominal-aortoiliac multidetector-row CT angiography at 80 and 100 kVp: assessment of image quality and radiation dose. Invest Radiol. 2009. 44:650–655.17. Schueller-Weidekamm C, Schaefer-Prokop CM, Weber M, Herold CJ, Prokop M. CT angiography of pulmonary arteries to detect pulmonary embolism: improvement of vascular enhancement with low kilovoltage settings. Radiology. 2006. 241:899–907.18. Waaijer A, Prokop M, Velthuis BK, Bakker CJ, de Kort GA, van Leeuwen MS. Circle of Willis at CT angiography: dose reduction and image quality--reducing tube voltage and increasing tube current settings. Radiology. 2007. 242:832–839.19. Fujikawa A, Matsuoka S, Kuramochi K, Yoshikawa T, Yagihashi K, Kurihara Y, et al. Vascular enhancement and image quality of CT venography: comparison of standard and low kilovoltage settings. AJR Am J Roentgenol. 2011. 197:838–843.20. Nakaura T, Awai K, Oda S, Yanaga Y, Namimoto T, Harada K, et al. A low-kilovolt (peak) high-tube current technique improves venous enhancement and reduces the radiation dose at indirect multidetector-row CT venography: initial experience. J Comput Assist Tomogr. 2011. 35:141–147.21. Oda S, Utsunomiya D, Awai K, Takaoka H, Nakaura T, Katahira K, et al. Indirect computed tomography venography with a low-tube-voltage technique: reduction in the radiation and contrast material dose--a prospective randomized study. J Comput Assist Tomogr. 2011. 35:631–636.22. Menke J. Comparison of different body size parameters for individual dose adaptation in body CT of adults. Radiology. 2005. 236:565–571.23. Szucs-Farkas Z, Semadeni M, Bensler S, Patak MA, von Allmen G, Vock P, et al. Endoleak detection with CT angiography in an abdominal aortic aneurysm phantom: effect of tube energy, simulated patient size, and physical properties of endoleaks. Radiology. 2009. 251:590–598.24. Yankelevitz DF, Gamsu G, Shah A, Rademaker J, Shaham D, Buckshee N, et al. Optimization of combined CT pulmonary angiography with lower extremity CT venography. AJR Am J Roentgenol. 2000. 174:67–69.25. Wintersperger B, Jakobs T, Herzog P, Schaller S, Nikolaou K, Suess C, et al. Aorto-iliac multidetector-row CT angiography with low kV settings: improved vessel enhancement and simultaneous reduction of radiation dose. Eur Radiol. 2005. 15:334–341.26. Goo HW. CT radiation dose optimization and estimation: an update for radiologists. Korean J Radiol. 2012. 13:1–11.27. Landis JR, Koch GG. The measurement of observer agreement for categorical data. Biometrics. 1977. 33:159–174.28. Huda W, Scalzetti EM, Levin G. Technique factors and image quality as functions of patient weight at abdominal CT. Radiology. 2000. 217:430–435.29. Goodman LR, Gulsun M, Nagy P, Washington L. CT of deep venous thrombosis and pulmonary embolus: does iso-osmolar contrast agent improve vascular opacification? Radiology. 2005. 234:923–928.30. Reichert M, Henzler T, Krissak R, Apfaltrer P, Huck K, Buesing K, et al. Venous thromboembolism: additional diagnostic value and radiation dose of pelvic CT venography in patients with suspected pulmonary embolism. Eur J Radiol. 2011. 80:50–53.
- Full Text Links
-
- Actions
-
Cited
- CITED
-
- Close
- Share
-
- Similar articles
-
- Significance of Contrast Enhanced Rapid MR Sequence(True FISP) in Deep Vein Thrombosis
- The Incidence of Deep Vein Thrombosis in the Lower Extremity
- Gadolinium-Enhanced 3D Fast Imaging Steady-State Procession(FISP) MR Venography in the Deep Vein Thrombosis of Low Extremities
- Image Quality and Radiation Dose in CT Venography Using Model-Based Iterative Reconstruction at 80 kVp versus Adaptive Statistical Iterative Reconstruction-V at 70 kVp
- Adventitial Cystic Disease of the Common Femoral Vein Mimicking Deep Venous Thrombosis: A Case Report
