A Formula to Predict Spectral Domain Optical Coherence Tomography (OCT) Retinal Nerve Fiber Layer Measurements Based on Time Domain OCT Measurements
- Affiliations
-
- 1Department of Ophthalmology, Inha University School of Medicine, Incheon, Korea. nrkim@inha.ac.kr
- 2Department of Research Affairs, Yonsei University College of Medicine, Seoul, Korea.
- 3Institute of Vision Research, Department of Ophthalmology, Yonsei University College of Medicine, Seoul, Korea.
- KMID: 1397488
- DOI: http://doi.org/10.3341/kjo.2012.26.5.369
Abstract
- PURPOSE
To establish and validate a formula to predict spectral domain (SD)-optical coherence tomography (OCT) retinal nerve fiber layer (RNFL) thickness from time domain (TD)-OCT RNFL measurements and other factors.
METHODS
SD-OCT and TD-OCT scans were obtained on the same day from healthy participants and patients with glaucoma. Univariate and multivariate linear regression relationships were analyzed to convert average Stratus TD-OCT measurements to average Cirrus SD-OCT measurements. Additional baseline characteristics included age, sex, intraocular pressure, central corneal thickness, spherical equivalent, anterior chamber depth, optic disc area, visual field (VF) mean deviation, and pattern standard deviation. The formula was generated using a training set of 220 patients and then evaluated on a validation dataset of 105 patients.
RESULTS
The training set included 71 healthy participants and 149 patients with glaucoma. The validation set included 27 healthy participants and 78 patients with glaucoma. Univariate analysis determined that TD-OCT RNFL thickness, age, optic disc area, VF mean deviation, and pattern standard deviation were significantly associated with SD-OCT RNFL thickness. Multivariate regression analysis using available variables yielded the following equation: SD-OCT RNFL = 0.746 x TD-OCT RNFL + 17.104 (determination coefficient [R2] = 0.879). In the validation sample, the multiple regression model explained 85.6% of the variance in the SD-OCT RNFL thickness.
CONCLUSIONS
The proposed formula based on TD-OCT RNFL thickness may be useful in predicting SD-OCT RNFL thickness. Other factors associated with SD-OCT RNFL thickness, such as age, disc area, and mean deviation, did not contribute to the accuracy of the final equation.
Keyword
MeSH Terms
Figure
-

Fig. 1 Relationship between thicknesses of spectral domain (SD)-optical coherence tomography (OCT) retinal nerve fiber layer (RNFL) and time domain (TD)-OCT RNFL (slope = 1.181, p < 0.001; intercept = -9.497; adjusted determination coefficient = 0.872; standard error of estimate = 6.61).

Fig. 2 Bland-Altman plot comparing the mean retinal nerve fiber layer (RNFL) thickness measurements obtained with spectral domain (SD)-optical coherence tomography (OCT) and time domain (TD)-OCT. The difference between both measurements is plotted against the average of both measurements (slope = -0.233, p < 0.001). Mean difference ± standard deviation: SD-OCT minus TD-OCT, -5.67 ± 7.11 µm; 95% confidence interval, -6.44 to -4.89; limits of agreement, -19.6 to 8.3 µm.
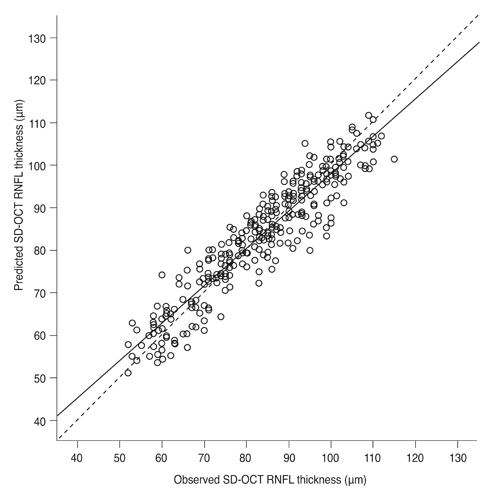
Fig. 3 Relationship between observed and predicted spectral domain (SD)-optical coherence tomography (OCT) retinal nerve fiber layer (RNFL) thickness (slope = 0.881, p < 0.001; intercept = 10.019; adjusted determination coefficient = 0.872; standard error of estimate = 4.93).

Fig. 4 Bland-Altman plot showing observed versus predicted spectral domain (SD)-optical coherence tomography (OCT) retinal nerve fiber layer (RNFL) thickness. The difference between both measurements is plotted against the average of both measurements (slope = 0.060, p = 0.004). Mean difference ± standard deviation: observed minus predicted, -0.04 ± 5.22 µm; 95% confidence interval, -0.61 to 0.53; limits of agreement, -10.3 to 10.2 µm).
Reference
-
1. Quigley HA, Dunkelberger GR, Green WR. Retinal ganglion cell atrophy correlated with automated perimetry in human eyes with glaucoma. Am J Ophthalmol. 1989. 107:453–464.2. Quigley HA, Miller NR, George T. Clinical evaluation of nerve fiber layer atrophy as an indicator of glaucomatous optic nerve damage. Arch Ophthalmol. 1980. 98:1564–1571.3. Sommer A, Miller NR, Pollack I, et al. The nerve fiber layer in the diagnosis of glaucoma. Arch Ophthalmol. 1977. 95:2149–2156.4. Giangiacomo A, Garway-Heath D, Caprioli J. Diagnosing glaucoma progression: current practice and promising technologies. Curr Opin Ophthalmol. 2006. 17:153–162.5. Schuman JS, Hee MR, Puliafito CA, et al. Quantification of nerve fiber layer thickness in normal and glaucomatous eyes using optical coherence tomography. Arch Ophthalmol. 1995. 113:586–596.6. Kim NR, Lee ES, Seong GJ, et al. Spectral-domain optical coherence tomography for detection of localized retinal nerve fiber layer defects in patients with open-angle glaucoma. Arch Ophthalmol. 2010. 128:1121–1128.7. Leitgeb R, Hitzenberger C, Fercher A. Performance of fourier domain vs. time domain optical coherence tomography. Opt Express. 2003. 11:889–894.8. Knight OJ, Chang RT, Feuer WJ, Budenz DL. Comparison of retinal nerve fiber layer measurements using time domain and spectral domain optical coherent tomography. Ophthalmology. 2009. 116:1271–1277.9. Huang J, Liu X, Wu Z, et al. Macular and retinal nerve fiber layer thickness measurements in normal eyes with the Stratus OCT, the Cirrus HD-OCT, and the Topcon 3D OCT-1000. J Glaucoma. 2011. 20:118–125.10. Takagishi M, Hirooka K, Baba T, et al. Comparison of retinal nerve fiber layer thickness measurements using time domain and spectral domain optical coherence tomography, and visual field sensitivity. J Glaucoma. 2011. 20:383–387.11. Vizzeri G, Weinreb RN, Gonzalez-Garcia AO, et al. Agreement between spectral-domain and time-domain OCT for measuring RNFL thickness. Br J Ophthalmol. 2009. 93:775–781.12. Hood DC, Raza AS, Kay KY, et al. A comparison of retinal nerve fiber layer (RNFL) thickness obtained with frequency and time domain optical coherence tomography (OCT). Opt Express. 2009. 17:3997–4003.13. Gonzalez-Garcia AO, Vizzeri G, Bowd C, et al. Reproducibility of RTVue retinal nerve fiber layer thickness and optic disc measurements and agreement with Stratus optical coherence tomography measurements. Am J Ophthalmol. 2009. 147:1067–1074. 1074.e114. Sung KR, Kim DY, Park SB, Kook MS. Comparison of retinal nerve fiber layer thickness measured by Cirrus HD and Stratus optical coherence tomography. Ophthalmology. 2009. 116:1264–1270. 1270.e115. Hong S, Seong GJ, Kim SS, et al. Comparison of peripapillary retinal nerve fiber layer thickness measured by spectral vs. time domain optical coherence tomography. Curr Eye Res. 2011. 36:125–134.16. Lim MC, Tanimoto SA, Furlani BA, et al. Effect of diabetic retinopathy and panretinal photocoagulation on retinal nerve fiber layer and optic nerve appearance. Arch Ophthalmol. 2009. 127:857–862.17. Katz BJ, Pomeranz HD. Visual field defects and retinal nerve fiber layer defects in eyes with buried optic nerve drusen. Am J Ophthalmol. 2006. 141:248–253.18. Moschos MM, Triglianos A, Rotsos T, et al. Tilted disc syndrome: an OCT and mfERG study. Doc Ophthalmol. 2009. 119:23–28.19. Bland JM, Altman DG. Statistical methods for assessing agreement between two methods of clinical measurement. Lancet. 1986. 1:307–310.20. Moreno-Montanes J, Olmo N, Alvarez A, et al. Cirrus high-definition optical coherence tomography compared with Stratus optical coherence tomography in glaucoma diagnosis. Invest Ophthalmol Vis Sci. 2010. 51:335–343.21. Leung CK, Cheung CY, Weinreb RN, et al. Retinal nerve fiber layer imaging with spectral-domain optical coherence tomography: a variability and diagnostic performance study. Ophthalmology. 2009. 116:1257–1263. 1263.e1–1263.e2.22. Huang D, Swanson EA, Lin CP, et al. Optical coherence tomography. Science. 1991. 254:1178–1181.23. Mwanza JC, Chang RT, Budenz DL, et al. Reproducibility of peripapillary retinal nerve fiber layer thickness and optic nerve head parameters measured with cirrus HD-OCT in glaucomatous eyes. Invest Ophthalmol Vis Sci. 2010. 51:5724–5730.24. Wu H, de Boer JF, Chen TC. Reproducibility of retinal nerve fiber layer thickness measurements using spectral domain optical coherence tomography. J Glaucoma. 2011. 20:470–476.25. Wu Z, Vazeen M, Varma R, et al. Factors associated with variability in retinal nerve fiber layer thickness measurements obtained by optical coherence tomography. Ophthalmology. 2007. 114:1505–1512.26. Lee ES, Kim NR, Seong GJ, et al. Effect of signal strength on agreements for retinal nerve fiber layer thickness measurement and its color code classification between Stratus and Cirrus optical coherence tomography. J Glaucoma. 2011. 20:371–376.
- Full Text Links
-
- Actions
-
Cited
- CITED
-
- Close
- Share
-
- Similar articles
-
- Comparison of Retinal Nerve Fiber Layer Thickness Measured by Spectral-Domain and Time-Domain Optical Coherence Tomography
- Comparison of Time Domain OCT and Spectrum Domain OCT for Retinal Nerve Fiber Layer Assessment
- Spectral-Domain Optical Coherence Tomography Findings in Acute Central Retinal Artery Occlusion
- Retinal Nerve Fiber Layer Thickness Measured with Two Different Spectral Domain Optical Coherence Tomography Devices
- Comparison of Retinal Nerve Fiber Layer Thickness between Stratus and Spectralis OCT
