Assessment of glomerular filtration rate with dynamic computed tomography in normal Beagle dogs
- Affiliations
-
- 1Department of Medical Imaging, College of Veterinary Medicine, and Research Institute for Veterinary Science, Seoul National University, Seoul 151-742, Korea. mcchoi@snu.ac.kr
- 2Department of Nuclear Medicine, College of Medicine and Institute of Radiation Medicine, Medical Research Center, Seoul National University, Seoul 110-460, Korea.
- 3Department of Medical Imaging, College of Veterinary Medicine, Gyeongsang National University, Jinju 600-701, Korea.
- 4Department of Medical Imaging, College of Veterinary Medicine, Chungbuk National University, Cheongju 361-763, Korea.
- 5Department of Diagnostic Imaging, College of Veterinary Medicine, Chungnam National University, Daejeon 305-764, Korea.
- KMID: 1365024
- DOI: http://doi.org/10.4142/jvs.2011.12.4.393
Abstract
- The objective of our study was to determine individual and global glomerular filtration rates (GFRs) using dynamic renal computed tomography (CT) in Beagle dogs. Twenty-four healthy Beagle dogs were included in the experiment. Anesthesia was induced in all dogs by using propofol and isoflurane prior to CT examination. A single slice of the kidney was sequentially scanned after a bolus intravenous injection of contrast material (iohexol, 1 mL/kg, 300 mgI/mL). Time attenuation curves were created and contrast clearance per unit volume was calculated using a Patlak plot analysis. The CT-GFR was then determined based on the conversion of contrast clearance per unit volume to contrast clearance per body weight. At the renal hilum, CT-GFR values per unit renal volume (mL/min/mL) of the right and left kidneys were 0.69 +/- 0.04 and 0.57 +/- 0.05, respectively. No significant differences were found between the weight-adjusted CT-GFRs in either kidney at the same renal hilum (p = 0.747). The average global GFR was 4.21 +/- 0.25 mL/min/kg and the whole kidney GFR was 33.43 +/- 9.20 mL/min. CT-GFR techniques could be a practical way to separately measure GFR in each kidney for clinical and research purposes.
Keyword
MeSH Terms
Figure
-
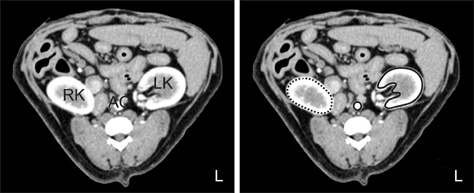
Fig. 1 Dynamic CT images centered in the left renal hilum obtained at maximal aortic enhancement with iohexol. The black circle indicates the aorta, the black line indicates the left kidney, and the dotted line indicates the right kidney. Regions of interest (ROI) are drawn around the aorta as well as left and right kidneys. Vessels and fatty tissue are excluded from the ROIs. LK: left kidney, RK: right kidney, AO: aorta.
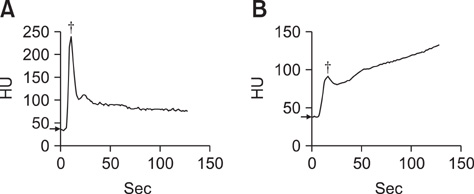
Fig. 2 Time attenuation curves (TACs) showing iohexol concentrations in the aortic blood (A) and left kidney (B) of a dog. The threshold (arrow) is the background Hounsfield unit (HU) value of the aortic (A) and renal (B) ROIs. The initial postcontrast aortic and renal peak enhancements and their times are shown (cross mark).
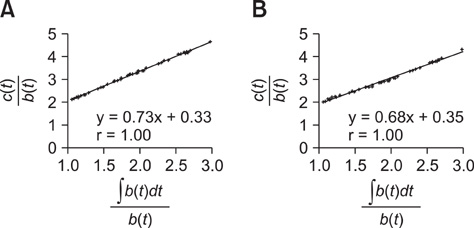
Fig. 3 Patlak plots of the right (A) and left (B) kidneys of a Beagle dog. The slope represents the blood clearance (mL/min/unit volume), and the y-intercept indicates the fractional vascular volume (%). Components c(t) and b(t) are the CT values from which the baseline has been subtracted of the renal ROI and the aorta.
Reference
-
1. Alexander K, del Castillo JRE, Ybarra N, Morin V, Gauvin D, Authier S, Vinay P, Troncy É. Single-slice dynamic computed tomographic determination of glomerular filtration rate by use of Patlak plot analysis in anesthetized pigs. Am J Vet Res. 2007. 68:297–304.
Article2. Blomley MJ, Dawson P. Review article: the quantification of renal function with enhanced computed tomography. Br J Radiol. 1996. 69:989–995.3. Brown SC, O'Reilly PH. Iohexol clearance for the determination of glomerular filtration rate in clinical practice: evidence for a new gold standard. J Urol. 1991. 146:675–679.
Article4. Chang J, Kim S, Jung J, Lee H, Chang D, Lee Y, Lee I, Yoon J, Choi M. Evaluation of the effects of thiopental, propofol, and etomidate on glomerular filtration rate measured by the use of dynamic computed tomography in dogs. Am J Vet Res. 2011. 72:146–151.
Article5. Cohan RH, Sherman LS, Korobkin M, Bass JC, Francis IR. Renal masses: assessment of corticomedullary-phase and nephrographic phase CT scans. Radiology. 1995. 196:445–451.
Article6. Dachman AH, Newmark GM, Mitchell MT, Woodle ES. Helical CT examination of potential kidney donors. AJR Am J Roentgenol. 1998. 171:193–200.
Article7. Dawson P. Dynamic contrast-enhanced functional imaging with multi-slice CT. Acad Radiol. 2002. 9:Suppl 2. S368–S370.
Article8. Dawson P. Functional imaging in CT. Eur J Radiol. 2006. 60:331–340.
Article9. Dawson P, Peters M. Dynamic contrast bolus computed tomography for the assessment of renal function. Invest Radiol. 1993. 28:1039–1042.
Article10. Frennby B, Sterner G. Contrast media as markers of GFR. Eur Radiol. 2002. 12:475–484.
Article11. Gleadhill A, Peters AM, Michell AR. A simple method for measuring glomerular filtration rate in dogs. Res Vet Sci. 1995. 59:118–123.
Article12. Hackstein N, Heckrodt J, Rau WS. Measurement of single-kidney glomerular filtration rate using a contrast-enhanced dynamic gradient-echo sequence and the Rutland-Patlak plot technique. J Magn Reson Imaging. 2003. 18:714–725.
Article13. Herts BR, Coll DM, Lieber ML, Streem SB, Novick AC. Triphasic helical CT of the kidneys: contribution of vascular phase scanning in patients before urologic surgery. AJR Am J Roentgenol. 1999. 173:1273–1277.
Article14. Heymsfield SB, Fulenwider T, Nordlinger B, Barlow R, Sones P, Kutner M. Accurate measurement of liver, kidney, and spleen volume and mass by computerized axial tomography. Ann Intern Med. 1979. 90:185–187.
Article15. Kampa N, Wennstrom U, Lord P, Twardock R, Maripuu E, Eksell P, Fredriksson SO. Effect of region of interest selection and uptake measurement on glomerular filtration rate measured by 99mTc-DTPA scintigraphy in dogs. Vet Radiol Ultrasound. 2002. 43:383–391.
Article16. Kopka L, Fischer U, Zoeller G, Schmidt C, Ringert RH, Grabbe E. Dual-phase helical CT of the kidney: value of the corticomedullary and nephrographic phase for evaluation of renal lesions and preoperative staging of renal cell carcinoma. AJR Am J Roentgenol. 1997. 169:1573–1578.
Article17. Laroute V, Lefebvre HP, Costes G, Toutain PL. Measurement of glomerular filtration rate and effective renal plasma flow in the conscious beagle dog by single intravenous bolus of iohexol and p-aminohippuric acid. J Pharmacol Toxicol Methods. 1999. 41:17–25.
Article18. Miles K, Dawson P, Blomley M. Functional Computed Tomography. 1997. 1st ed. Oxford: Isis Medical Media;117–132.19. Miles KA, Leggett DA, Bennett GA. CT derived Patlak images of the human kidney. Br J Radiol. 1999. 72:153–158.
Article20. O'Dell-Anderson KJ, Twardock R, Grimm JB, Grimm KA, Constable PD. Determination of glomerular filtration rate in dogs using contrast-enhanced computed tomography. Vet Radiol Ultrasound. 2006. 47:127–135.21. Rubin GD, Dake MD, Napel SA, McDonnell CH, Jeffrey RB Jr. Three-dimensional spiral CT angiography of the abdomen: initial clinical experience. Radiology. 1993. 186:147–152.
Article22. Sanaei-Ardekani M, Movahed MR, Movafagh S, Ghahramani N. Contrast-induced nephropathy: a review. Cardiovasc Revasc Med. 2005. 6:82–88.
Article23. Smith HW. The Kidney: Structure and Function in Health and Disease. 1951. 1st ed. New York: Oxford University Press;47–48.24. Sommer FG. Can single-kidney glomerular filtration rate be determined with contrast-enhanced CT? Radiology. 2007. 242:325–326.
Article25. Staron RB, Ford E. Computed tomographic volumetric calculation reproducibility. Invest Radiol. 1986. 21:272–274.
Article26. Szolar DH, Kammerhuber F, Altziebler S, Tillich M, Breinl E, Fotter R, Schreyer HH. Multiphasic helical CT of the kidney: increased conspicuity for detection and characterization of small (<3-cm) renal masses. Radiology. 1997. 202:211–217.
Article27. Toto RD. Conventional measurement of renal function utilizing serum creatinine, creatinine clearance, inulin and para-aminohippuric acid clearance. Curr Opin Nephrol Hypertens. 1995. 4:505–509.
Article28. Tsushima Y. Functional CT of the kidney. Eur J Radiol. 1999. 30:191–197.
Article29. Tsushima Y, Blomley MJ, Kusano S, Endo K. Use of contrast-enhanced computed tomography to measure clearance per unit renal volume: A novel measurement of renal function and fractional vascular volume. Am J Kidney Dis. 1999. 33:754–760.
Article30. Tsushima Y, Blomley MJ, Okabe K, Tsuchiya K, Aoki J, Endo K. Determination of glomerular filtration rate per unit renal volume using computerized tomography: correlation with conventional measures of total and divided renal function. J Urol. 2001. 165:382–385.
Article31. Tsushima Y, Taketomi-Takahashi A, Endo K. Patlak plot analysis for assessment of single-kidney glomerular filtration rate with dynamic CT. Radiology. 2008. 246:336–338.
Article32. Urban BA. The small renal mass: what is the role of multiphasic helical scanning? Radiology. 1997. 202:22–23.
Article33. Verlander JW. Cunningham JG, Klein BG, editors. Glomerular filtration. Textbook of Veterinary Physiology. 2007. 4th ed. St. Louis: Saunders;528–536.
Article
- Full Text Links
-
- Actions
-
Cited
- CITED
-
- Close
- Share
-
- Similar articles
-
- Evaluation of 3 Cases of Renal Injuries with Dynamic Computed Tomography
- The Value of Serum Concentration of Cystatin C as a Marker for Glomerular Filtration Rate in Children and Adolescents
- Evaluation of gallbladder and common bile duct size and appearance by computed tomography in dogs
- Computed tomographic anatomy of hepatic artery in normal beagle dogs
- Measurement of glomerular filtration rate with radionuclide plasma clearence method
