New Statistical Method to Analyze Three-Dimensional Landmark Configurations Obtained with Cone-Beam CT: Basic Features and Clinical Application for Rapid Maxillary Expansion
- Affiliations
-
- 1Orthodontic Graduate Program, Faculty of Medicine and Dentistry, University of Alberta, Edmonton, AB T6G 2N8, Canada. gheo@ualberta.ca
- 2Department of Dentistry, Faculty of Medicine and Dentistry, University of Alberta, Edmonton, AB T6G 2N8, Canada.
- KMID: 1245376
- DOI: http://doi.org/10.3348/kjr.2012.13.2.126
Abstract
OBJECTIVE
To describe a statistical method of three-dimensional landmark configuration data and apply it to an orthodontic data set comparing two types of rapid maxillary expansion (RME) treatments.
MATERIALS AND METHODS
Landmark configurations obtained from cone beam CT scans were used to represent patients in two types (please describe what were two types) of RME groups and a control group over four time points. A method using tools from persistent homology and dimensionality reduction is presented and used to identify variability between the subjects.
RESULTS
The analysis was in agreement with previous results using conventional methods, which found significant differences between treatment groups and the control, but no distinction between the types of treatment. Additionally, it was found that second molar eruption varied considerably between the subjects, and this has not been evaluated in previous analyses.
CONCLUSION
This method of analysis allows entire configurations to be considered as a whole, and does not require specific inter-landmark distances or angles to be selected. Sources of variability present themselves, without having to be individually sought after. This method is suggested as an additional tool for the analysis of landmark configuration data.
Keyword
MeSH Terms
Figure
-

Fig. 1 Mathematical representation of 68 landmarks, colour coded by region.
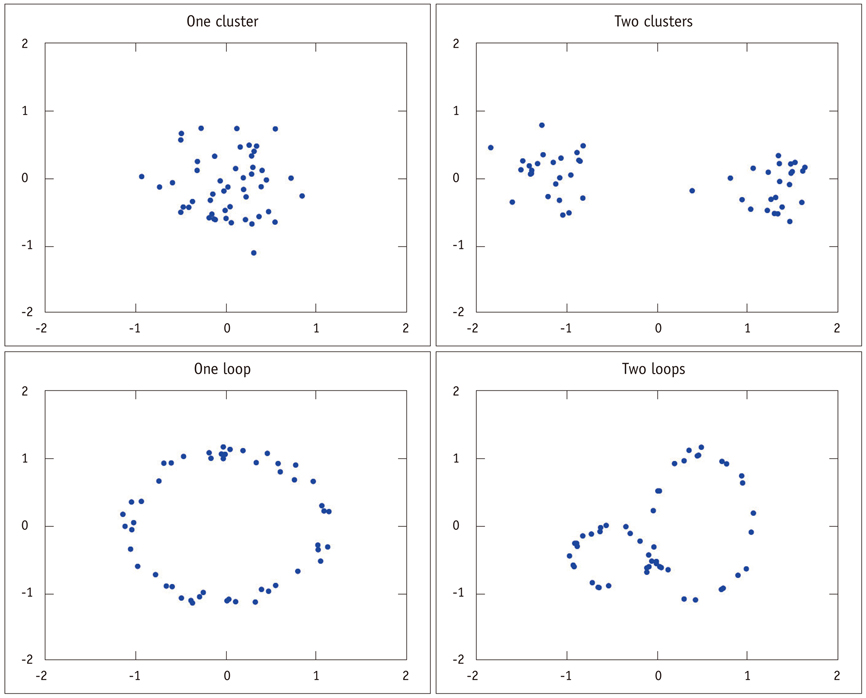
Fig. 2 Sets of data points displaying different topological features. Top row shows data sets with one (left) and two (right) zero-dimensional features (clusters). Second row shows data sets that display one (left) and two (right) one-dimensional features (loops). Persistent homology would distinguish between these data sets.
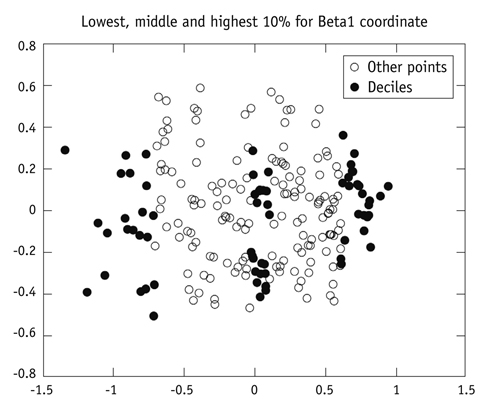
Fig. 3 Embedded coordinates obtained from dimensionality reduction on β1 distances, with lowest, middle, and highest 10% of first coordinate values highlighted.

Fig. 4 Correlations > 0.55 between inter-landmark distances and first β0 coordinate, colour-coded by strength. This coordinate is most associated with overall size, particularly vertically (and diagonally).
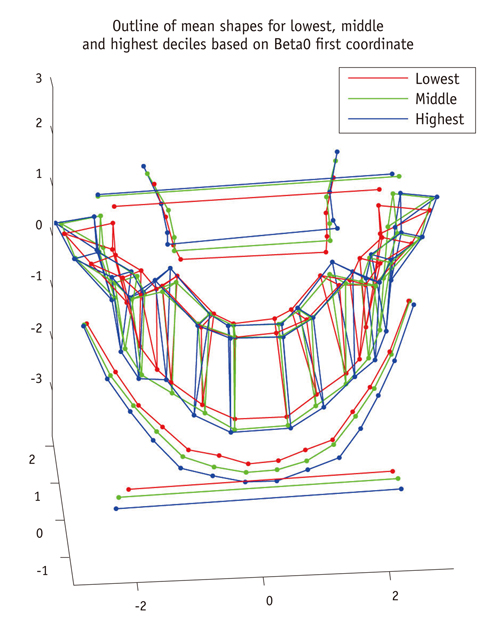
Fig. 5 Outlines of mean shapes obtained from subjects with 10% of lowest, 10% middle, and 10% highest first β0 coordinate values, plotted to compare their overall shapes. Mean shape obtained from subjects with smallest first coordinate values is generally smaller, particularly vertically.

Fig. 6 Profile plot of three groups over time, obtained from repeated measures ANOVA on the magnitude of first β0 coordinate. Treatment groups increase from Time 1 to Time 2 and then stabilize, whereas control group remains relatively low (with slight increasing trend).
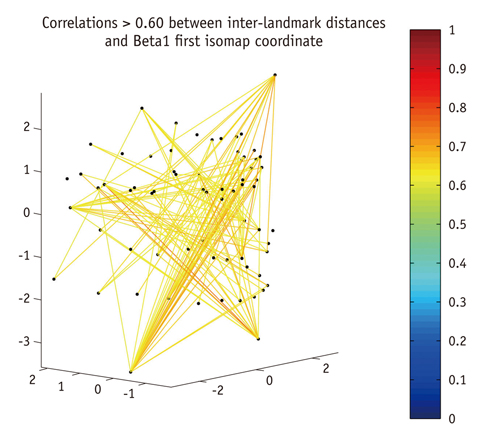
Fig. 7 Correlations > 0.6 between inter-landmark distances and first β1 coordinate, colour-coded by strength. This coordinate is also associated with overall size, but is related to maxillary width as well as vertical length.

Fig. 8 Outlines of mean shapes obtained from subjects with 10% of lowest, 10% middle, and 10% highest first β1 coordinate values, plotted to compare their overall shapes. Mean shape corresponding to subjects with smallest coordinate values (red) is smaller overall, but is particularly narrower in maxilla.
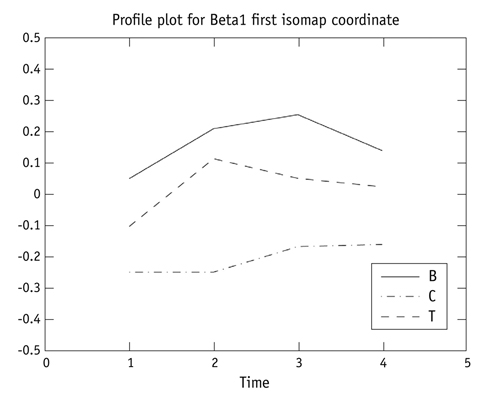
Fig. 9 Profile plot of three groups over time, obtained from repeated measures ANOVA on magnitude of first β1 coordinate. Treatment groups display higher magnitudes than control group, with larger increase from Time 1 to Time 2 (corresponding to increase in maxillary width).

Fig. 10 Correlations > 0.4 between inter-landmark distances and first β2 coordinate, colour-coded by strength. This coordinate is associated most with rear maxillary landmarks (which represent the second molars).

Fig. 11 Outlines of mean shapes obtained from subjects with 10% of lowest, 10% middle, and 10% highest first β2 coordinate values.

Fig. 12 Outline plot based on lowest, middle and highest 10% of β2 coordinates, centred on second molar region. Configuration of landmarks representing second molar is largest in mean shape corresponding to subjects with smallest coordinate values (shown in red). This means those subjects have second molars that are not fully erupted.
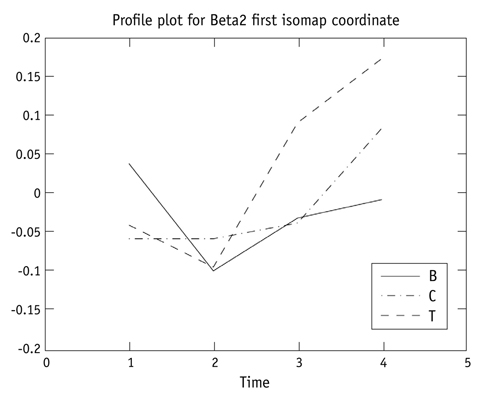
Fig. 13 Profile plot of three groups over time, obtained from repeated measures ANOVA on magnitude of first β2 coordinate. Changes in coordinate values do not appear to be related to treatment groups, and overall increasing trends are observed.
Reference
-
1. Mah J, Hatcher D. Current status and future needs in craniofacial imaging. Orthod Craniofac Res. 2003. 6:Suppl 1. 10–16. discussion 179-182.2. Ziegler CM, Woertche R, Brief J, Hassfeld S. Clinical indications for digital volume tomography in oral and maxillofacial surgery. Dentomaxillofac Radiol. 2002. 31:126–130.3. Maki K, Inou N, Takanishi A, Miller AJ. Computer-assisted simulations in orthodontic diagnosis and the application of a new cone beam X-ray computed tomography. Orthod Craniofac Res. 2003. 6:Suppl 1. 95–101. discussion 179-182.4. Scarfe WC, Farman AG, Sukovic P. Clinical applications of cone-beam computed tomography in dental practice. J Can Dent Assoc. 2006. 72:75–80.5. Kim N, Seo JB, Song KS, Chae EJ, Kang SH. Semi-automatic measurement of the airway dimension by computed tomography using the full-width-half-maximum method: a study on the measurement accuracy according to the CT parameters and size of the airway. Korean J Radiol. 2008. 9:226–235.6. Kim N, Seo JB, Song KS, Chae EJ, Kang SH. Semi-automatic measurement of the airway dimension by computed tomography using the full-width-half-maximum method: a study on the measurement accuracy according to the orientation of an artificial airway. Korean J Radiol. 2008. 9:236–242.7. Cheung JY, Kim Y, Shim SS, Lim SM. Combined fluoroscopy- and CT-guided transthoracic needle biopsy using a C-arm cone-beam CT system: comparison with fluoroscopy-guided biopsy. Korean J Radiol. 2011. 12:89–96.8. Lagravère MO, Carey J, Heo G, Toogood RW, Major PW. Transverse, vertical, and anteroposterior changes from bone-anchored maxillary expansion vs traditional rapid maxillary expansion: a randomized clinical trial. Am J Orthod Dentofacial Orthop. 2010. 137:304.e1–304.e12. discussion 304-305.9. Zomorodian A, Carlsson G. Computing persistent homology. Discrete Comput Geom. 2005. 33:249–274.10. Edelsbrunner H, Letscher D, Zomorodian A. Topological persistence and simplification. Discrete Comput Geom. 2002. 28:511–533.11. Smalley WM, Shapiro PA, Hohl TH, Kokich VG, Branemark PI. Osseointegrated titanium implants for maxillofacial protraction in monkeys. Am J Orthod Dentofacial Orthop. 1988. 94:285–295.12. Erverdi N, Okar I, Kucukkeles N, Arbak S. A comparison of two different rapid palatal expansion techniques from the point of root resorption. Am J Orthod Dentofacial Orthop. 1994. 106:47–51.13. Parr JA, Garetto LP, Wohlford ME, Arbuckle GR, Roberts WE. Sutural expansion using rigidly integrated endosseous implants: an experimental study in rabbits. Angle Orthod. 1997. 67:283–290.14. Shapiro PA, Kokich VG. Uses of implants in orthodontics. Dent Clin North Am. 1988. 32:539–550.15. Gerlach KL, Zahl C. Transversal palatal expansion using a palatal distractor. J Orofac Orthop. 2003. 64:443–449.16. Mommaerts MY. Transpalatal distraction as a method of maxillary expansion. Br J Oral Maxillofac Surg. 1999. 37:268–272.17. Gamble J, Heo G. Exploring uses of persistent homology for statistical analysis of landmark-based shape data. J Multivar Anal. 2010. 101:2184–2199.18. Tenenbaum JB, de Silva V, Langford JC. A global geometric framework for nonlinear dimensionality reduction. Science. 2000. 290:2319–2323.19. Dryden JL, Mardia KV. Statistical Shape Analysis. 1998. New York: John Wiley and Sons.20. De Silva V. PLEX: Simplicial complexes in MATLAB, Public Release Version 1.0. PLEX was designed and coded by Vin de Silva, ©2000-2003. Mod 2 methods coded by Dawn Banard ©2001. Various improvements due to Dawn Banard, Peter Lee ©2001 and Patrick Perry ©2003. Accessed July 19, 2009. Available at: http://comptop.stanford.edu/programs/plex/.21. Kinzinger GS, Fritz UB, Sander FG, Diedrich PR. Efficiency of a pendulum appliance for molar distalization related to second and third molar eruption stage. Am J Orthod Dentofacial Orthop. 2004. 125:8–23.
- Full Text Links
-
- Actions
-
Cited
- CITED
-
- Close
- Share
-
- Similar articles
-
- Sphenoid bone changes in rapid maxillary expansion assessed with cone-beam computed tomography
- Three-dimensional imaging modalities in endodontics
- Detection of maxillary second molar with two palatal roots using cone beam computed tomography: a case report
- Evaluation of Midpalatal Suture Maturation using Cone-Beam Computed Tomography in Children and Adolescents
- Maxillary sinus pneumatization after maxillary molar extraction assessed with cone beam computed tomography
