In vitro toxicity of melamine against Tetrahymena pyriformis cells
- Affiliations
-
- 1College of Veterinary Medicine, China Agricultural University, Beijing 100193, China. hanbo@cau.edu.cn
- KMID: 1067334
- DOI: http://doi.org/10.4142/jvs.2011.12.1.27
Abstract
- This study assessed the toxicity of melamine against the unicellular eukaryotic system of Tetrahymena (T.) pyriformis exposed to 0, 0.05, 0.25, 0.5, 2.5, and 5 mg/mL of melamine. Cell growth curves of different cultures, the half maximum inhibition concentration (IC50) value of melamine, and morphological changes in cells were obtained via optical and transmission electron microscopic observation. The effects of eleven melamine concentrations, 0.25, 0.5, 1, 1.5, 2, 2.5, 3, 3.5, 4, 4.5 and 5 mg/mL, on protein expression levels of T. pyriformis were examined using matrix-assisted laser desorption/ionization time-of-flight mass spectrometry (MALDI-TOF-MS). The results showed an obvious inhibitory effect of melamine on the growth of eukaryotic cells. Cell growth dynamics indicated that the IC50 value of melamine on T. pyriformis was 0.82 mg/mL. The cellular morphology was also affected in a concentration-dependent manner, with characteristics of atrophy or cell damage developing in the presence of melamine. The relative contents of the top four main proteins corresponding to peak mass-to-charge ratios (m/z) of 4466, m/z 6455, m/z 6514, and m/z 7772 in the MALDI-TOF-MS spectra were all found to be closely correlated with the melamine concentrations. In conclusion, exposure of eukaryotic cells to melamine could inhibit cell growth, cause changes in cytomorphology and even disturb the expression of proteins in a concentration-dependent manner. The described method of examining four sensitive proteins affected by melamine was also proposed to be used in a preliminary study to identify protein biomarkers in T. pyriformis.
Keyword
MeSH Terms
Figure
-
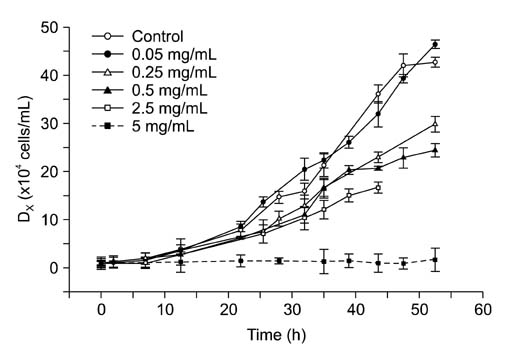
Fig. 1 Growth dynamics of Tetrahymena (T.) pyriformis cells exposed to different concentrations of melamine. The presented cell concentration (Dx) was the mean of three replicates. Although the Dx of different cell cultures increased, cell growth was obviously inhibited in the presence of melamine. At various time spots, the Dx of each test culture was compared with that of the control culture using the Paired-Samples t test in the SPSS 16.0 software. The results showed that there were no significant differences between the test culture containing 0.05 mg/mL of melamine and the control group at any time point (p > 0.05). After 26 h of exposure to 0.25, 0.5, 2.5 and 5 mg/mL of melamine, the test cultures differed significantly from the control culture (p < 0.05).

Fig. 2 Inverted microscopic images of melamine-treated T. pyriformis cell cultures after 48 h of incubation. (A) Normal pear-like shaped T. pyriformis cells in the negative control culture. (B) Cellular shape and cell number were not obviously influenced by the presence of 0.05 mg/mL of melamine. (C) Cell number decreased evidently and cellular shape became irregular when the melamine concentration was 0.25 mg/mL. Characteristic cell atrophy appeared. (D) Cell number decreased drastically and many cells were damaged when the melamine concentration reached 2.5 mg/mL. ×40.
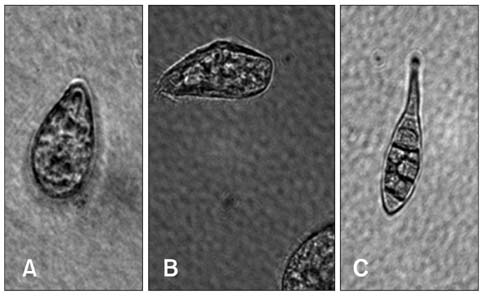
Fig. 3 Inverted microscopic images of melamine-treated T. pyriformis cells after 48 h of incubation. (A) A pear-like shaped normal T. pyriformis cell in the negative control culture. The cell membrane was integrated and its cytoplasm was clear and homogeneous. (B) Characteristic cell atrophy in the presence of 0.25 mg/mL of melamine. The cell membrane was damaged, and cytoplasm was not abundant. (C) T. pyriformis cells were severely atrophic when the melamine concentration was 2.5 mg/mL. ×200.

Fig. 4 Transmission electron microscopic images of T. pyriformis cells after 48 h of incubation. The concentration of melamine in culture medium A was 0 mg/mL, while it was 0.5 mg/mL in B and 2.5 mg/mL in C. In A, the plasma membrane of T. pyriformis cell was smooth and integrated, and the cytoplasm containing many large mucocysts was clear and homogeneous. Normal nucleoli distributed in the macronucleus region are shown in A, while thread-like nucleoli aggregates in the melamine-treated cell are shown in B. In C, the macronucleus region and mucocysts disappeared, and the previously homogeneous cytoplasm showed a character of porosity. MR: macronucleus region, n: nucleolus. Scale bars = 5 µm.

Fig. 5 MALDI-TOF-MS spectra of T. pyriformis intact proteins after 48 h of incubation. The concentration of melamine was 0 mg/mL (A), 3.0 mg/mL (B), and 4.5 mg/mL (C). Peaks at m/z 4466, m/z 6455, m/z 6514, and m/z 7772 in the MALDI-TOF-MS spectra corresponded to the four main proteins in T. pyriformis cell. Their relative intensities changed in response to gradual increases in the melamine concentrations.

Fig. 6 Alterations in the relative intensities of peaks m/z 4466, m/z 6455, m/z 6514, and m/z 7772 in the MALDI-TOF-MS spectra. The turning point of each of these polygonal lines was 3 mg/mL melamine. Peaks m/z 6455, m/z 6514 and m/z 7772 showed a first down-regulation and then up-regulation of their relative intensities before and after the turning point, whereas peak m/z 4466 showed a first up-regulation and then down-regulation of its relative intensity before and after the turning point.
Reference
-
1. Al-Chalabi KAK, Al-Khayat BHA. The effect of lindane on nucleic acids, protein and carbohydrate content in Tetrahymena pyriformis. Environ Pollut. 1989. 57:281–287.
Article2. Andersen WC, Turnipseed SB, Karbiwnyk CM, Clark SB, Madson MR, Gieseker CM, Miller RA, Rummel NG, Reimschuessel R. Determination and confirmation of melamine residues in catfish, trout, tilapia, salmon, and shrimp by liquid chromatography with tandem mass spectrometry. J Agric Food Chem. 2008. 56:4340–4347.
Article3. Baynes RE, Smith G, Mason SE, Barrett E, Barlow BM, Riviere JE. Pharmacokinetics of melamine in pigs following intravenous administration. Food Chem Toxicol. 2008. 46:1196–1200.
Article4. Bearden AP, Sinks GD, Schultz TW. Acclimation to sublethal exposures to a model nonpolar narcotic: population growth kinetics and membrane lipid alterations in Tetrahymena pyriformis. Aquat Toxicol. 1999. 46:11–21.
Article5. Beermann K, Buschmann HJ, Schollmeyer E. A calorimetric method for the rapid evaluation of toxic substances using Tetrahymena pyriformis. Thermochim Acta. 1999. 337:65–69.
Article6. Bhalla V, Grimm PC, Chertow GM, Pao AC. Melamine nephrotoxicity: an emerging epidemic in an era of globalization. Kidney Int. 2009. 75:774–779.
Article7. Bonnet JL, Dusser M, Bohatier J, Laffosse J. Cytotoxicity assessment of three therapeutic agents, cyclosporin-A, cisplatin and doxorubicin, with the ciliated protozoan Tetrahymena pyriformis. Res Microbiol. 2003. 154:375–385.
Article8. Calvano CD, Zambonin CG, Foti C, Cassano N, Vena GA. A matrix assisted laser desorption ionization time-of-flight mass spectrometry investigation to assess the composition of cod liver oil based products which displayed a different in vivo allergenic power. Food Chem Toxicol. 2008. 46:3580–3585.
Article9. Chan EYY, Griffiths SM, Chan CW. Public-health risks of melamine in milk products. Lancet. 2008. 372:1444–1445.
Article10. Dobson RLM, Motlagh S, Quijano M, Cambron RT, Baker TR, Pullen AM, Regg BT, Bigalow-Kern AS, Vennard T, Fix A, Reimschuessel R, Overmann G, Shan Y, Daston GP. Identification and characterization of toxicity of contaminants in pet food leading to an outbreak of renal toxicity in cats and dogs. Toxicol Sci. 2008. 106:251–262.
Article11. Filigenzi MS, Tor ER, Poppenga RH, Aston LA, Puschner B. The determination of melamine in muscle tissue by liquid chromatography/tandem mass spectrometry. Rapid Commun Mass Spectrom. 2007. 21:4027–4032.
Article12. Gümüş G, Demirata B, Apak R. Simultaneous spectrophotometric determination of cyanide and thiocyanate after separation on a melamine-formaldehyde resin. Talanta. 2000. 53:305–315.
Article13. Hau AK, Kwan TH, Li PK. Melamine toxicity and the kidney. J Am Soc Nephrol. 2009. 20:245–250.
Article14. Hill DL. The Biochemistry and Physiology of Tetrahymena. 1972. New York: Academic Press.15. Lam CW, Lan L, Che X, Tam S, Wong SSY, Chen Y, Jin J, Tao S, Tang XM, Yuen KY, Tam PKH. Diagnosis and spectrum of melamine-related renal disease: Plausible mechanism of stone formation in humans. Clin Chim Acta. 2009. 402:150–155.
Article16. Marathe SA, Adhikari HR, Netrawali MS, Nair PM. In vitro toxicity evaluation of a product obtained from carmoisine using Tetrahymena pyriformis cells. Food Chem Toxicol. 1993. 31:739–744.
Article17. Melnick RL, Boorman GA, Haseman JK, Montali RJ, Huff J. Urolithiasis and bladder carcinogenicity of melamine in rodents. Toxicol Appl Pharmacol. 1984. 72:292–303.
Article18. Mohd MH, Nageswara RA, Venkata RS, Mohan B. Low cost microbioassay test for assessing cytopathological and physiological responses of ciliate model Paramecium caudatum to carbofuran pesticide. Pestic Biochem Physiol. 2008. 90:66–70.19. Newton GL, Utley PR. Melamine as a dietary nitrogen source for ruminants. J Anim Sci. 1978. 47:1338–1344.
Article20. Niculescu SP, Kaiser KLE, Schultz TW. Modeling the toxicity of chemicals to Tetrahymena pyriformis using molecular fragment descriptors and probabilistic neural networks. Arch Environ Contam Toxicol. 2000. 39:289–298.21. Ogasawara H, Imaida K, Ishiwata H, Toyoda K, Kawanishi T, Uneyama C, Hayashi S, Takahashi M, Hayashi Y. Urinary bladder carcinogenesis induced by melamine in F344 male rats: correlation between carcinogenicity and urolith formation. Carcinogenesis. 1995. 16:2773–2777.
Article22. Osborne CA, Lulich JP, Ulrich LK, Koehler LA, Albasan H, Sauer L, Schubert G. Melamine and cyanuric acid-induced crystalluria, uroliths, and nephrotoxicity in dogs and cats. Vet Clin North Am Small Anim Pract. 2009. 39:1–14.
Article23. Pipeleers D, Van de Winkel M. Pancreatic B cells possess defense mechanisms against cell-specific toxicity. Proc Natl Acad Sci USA. 1986. 83:5267–5271.
Article24. Sauvant MP, Pepin D, Piccinni E. Tetrahymena pyriformis: a tool for toxicological studies. A review. Chemosphere. 1999. 38:1631–1669.
Article25. Villar-Garea A, Griese M, Imhof A. Biomarker discovery from body fluids using mass spectrometry. J Chromatogr B Analyt Technol Biomed Life Sci. 2007. 849:105–114.
Article26. Wang S, Liu T, Zhang L, Chen G, Yang P. Chymotryptic proteolysis accelerated by alternating current for MALDI-TOF-MS peptide mapping. J Proteomics. 2009. 72:640–647.
Article
- Full Text Links
-
- Actions
-
Cited
- CITED
-
- Close
- Share
-
- Similar articles
-
- Effect of in vivo administration of Tetrahymena pyriformis on the in vitro toxoplasmacidal activity of mouse peritoneal macrophages
- Non-specific activation of mouse peritoneal macrophages by a freshwater ciliate, Tetrahymena pyriformis
- Mini-review; Melamine-related Urinary Stone Disease
- Synergistic effect of melamine in combination with cyanuric acid on urinary tract toxicity in rats
- The Clinical Experience of Pyriformis Syndrome
