Drawing Guideline for JKMS Manuscripts (05): Plots for Numeric Data
- Affiliations
-
- 1Department of Orthopedic Surgery, Seoul Sacred Heart General Hospital, Seoul, Korea
- KMID: 2542807
- DOI: http://doi.org/10.3346/jkms.2023.38.e190
Abstract
- The appropriate plot effectively conveys the author’s conclusions to the readers. Journal of Korean Medical Science will provide a series of special articles to show you how to more easily make consistent and excellent plots. In this article, we will cover plots with numeric data.
Keyword
Figure
-
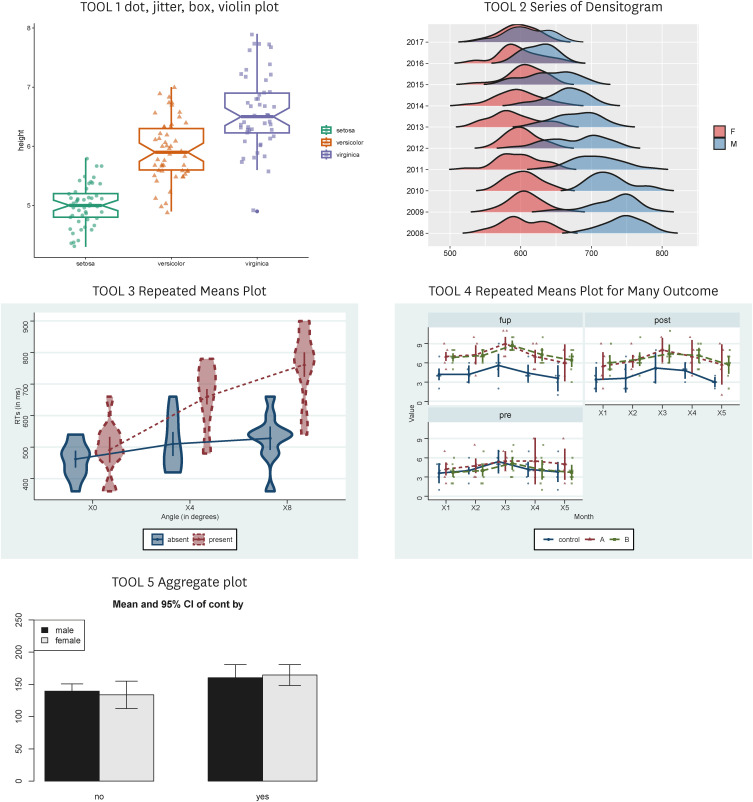
Fig. 1 Five tools for numeric data.
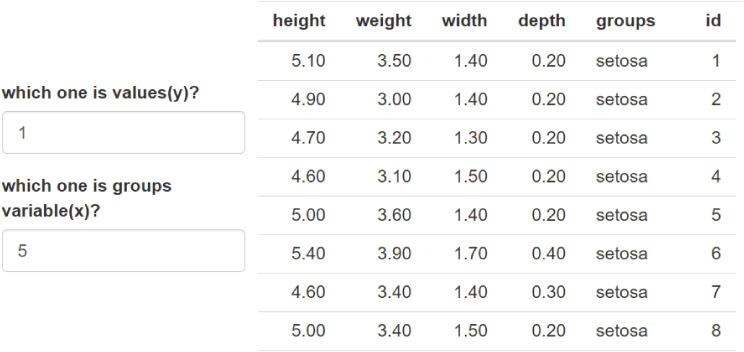
Fig. 2 Data structure of the first tool.
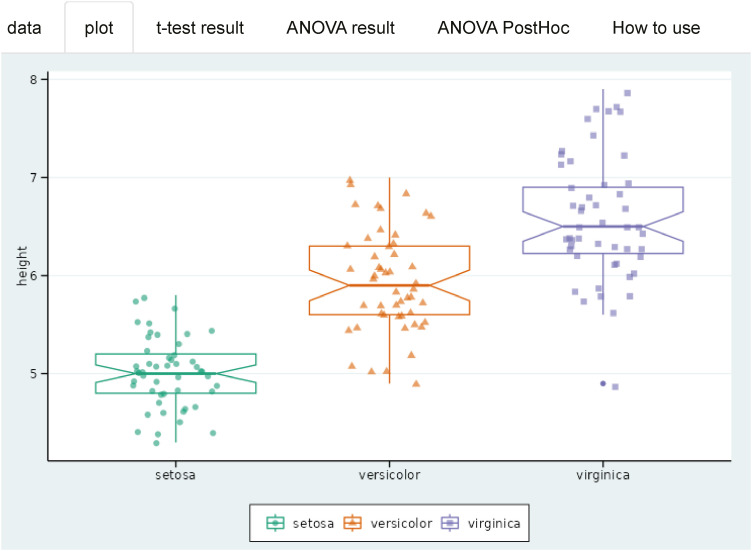
Fig. 3 Results shown on the ‘plot’ tab.
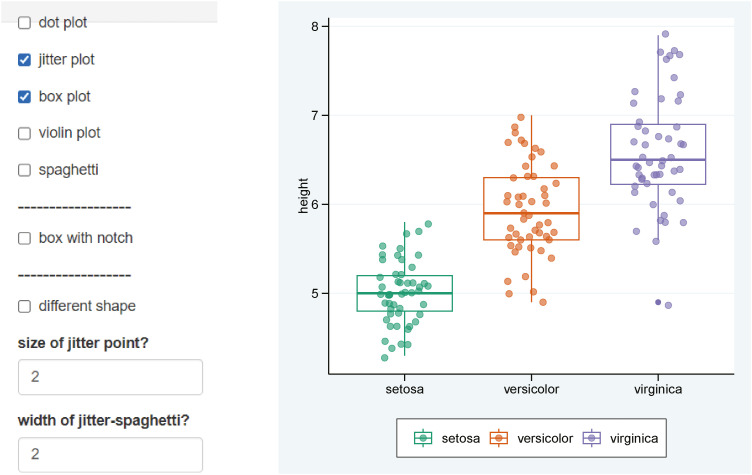
Fig. 4 Options of boxplot and jitter plot.
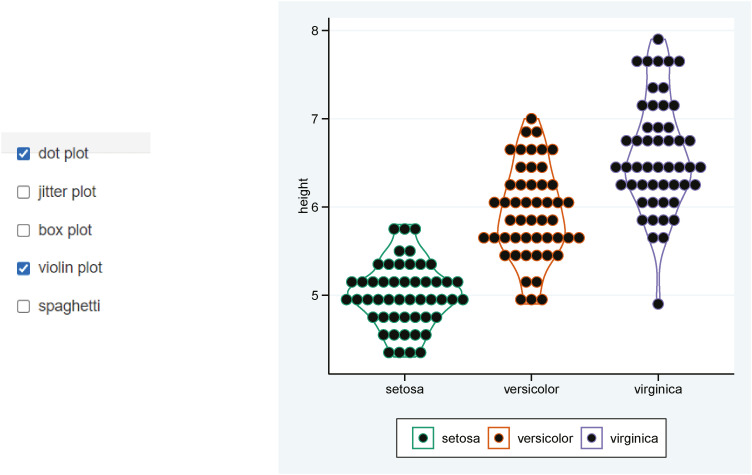
Fig. 5 Dot plot and violin plot.
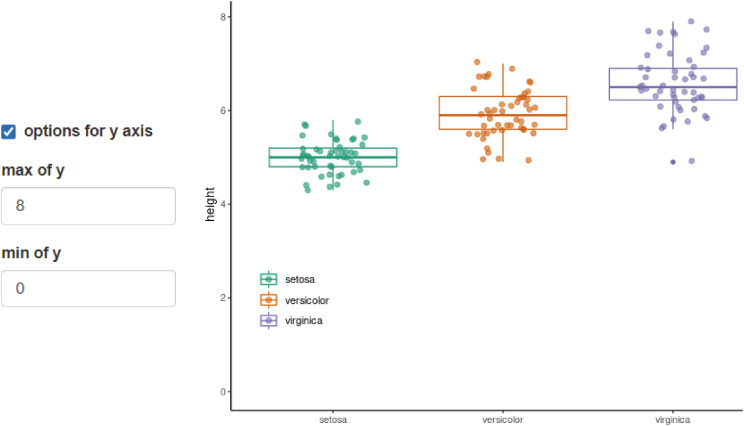
Fig. 6 Adjustment of the y-axis.
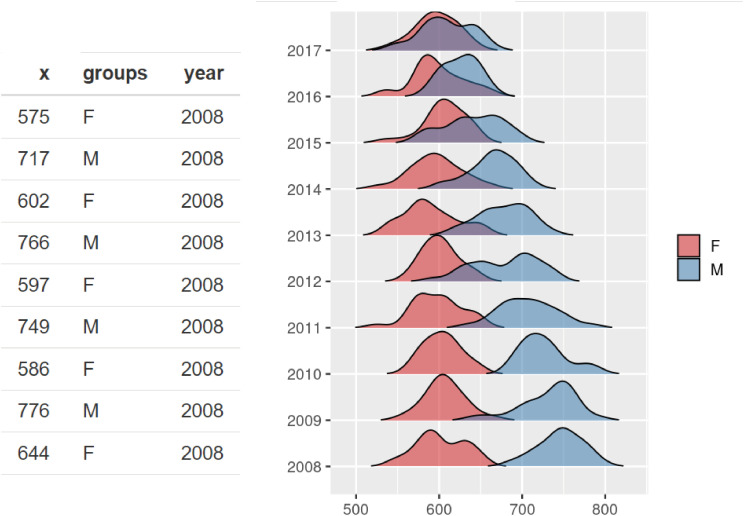
Fig. 7 Structure of the data for Series of Densitogram.
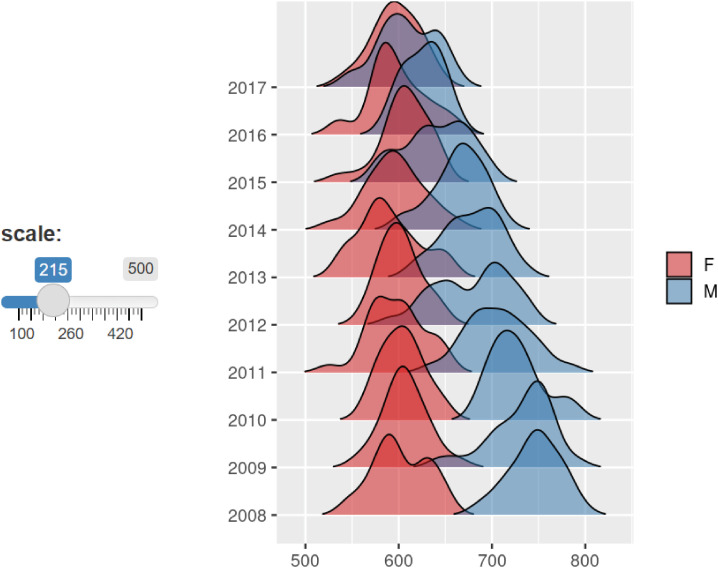
Fig. 8 Scale regulation.
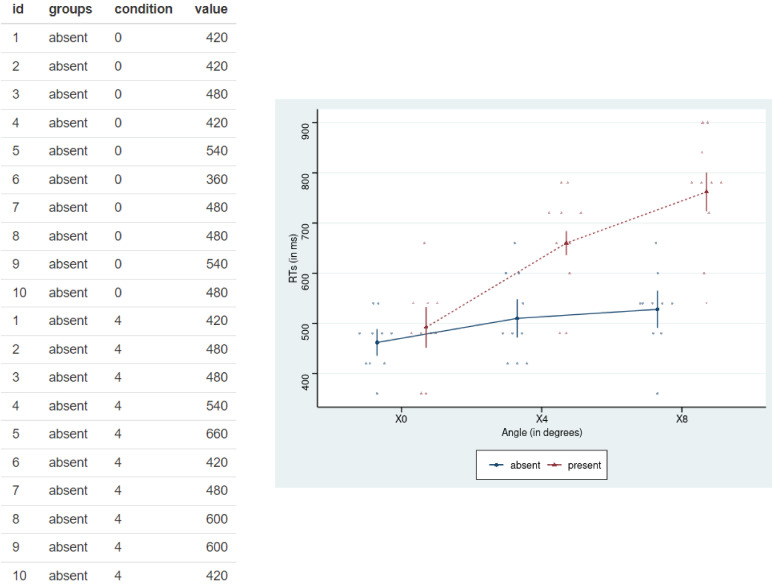
Fig. 9 Data structure of the Repeated Means Plot.
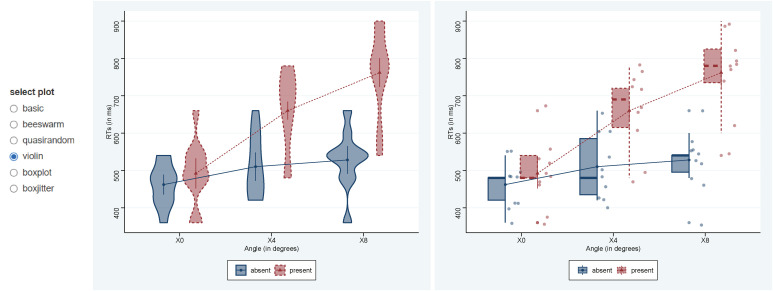
Fig. 10 Various kinds of plots.
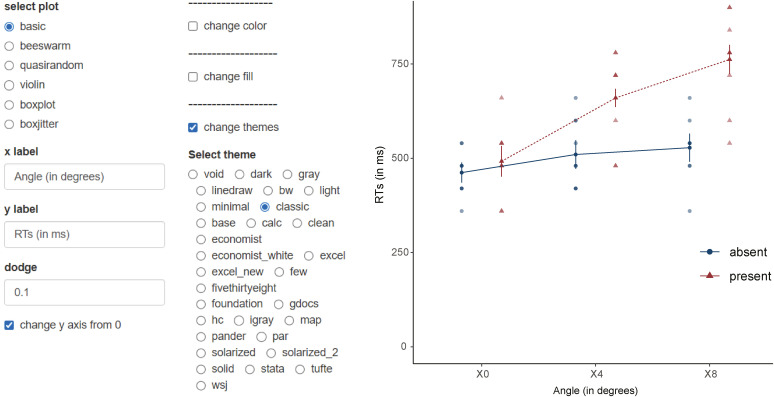
Fig. 11 Various options.
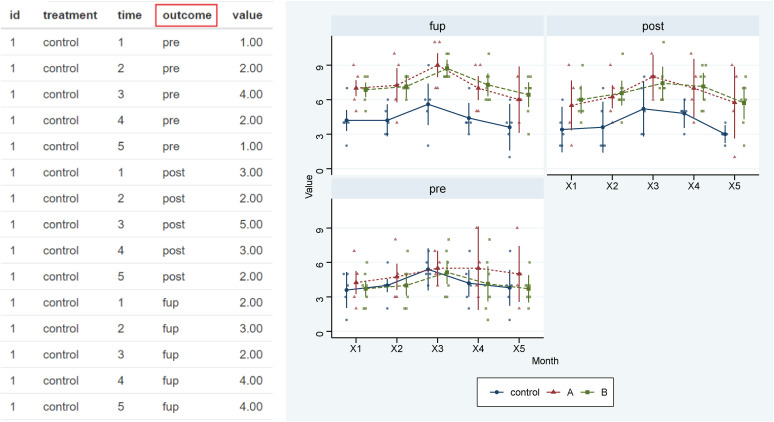
Fig. 12 Data structure of Repeated Means Plot for Many Outcome.
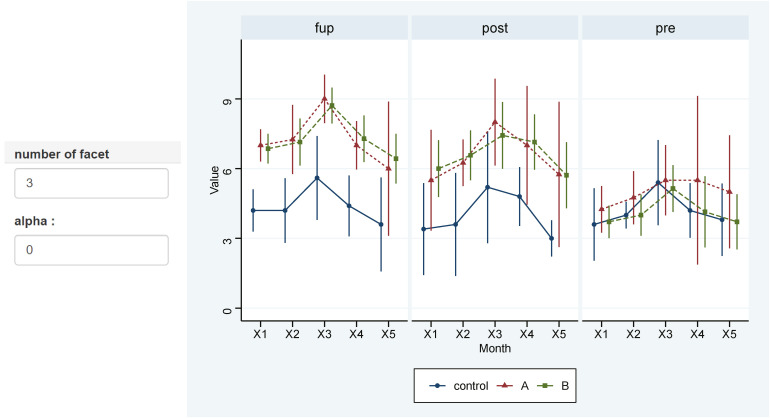
Fig. 13 Some kinds of options.
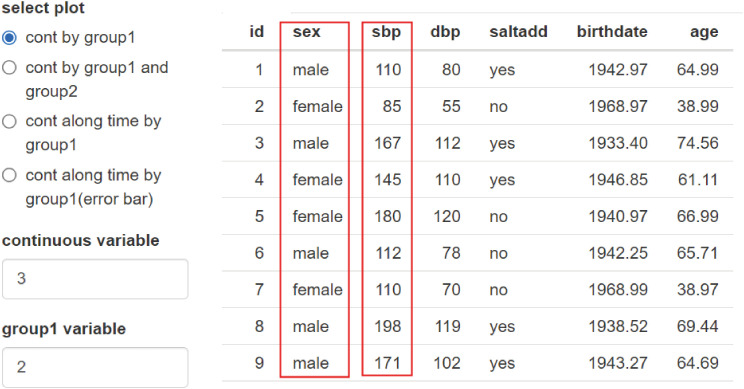
Fig. 14 The structure of the data and the types of possible plots.SBP = systolic blood pressure, DBP = diastolic blood pressure.
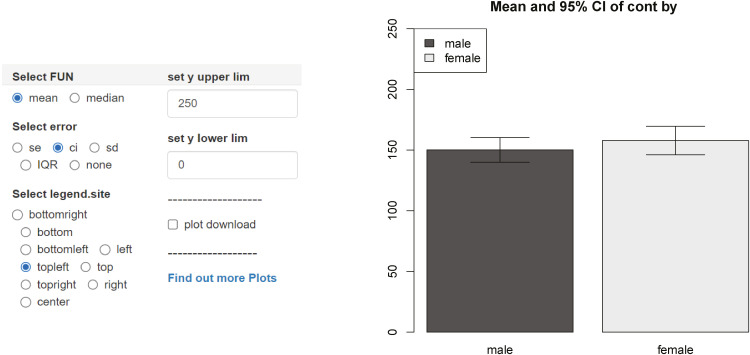
Fig. 15 The results and options of the first plot.CI = confidence interval, SE = standard error, SD = standard deviation, IQR = interquartile range.
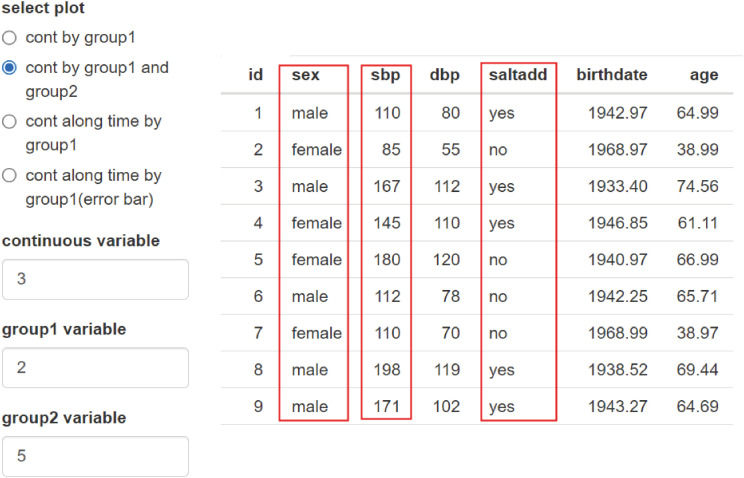
Fig. 16 Second plot.SBP = systolic blood pressure, DBP = diastolic blood pressure.
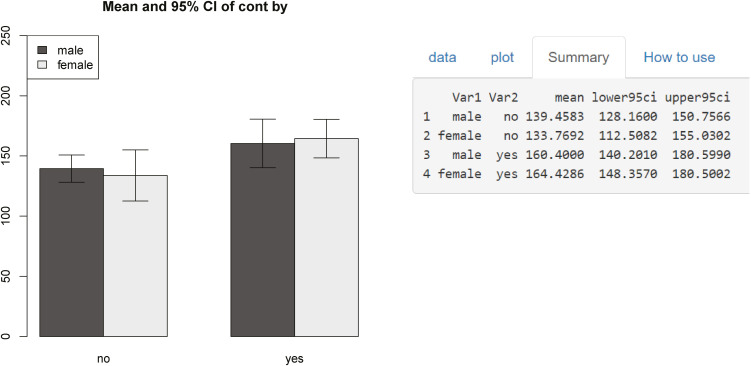
Fig. 17 The results of second plot.CI = confidence interval.
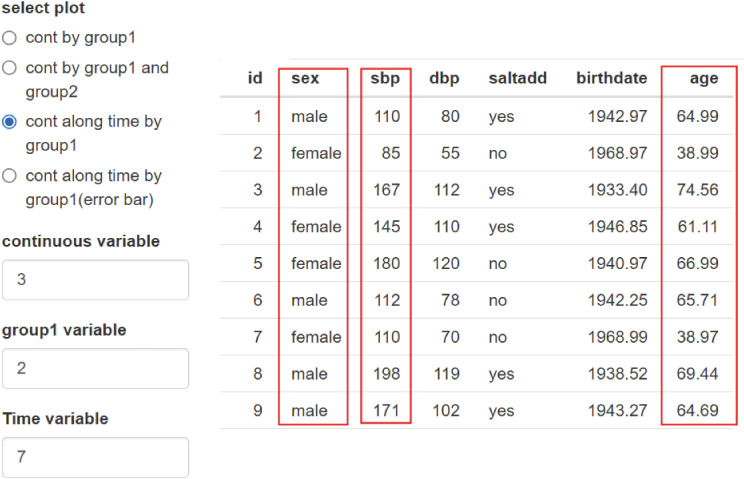
Fig. 18 Third plot and data structure.SBP = systolic blood pressure, DBP = diastolic blood pressure.
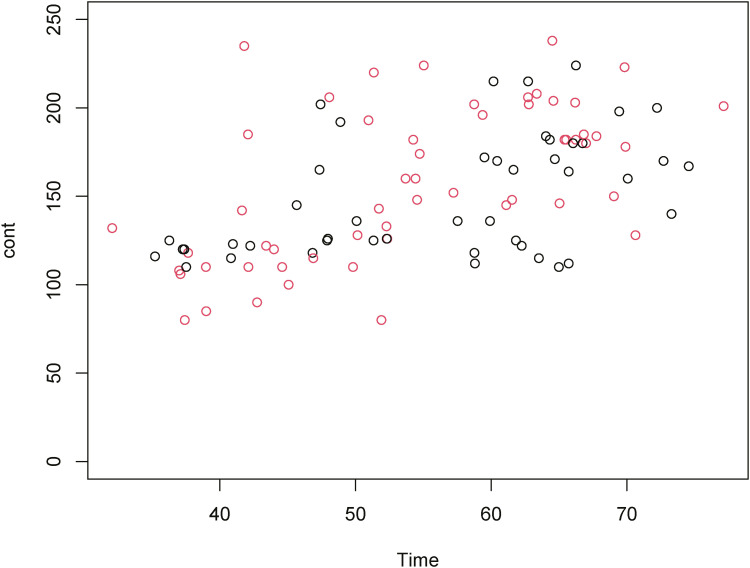
Fig. 19 Blood pressure in men and women according to age.
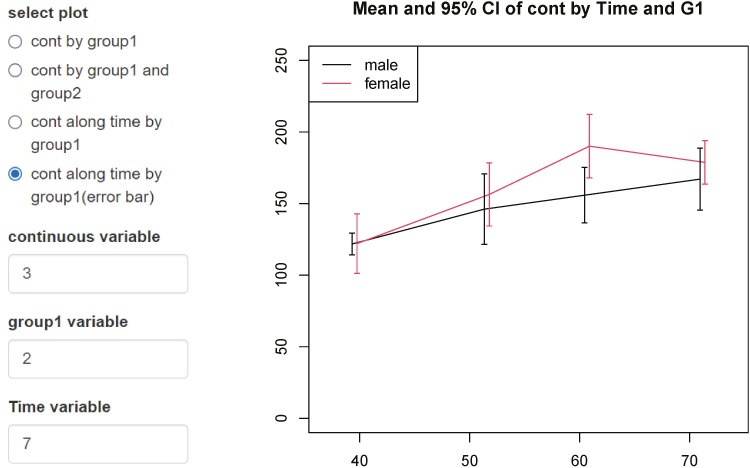
Fig. 20 A plot of male and female blood pressure according to age, using mean and error bars.CI = confidence interval.
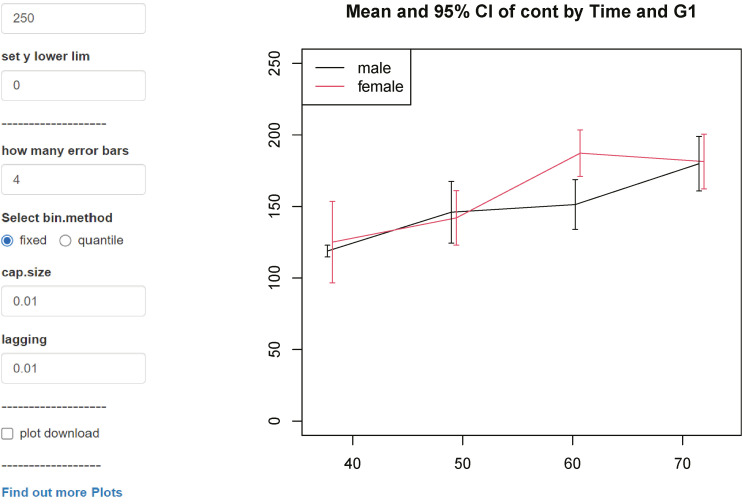
Fig. 21 Change of bin.method from quantile to fixed.CI = confidence interval.
Reference
-
1. Kim J. Drawing guideline for JKMS manuscripts (01) Kaplan-Meier curve and survival analysis. J Korean Med Sci. 2019; 34(8):e35. PMID: 30833878.
Article2. Kim J, Hwang IC. Drawing guideline for receiver operating characteristic curve in preparation of manuscripts. J Korean Med Sci. 2021; 36(47):e171. PMID: 34128599.
- Full Text Links
-
- Actions
-
Cited
- CITED
-
- Close
- Share
-
- Similar articles
-
- Drawing Guideline for JKMS Manuscripts (03): Plots for Categorical Data
- Drawing Guideline for JKMS Manuscripts (06): Scatter Plot
- Drawing Guideline for JKMS Manuscripts (03): Pyramid Charts
- Drawing Guideline for ‘Hip and Pelvis’: Plot with Error Bar
- Drawing Guideline for JKMS Manuscript (01) Kaplan-Meier Curve and Survival Analysis
