Correlation Between Multifocal Electroretinography and Visual Acuity After Resolution of Diabetic Macular Edema
- Affiliations
-
- 1Department of Ophthalmology, Dankook University College of Medicine, Cheonan, Korea. changmh@dankook.ac.kr
Abstract
- PURPOSE
To evaluate the prognostic value of multifocal electroretinography (mfERG) after a decrease of retinal thickness in eyes with diabetic macular edema (DME).
METHODS
Sixty patients (60 eyes) underwent intravitreal injection of triamcinolone acetonide or bevacizumab for diabetic macular edema. Eyes were divided into three groups, according to foveal thickness : Group A (<500 micrometer, n=20 eyes), Group B (500 micrometer <== <800 micrometer, n=20 eyes), and Group C (>==800 micrometer, n=20 eyes). Best-corrected visual acuity (BCVA) and mfERG responses from the most central seven hexagons were analyzed both before and after treatment.
RESULTS
The pre-injection P1 amplitudes of mfERG correlated significantly with end-point BCVA in Groups A and B (p<0.05), but did not correlate with end-point BCVA (p>0.05) in Group C.
CONCLUSIONS
The level of P1 amplitudes of mfERG may be a useful tool to predict visual outcomes after a decrease of retinal thickness in patients with diabetic macular edema.
MeSH Terms
Figure
-
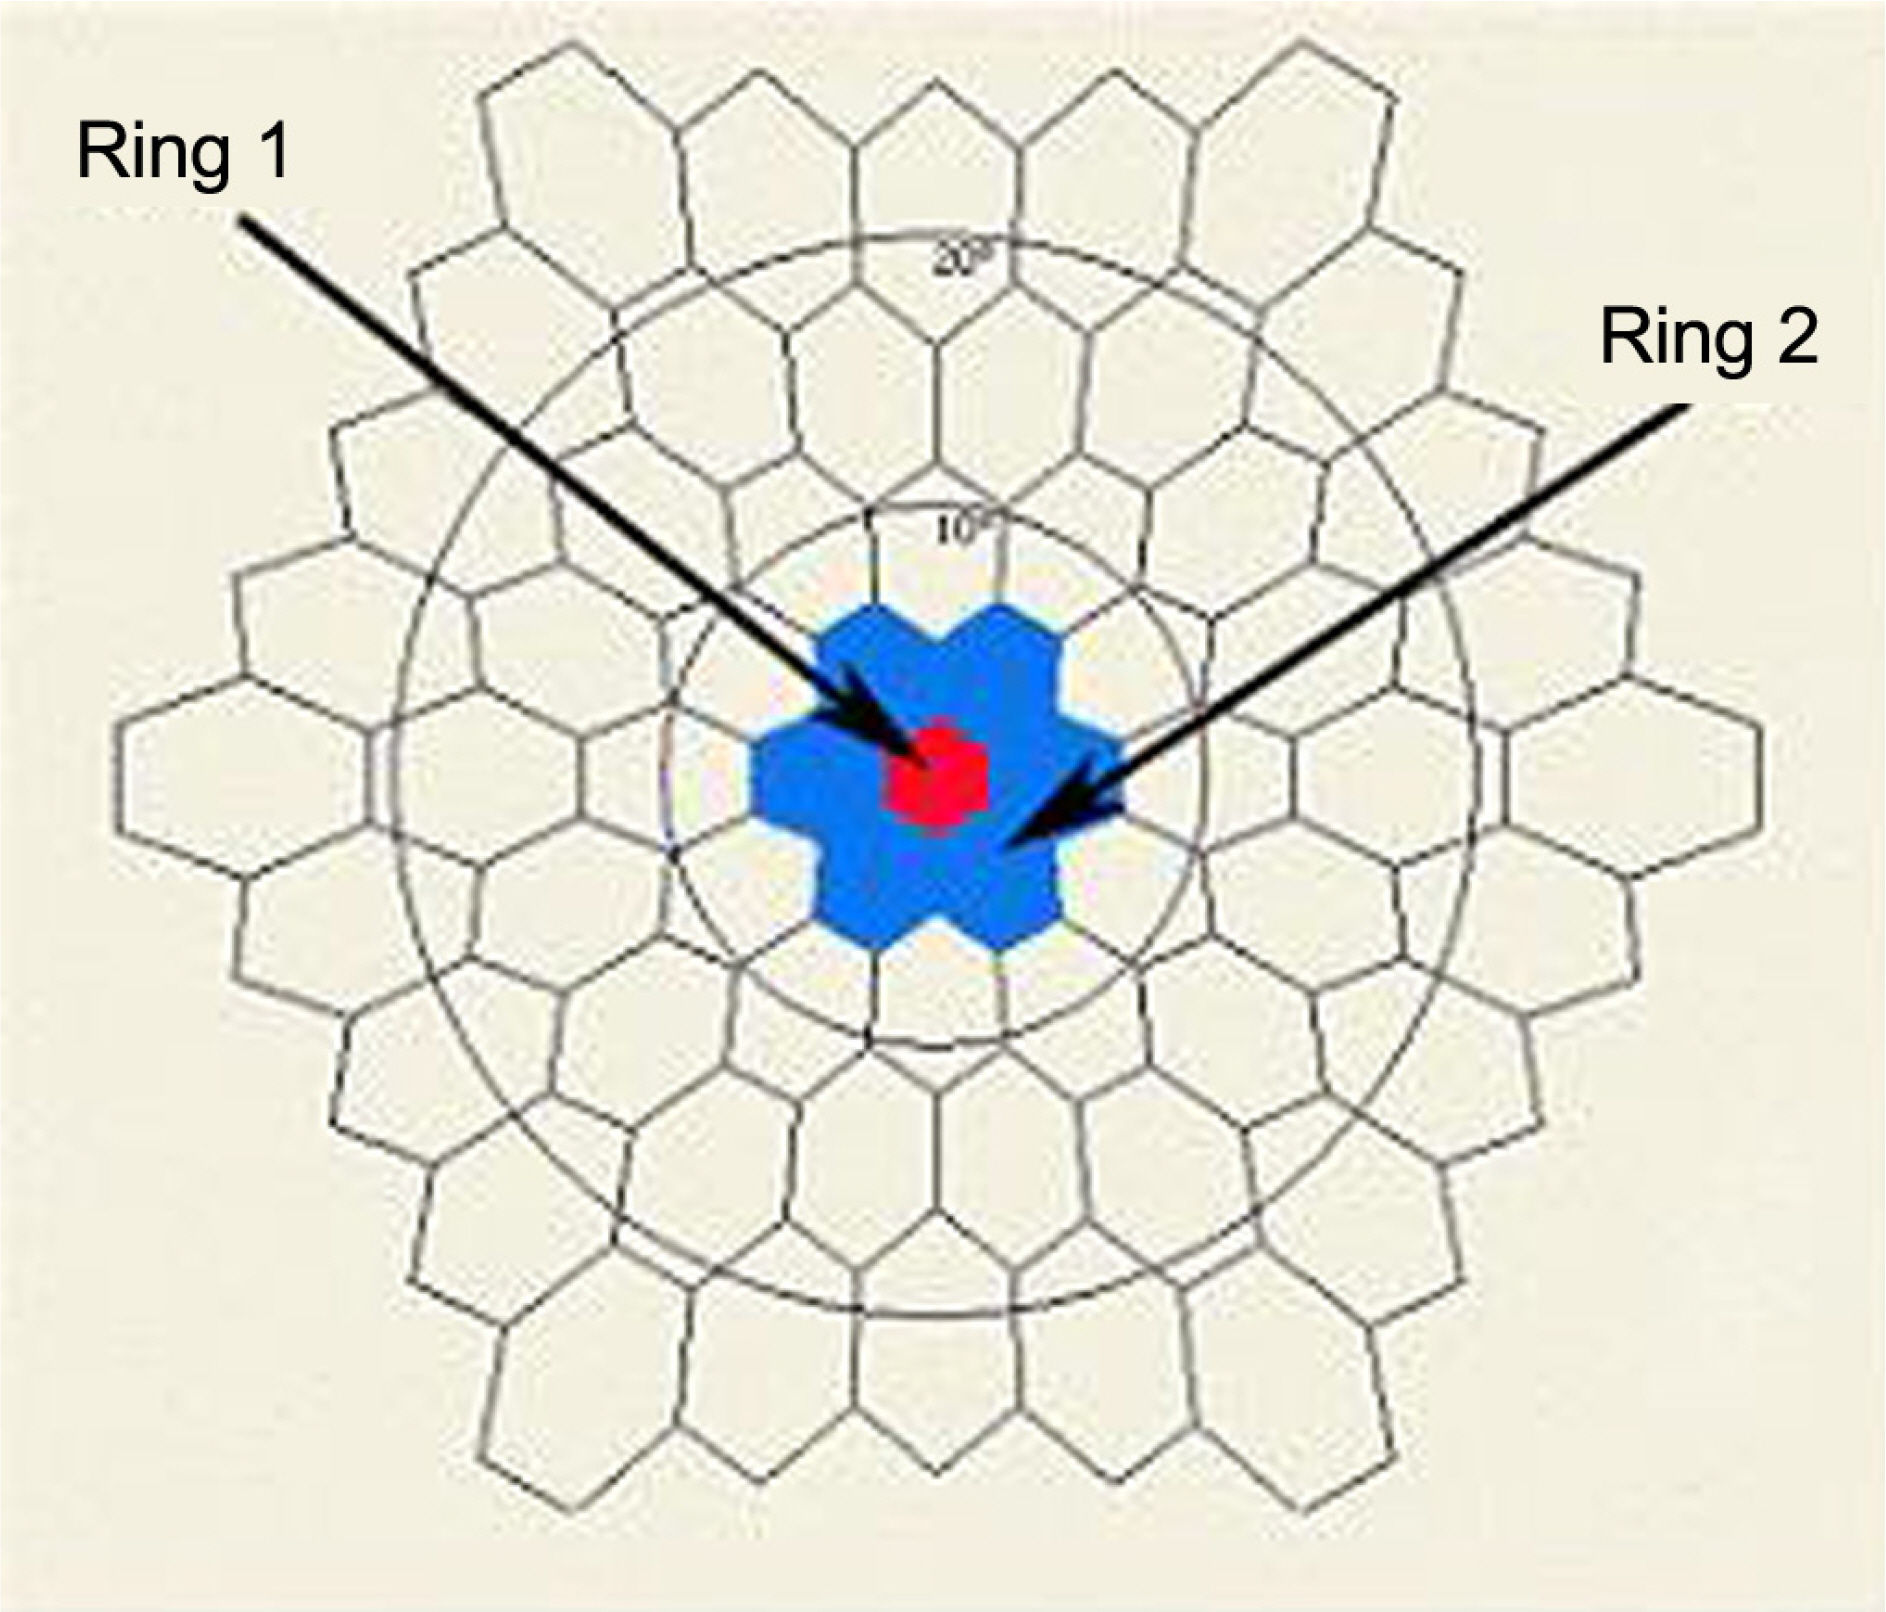
Figure 1. Stimulus array of 61 hexagonal elements; ring 1 (red) and ring 2 (blue) correspond to the fovea and parafovea, respectively.
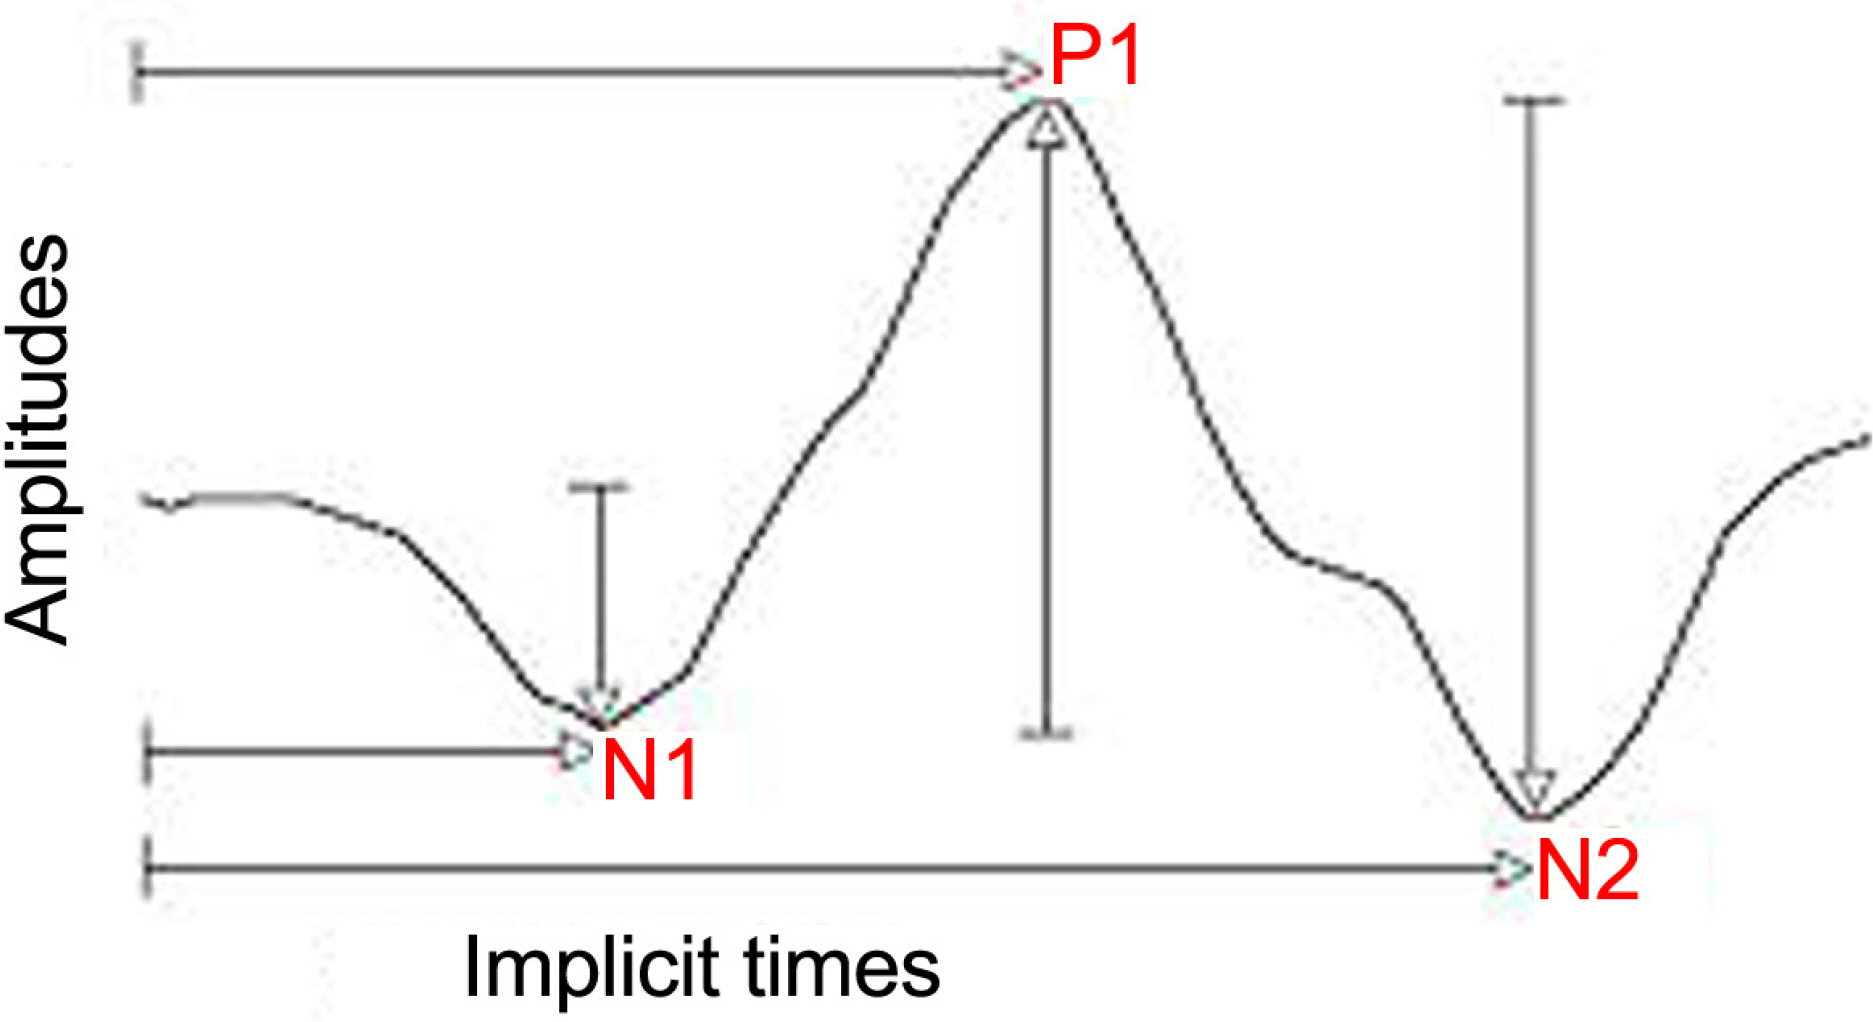
Figure 2. The typical waveform of the primary multifocal ERG response is a biphasic wave with initial negative deflection followed by a positive peak. There may be a second negative deflection after the peak. The preferred designation is to label these three peaks respectively N1, P1, and N2.
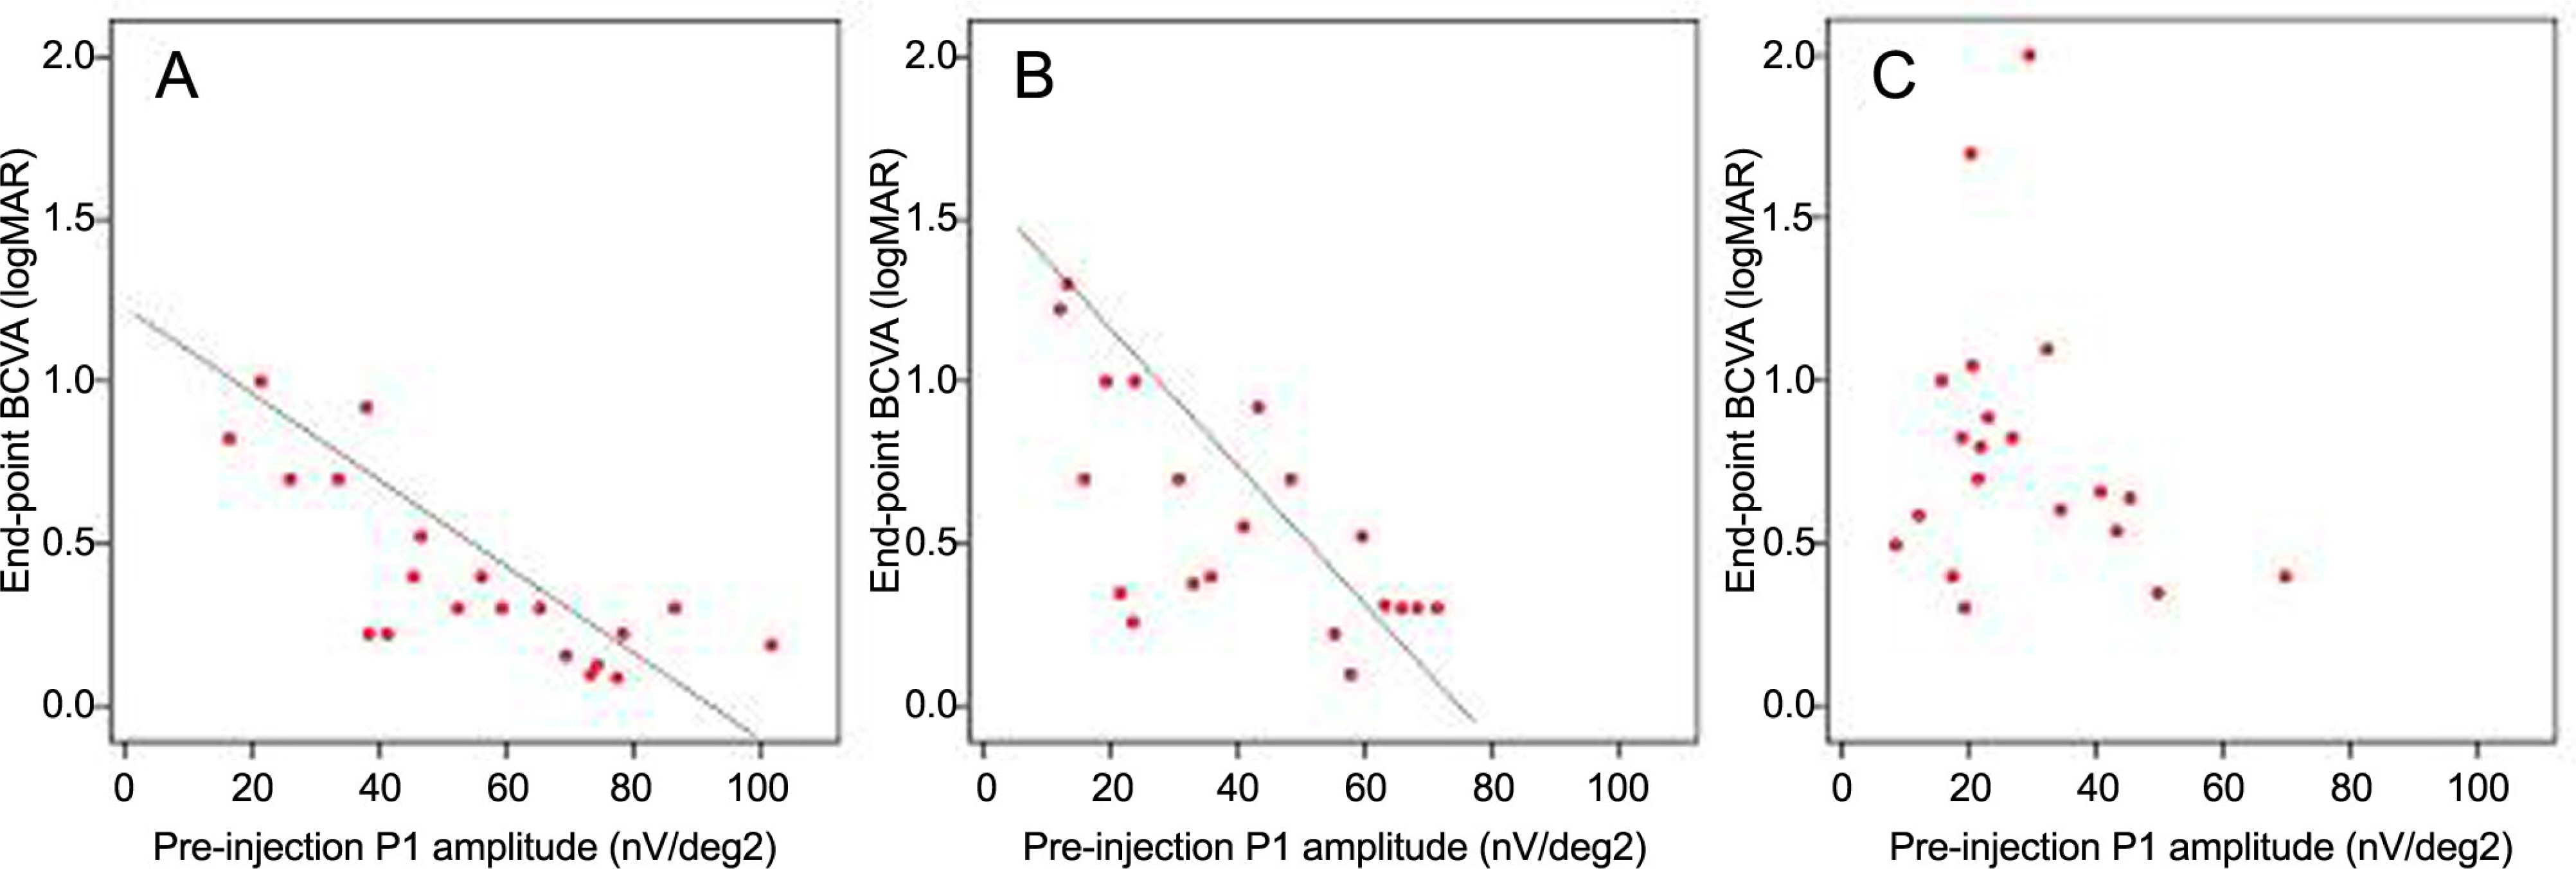
Figure 3. Scattergram demonstrating the relation between preinjection P1 amplitudes and end point BCVA in three groups. Group A (r=-0.772, p<0.001) and B (r=-0.651, p=0.001) show that preinjection P1 amplitude significantly related to the end point BCVA, but in group C, no significant relation between preinjection P1 amplitude and end point BCVA.
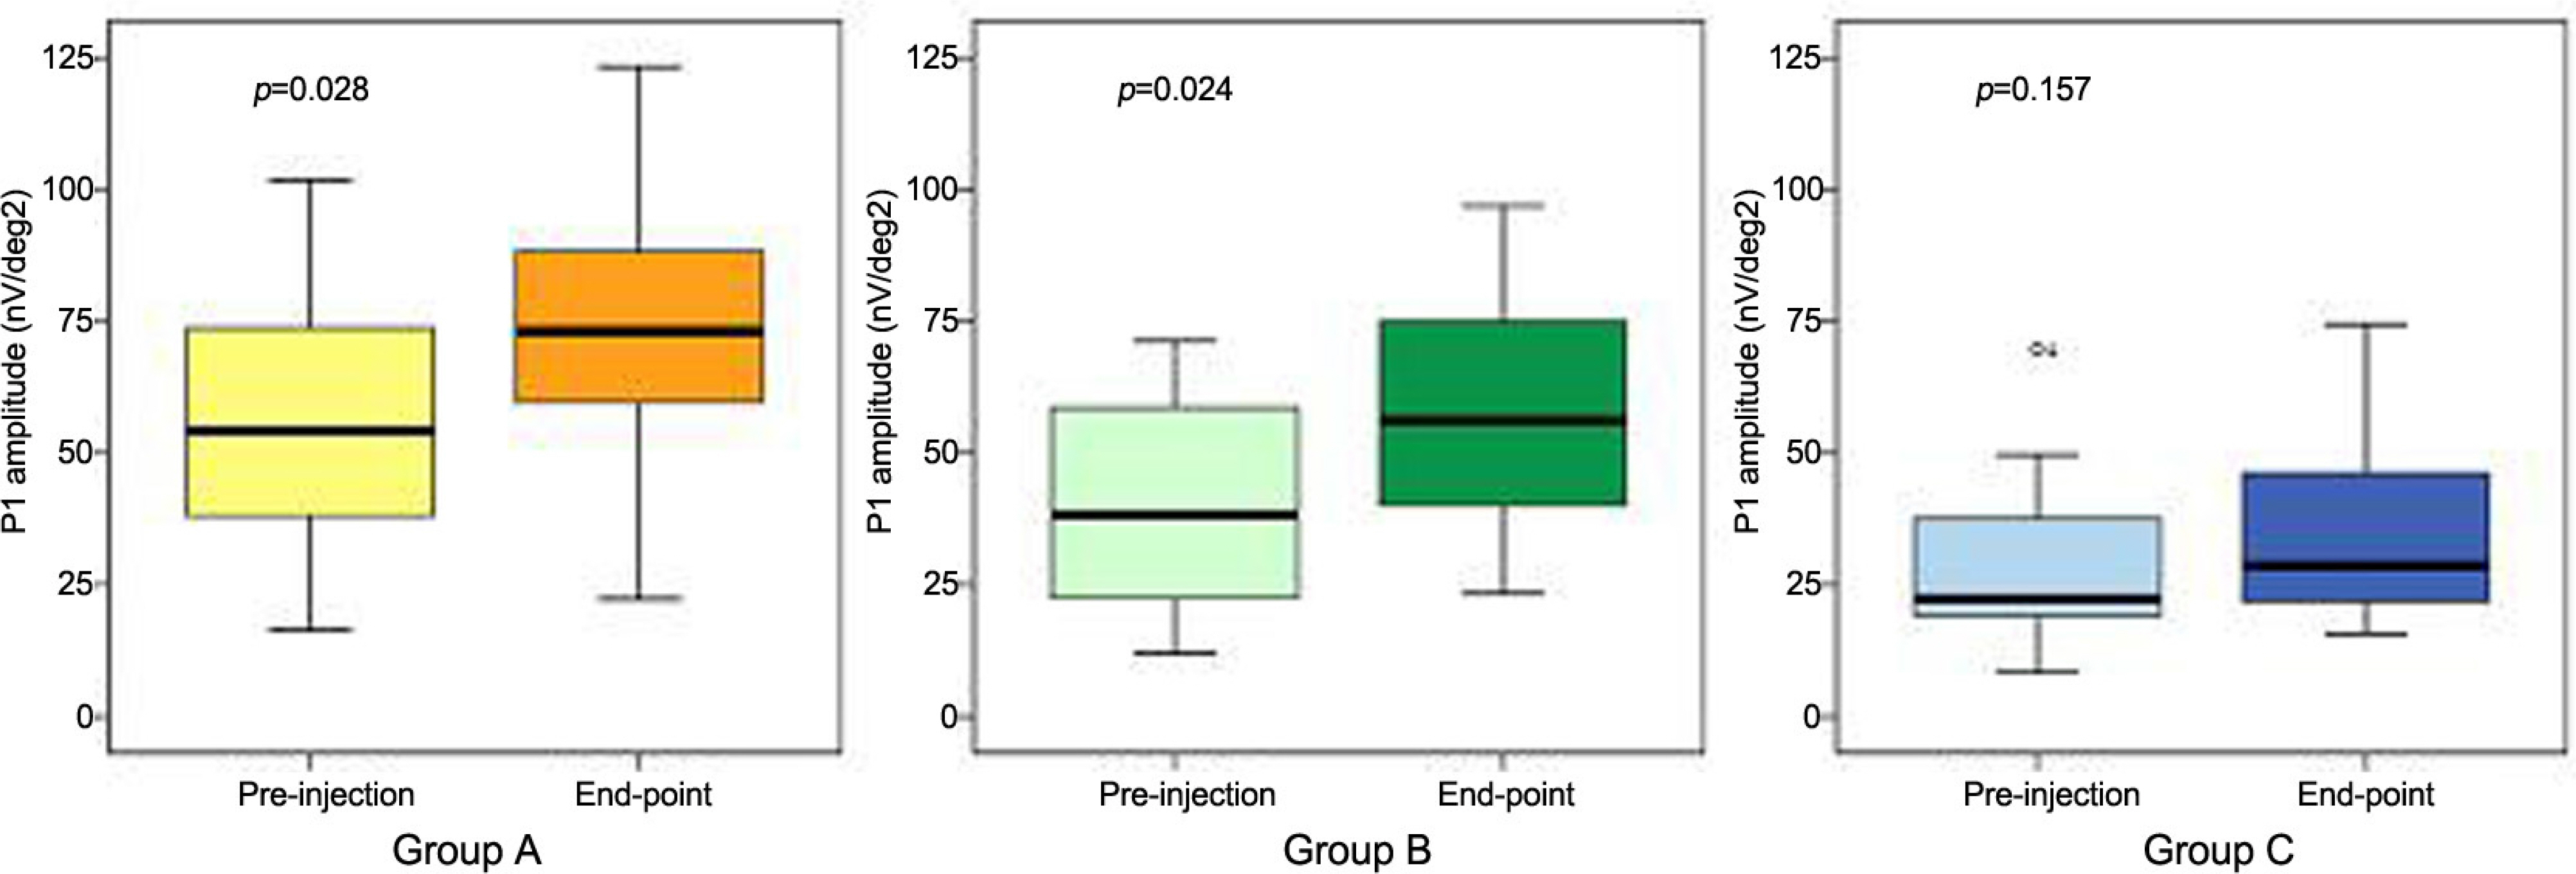
Figure 4. Comparison of P1 amplitudes of Group A, B and C between preinjection and end point state. The box- and -whiskers plots include the 25 th, 50 th, and 75 th percentiles. The whiskers define the minimum and maximum values.
Reference
-
References
1. Cunningham ET Jr, Adamis AP, Altaweel M, et al. A phase II randomized double-masked trial of pegaptanib, an antivascular endothelial growth factor aptamer, for diabetic macular edema. Ophthalmology. 2005; 112:1747–57.
Article2. Soheilian M, Ramezani A, Bijanzadeh B, et al. Intravitreal aberrations (avastin) injection alone or combined with aberrations versus macular photocoagulation as primary treatment of diabetic macular edema. Retina. 2007; 27:1187–95.3. Massin P, Audren F, Haouchine B, et al. Intravitreal aberrations acetonide for diabetic diffuse macular edema: preliminary results of a prospective controlled trial. Ophthalmology. 2004; 111:218–24.4. Sutter EE, Tran D. The field topography of ERG components in man-1. The photopic luminance response. Vision Res. 1992; 32:433–46.5. Yanoff M, Fine BS, Brucker AJ, Eagle RC Jr. Pathology of human cystoid macular edema. Surv Ophthalmol. 1984; 28:505–11.
Article6. Otani T, Kishi S. Tomographic assessment of vitreous surgery for diabetic macular edema. Am J Ophthalmol. 2000; 129:487–94.
Article7. Fine BS, Brucker AJ. Macular edema and cystoid macular edema. Am J Ophthalmol. 1981; 92:466–81.
Article8. Kondo M, Miyake Y, Horiguchi M, et al. Clinical evaluation of multifocal electroretinogram. Invest Ophthalmol Vis Sci. 1995; 36:2146–50.9. Oshima A, Hasegawa S, Abe H, et al. A case of acute zonal occult outer retinopathy identified by multifocal electroretinography changes. Folia Ophthalmol Jpn. 1997; 48:829–32.10. Bearse MA, Sutter EE, Sim D, Stamper R. Glaucomatous dysfunction revealed in higher order components of the electoretinogram. Vision science and its application, 1996 OSA aberrations digest series. 1. Washington DC: Optical Society of America;1996. p. 104–7.11. Bearse MA, Sutter EE, Palmowski AM. New developments aberrations a clinical test of retinal ganglion cell function. Vision science and its application, 1997 OSA technical digest series. 1. Washington DC: Optical Society of America;1997. p. 571–6.12. Kretschmann U, Bock M, Gockeln R, Zrenner E. Clinical applications of multifocal electroretinography. Doc Ophthalmol. 2000; 100:99–113.13. Chung EJ, Freeman WR, Koh HJ. Visual acuity and multifocal electroretinographic changes after arteriovenous crossing sheathotomy for macular edema associated with branch retinal vein occlusion. Retina. 2008; 28:220–5.
Article
- Full Text Links
-
- Actions
-
Cited
- CITED
-
- Close
- Share
-
- Similar articles
-
- The Correlation between Visual Acuity and Patterns of Diabetic Macular Edema in OCT Images
- Laser Photocoagulation in Diabetic Macular Edema
- Laser Photocoagulation in Diabetic Macular Edema
- Quantitative Analysis of Diabetic Macular Edema by Optical Coherence Tomography
- Grid-Pattern Laser Photocoagulation in Diabetic Macular Edema
