The Tissue Doppler Imaging Derived Post-Systolic Velocity Notch Originates at the Aortic Annulus
- Affiliations
-
- 1Department of Cardiology, Onze Lieve Vrouwe Gasthuis Hospital, Amsterdam, the Netherlands. a.j.ouss@olvg.nl
- KMID: 2177452
- DOI: http://doi.org/10.4250/jcu.2014.22.1.23
Abstract
- BACKGROUND
A distinct velocity pattern represented by a "notch" is observed during the time interval between the end of the systolic and the onset of the early diastolic velocity wave on longitudinal myocardial velocity curve. The origin of the post-systolic velocity notch (PSN) has not been resolved.
METHODS
The high frame rate color tissue Doppler imaging of the apical longitudinal axis was performed in 32 healthy subjects.
RESULTS
The time delays of the PSN onset at the posterior aortic wall (AW), the mid anteroseptal wall (MAS) and the posterior mitral annulus (MA) relatively to the anterior aortic annulus (AA) were found to be significantly longer than zero (5.1 +/- 2.2, 6.0 +/- 2.3, 6.8 +/- 2.8 ms; p < 0.001). The amplitude was the highest at the AA when compared to the AW, the MAS and the MA (4.77 +/- 1.28 vs. 2.88 +/- 1.11, 2.15 +/- 0.73, 2.44 +/- 1.17 cm/s; p < 0.001). A second PSN spike was identifiable in 10/32 (31%) of the studied subjects at the AA. Of these, 9 (28%) exhibited a second PSN spike at the AW, 3 (9%) at the MAS and no one at the MA.
CONCLUSION
The AA represents the site of the earliest onset and maximal amplitude of the PSN on the longitudinal velocity curve suggesting its mechanism to be that of an energy release at the instant of the aortic valve closure causing an apically directed acceleration of the myocardium. A substantial number of healthy subjects exhibit a second PSN spike predominantly at the level of the AA. Its mechanism remains to be elucidated.
Figure
-
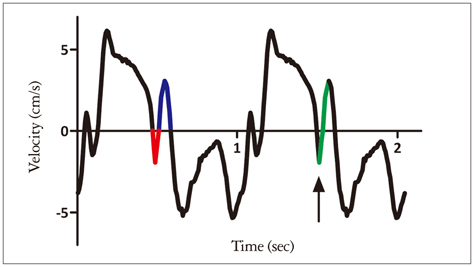
Fig. 1 Schematic presentation of the post-systolic velocity notch (PSN). On the left the current designation of the post-systolic negative (red) and positive (blue) velocity waves. On the right the proposed view of the PSN (green). The arrow indicates the onset of the PSN.
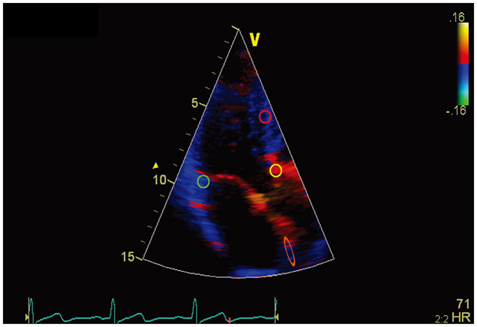
Fig. 2 The measurement levels. yellow: anterior aortic annulus, orange: posterior aortic wall, red: mid anteroseptal wall, green: posterior mitral annulus.
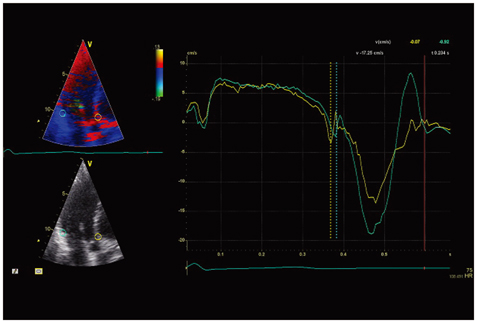
Fig. 3 The time delay of the post-systolic velocity notch (PSN) onset between the anterior aortic annulus (AA) and the posterior mitral annulus (MA). Vertical yellow dotted line represents the PSN onset at the AA, vertical blue dotted line represents the PSN onset at the MA.
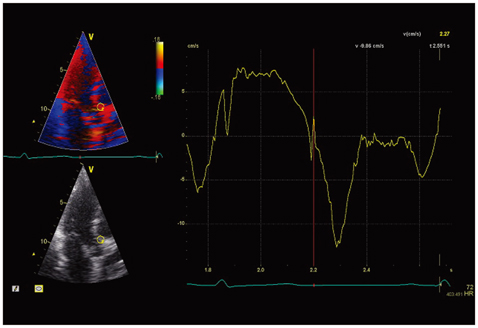
Fig. 4 The post-systolic velocity notch at the level of the anterior aortic annulus.
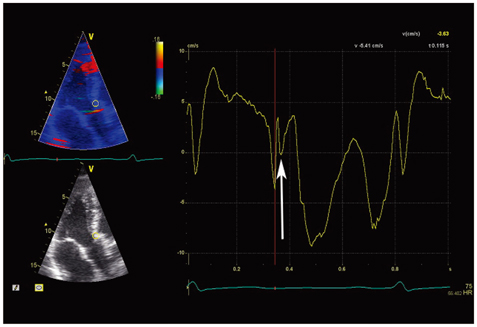
Fig. 5 The second post-systolic velocity notch (PSN) spike at the level of the anterior aortic annulus. The arrow indicates the onset of the second PSN spike.
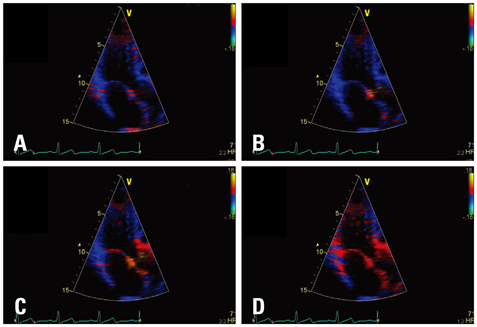
Fig. 6 The typical sequence of the centrifugal distribution of the apically directed velocity of the myocardium (red-colored area) following the aortic valve closure. Four consecutive images are shown. Panel A corresponds to the post-systolic velocity notch onset at the anterior aortic annulus. Color tissue Doppler frame rate is 166/sec.
Reference
-
1. Isaaz K, Munoz del Romeral L, Lee E, Schiller NB. Quantitation of the motion of the cardiac base in normal subjects by Doppler echocardiography. J Am Soc Echocardiogr. 1993; 6:166–176.
Article2. Pai RG, Gill KS. Amplitudes, durations, and timings of apically directed left ventricular myocardial velocities: I. Their normal pattern and coupling to ventricular filling and ejection. J Am Soc Echocardiogr. 1998; 11:105–111.
Article3. Lind B, Nowak J, Cain P, Quintana M, Brodin LA. Left ventricular isovolumic velocity and duration variables calculated from colour-coded myocardial velocity images in normal individuals. Eur J Echocardiogr. 2004; 5:284–293.
Article4. Remme EW, Lyseggen E, Helle-Valle T, Opdahl A, Pettersen E, Vartdal T, Ragnarsson A, Ljosland M, Ihlen H, Edvardsen T, Smiseth OA. Mechanisms of preejection and postejection velocity spikes in left ventricular myocardium: interaction between wall deformation and valve events. Circulation. 2008; 118:373–380.
Article5. Kanai H, Koiwa Y. Myocardial rapid velocity distribution. Ultrasound Med Biol. 2001; 27:481–498.
Article6. Terkelsen CJ, Poulsen SH, Nørgaard BL, Lassen JF, Gerdes JC, Sloth E, Nielsen TT, Andersen HR, Egeblad H. Does postsystolic motion or shortening predict recovery of myocardial function after primary percutanous coronary intervention? J Am Soc Echocardiogr. 2007; 20:505–511.
Article7. Citro R, Galderisi M. Myocardial postsystolic motion in ischemic and not ischemic myocardium: the clinical value of tissue Doppler. Echocardiography. 2005; 22:525–532.
Article8. Galderisi M, Cicala S, Sangiorgi G, Caso P, de Divitiis O. Tissue Doppler-derived postsystolic motion in a patient with left bundle branch block: a sign of myocardial wall asynchrony. Echocardiography. 2002; 19:79–81.
Article9. Fraser AG, Payne N, Mädler CF, Janerot-Sjøberg B, Lind B, Grocott-Mason RM, Ionescu AA, Florescu N, Wilkenshoff U, Lancellotti P, Wütte M, Brodin LA. MYDISE Investigators. Feasibility and reproducibility of off-line tissue Doppler measurement of regional myocardial function during dobutamine stress echocardiography. Eur J Echocardiogr. 2003; 4:43–53.
Article10. Ring M, Persson H, Mejhert M, Edner M. Post-systolic motion in patients with heart failure--a marker of left ventricular dyssynchrony? Eur J Echocardiogr. 2007; 8:352–359.
Article11. Badran HM, Elnoamany MF, Seteha M. Tissue velocity imaging with dobutamine stress echocardiography--a quantitative technique for identification of coronary artery disease in patients with left bundle branch block. J Am Soc Echocardiogr. 2007; 20:820–831.
Article12. Celutkiene J, Sutherland GR, Laucevicius A, Zakarkaite D, Rudys A, Grabauskiene V. Is post-systolic motion the optimal ultrasound parameter to detect induced ischaemia during dobutamine stress echocardiography? Eur Heart J. 2004; 25:932–942.
Article13. Garcia MJ, Rodriguez L, Ares M, Griffin BP, Klein AL, Stewart WJ, Thomas JD. Myocardial wall velocity assessment by pulsed Doppler tissue imaging: characteristic findings in normal subjects. Am Heart J. 1996; 132:648–656.
Article14. Sengupta PP, Khandheria BK, Korinek J, Wang J, Belohlavek M. Biphasic tissue Doppler waveforms during isovolumic phases are associated with asynchronous deformation of subendocardial and subepicardial layers. J Appl Physiol (1985). 2005; 99:1104–1111.
Article15. Remme EW, Lyseggen E, Helle-Valle T, Pettersen E, Ragnarsson A, Ihlen H, Edvardsen T, Smiseth OA, Opdahl A, Vartdal T, Ljosland M. Response to letter regarding article, "Mechanisms of preejection and postejection velocity spikes in left ventricular myocardium: interaction between wall deformation and valve events". Circulation. 2009; 119:e205.
Article16. Van Steenhoven AA, Verlaan CW, Veenstra PC, Reneman RS. In vivo cinematographic analysis of behavior of the aortic valve. Am J Physiol. 1981; 240:H286–H292.
Article17. Smith D, Craige E. Influence of the aortic component of the second heart sound on left ventricular maximal negative dP/dt in the dog. Am J Cardiol. 1985; 55:205–209.
Article18. Bogren HG, Buonocore MH. Blood flow measurements in the aorta and major arteries with MR velocity mapping. J Magn Reson Imaging. 1994; 4:119–130.
Article19. Bogren HG, Buonocore MH. 4D magnetic resonance velocity mapping of blood flow patterns in the aorta in young vs. elderly normal subjects. J Magn Reson Imaging. 1999; 10:861–869.
Article20. Aase SA, Torp H, Støylen A. Aortic valve closure: relation to tissue velocities by Doppler and speckle tracking in normal subjects. Eur J Echocardiogr. 2008; 9:555–559.
Article21. Oh JK, Tajik J. The return of cardiac time intervals: the phoenix is rising. J Am Coll Cardiol. 2003; 42:1471–1474.22. Weidemann F, Kowalski M, D'hooge J, Bijnens B, Sutherland GR. Doppler myocardial imaging. A new tool to assess regional inhomogeneity in cardiac function. Basic Res Cardiol. 2001; 96:595–605.
Article23. Aase SA, Stoylen A, Ingul CB, Frigstad S, Torp H. Automatic timing of aortic valve closure in apical tissue Doppler images. Ultrasound Med Biol. 2006; 32:19–27.
Article24. Aase SA, Björk-Ingul C, Thorstensen A, Torp H, Støylen A. Aortic valve closure: relation to tissue velocities by Doppler and speckle tracking in patients with infarction and at high heart rates. Echocardiography. 2010; 27:363–369.
Article
- Full Text Links
-
- Actions
-
Cited
- CITED
-
- Close
- Share
-
- Similar articles
-
- Assessment of Normal Mitral Annulus Velocity by Doppler Tissue Imaging
- Assessment of Cardiac Function in Neonates by Using Tissue Doppler Imaging
- Mitral Annulus Velocity Measured by Pulsed Wave Doppler Tissue Imaging in Healthy Korean People
- Myocardial Function in Infant Kawasaki Disease with Tissue Doppler Imaging
- Assessment of Diastolic Function Using Mitral Annulus Velocity by Doppler Tissue Velocity in the Patients with Left Ventricular Hypertrophy
