Korean J Obstet Gynecol.
2012 Feb;55(2):98-103. 10.5468/KJOG.2012.55.2.98.
Investigation of obstetric history and abortion proportion according to the age group at a single institution
- Affiliations
-
- 1Department of Obstetrics and Gynecology, Institute of Women's Life Medical Science, Yonsei University College of Medicine, Seoul, Korea. san1@yuhs.ac
- KMID: 2078121
- DOI: http://doi.org/10.5468/KJOG.2012.55.2.98
Abstract
OBJECTIVE
This study aimed to help to understand the Korean women's obstetrical history, especially abortion history, based on the medical records of gynecologic patients admitted to Severance Hospital.
METHODS
We identified the tendency of the obstetrical history and investigated the proportion of abortion to gravidity and the proportion of induced abortion to total abortion according to the age group, based on the obstetrical history on admission note of 10,601 patients, who were admitted to our hospital from November 2005 to April 2011.
RESULTS
The mean age of the patients was 43.1 years (range, 10 to 90 years) and the mean gravidity was 2.65 (+/-2.31). The mean parity and abortion number was 1.47 (+/-1.34) and 1.18 (+/-1.50), respectively. The higher age groups tended to have increased number of gravidity and parity. Number of induced abortion was highest in the age group 60-69 and 70-79 years (1.80 +/- 1.99 and 1.80 +/- 2.35, respectively). The total abortion proportion was 0.44 and the proportion of total abortion to gravidity tended to increase in the younger age groups (age group 10-19: 0.95 and 20-29: 0.80). The proportion of induced abortion to total abortion was 0.84 in total. The proportion was highest in the age group 10-19 years (0.95) and lowest in the age group 30-39 years (0.72).
CONCLUSION
This data based on the medical records of gynecologic patients will provide important information for the amendment of the new law on abortion.
MeSH Terms
Figure
-
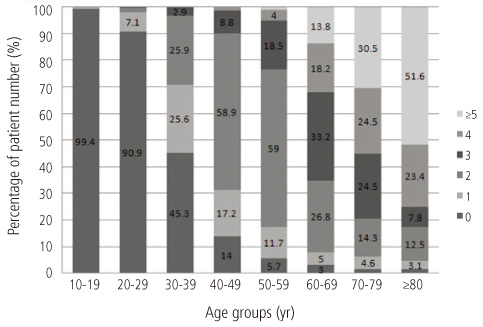
Fig. 1 Percentage of patient number according to the number of parity and the age groups.
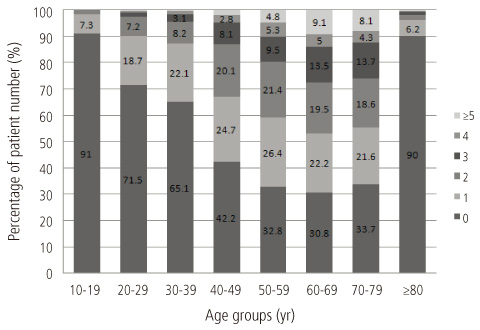
Fig. 2 Percentage of patient number according to the number of induced abortion and the age groups.
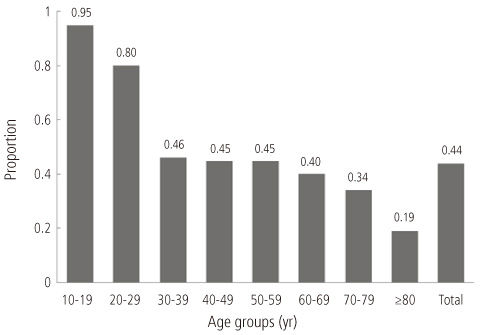
Fig. 3 The proportion of total abortion to gravidity according to the age groups.
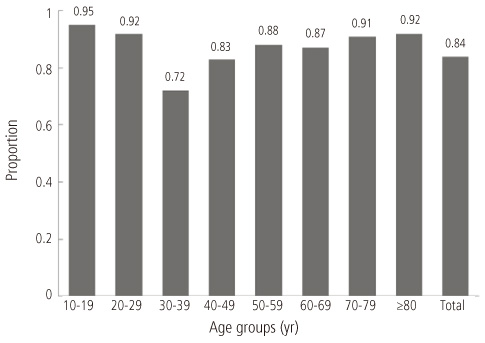
Fig. 4 The proportion of induced abortion to total abortion according to the age groups.
Cited by 1 articles
-
Artificial Abortion and Sex Education Program in Future
Eun-Mi Jun
Korean J Women Health Nurs. 2019;25(3):237-238. doi: 10.4069/kjwhn.2019.25.3.237.
Reference
-
1. Kim HJ. Foreign situation of abortion. J Korean Bioethics Assoc. 2006. 7:1–7.2. Ministry of Health and Welfare. 2010 Yearbook of health and welfare statistics. 2010. Seoul (KR): Ministry of Health and Welfare.3. Korea Institute for Health and Social Affairs. 1991 Jeonguk chulsannyeok josa teukbyeolbunseok. 1992. Seoul (KR): Korea Institute for Health and Social Affairs;Report no.: 92-23.4. Hur JY. Medical ethics of abortion-abortion in South Korea status and issues. Korean J Obstet Gynecol. 1994. 37:615–621.5. Jones RK, Kavanaugh ML. Changes in abortion rates between 2000 and 2008 and lifetime incidence of abortion. Obstet Gynecol. 2011. 117:1358–1366.
- Full Text Links
-
- Actions
-
Cited
- CITED
-
- Close
- Share
-
- Similar articles
-
- Effect of Maternal Job Activity on Preterm Delivery, Low Birth Weight and Spontaneous Abortion
- Relationship between History of Pregnancies and Bone Mineral Density
- Obstetric Complications by the Accessibility to Local Obstetric Service
- A Study on the Uterine Myoma in Pregnancy
- Prognosis of Threatened Abortion according to Embryonic Heart Rate
