Receiver Operating Characteristic (ROC) Curve: Practical Review for Radiologists
- Affiliations
-
- 1Department of Radiology, Seoul National University College of Medicine and Institute of Radiation Medicine, SNUMRC. jmgoo@plaza.snu.ac.kr
- 2Biostatistics Section, Department of Pediatrics, University of Arkansas for Medical Sciences, Little Rock, AR, U.S.A.
- KMID: 1066240
- DOI: http://doi.org/10.3348/kjr.2004.5.1.11
Abstract
- The receiver operating characteristic (ROC) curve, which is defined as a plot of test sensitivity as the y coordinate versus its 1-specificity or false positive rate (FPR) as the x coordinate, is an effective method of evaluating the performance of diagnostic tests. The purpose of this article is to provide a nonmathematical introduction to ROC analysis. Important concepts involved in the correct use and interpretation of this analysis, such as smooth and empirical ROC curves, parametric and nonparametric methods, the area under the ROC curve and its 95% confidence interval, the sensitivity at a particular FPR, and the use of a partial area under the ROC curve are discussed. Various considerations concerning the collection of data in radiological ROC studies are briefly discussed. An introduction to the software frequently used for performing ROC analyses is also presented.
Keyword
MeSH Terms
Figure
-
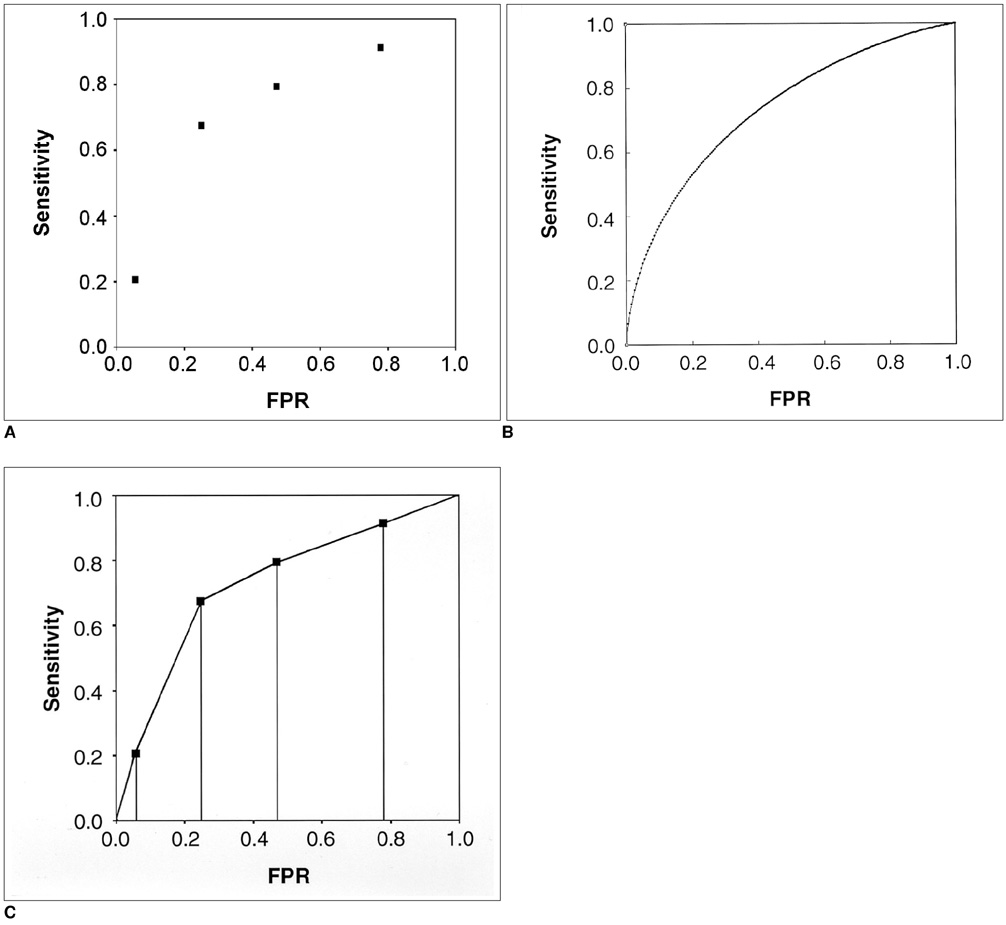
Fig. 1 ROC curves from a plain chest radiography study of 70 patients with solitary pulmonary nodules (Table 3). A. A plot of test sensitivity (y coordinate) versus its false positive rate (x coordinate) obtained at each cutoff level. B. The fitted or smooth ROC curve that is estimated with the assumption of binormal distribution. The parametric estimate of the area under the smooth ROC curve and its 95% confidence interval are 0.734 and 0.602 ~ 0.839, respectively. C. The empirical ROC curve. The discrete points on the empirical ROC curve are marked with dots. The nonparametric estimate of the area under the empirical ROC curve and its 95% confidence interval are 0.728 and 0.608 ~ 0.827, respectively. The nonparametric estimate of the area under the empirical ROC curve is the summation of the areas of the trapezoids formed by connecting the points on the ROC curve.
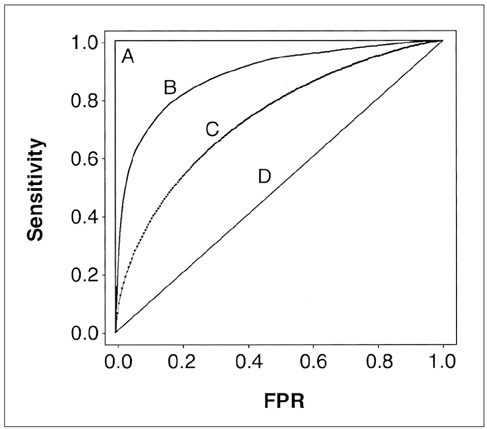
Fig. 2 Four ROC curves with different values of the area under the ROC curve. A perfect test (A) has an area under the ROC curve of 1. The chance diagonal (D, the line segment from 0, 0 to 1, 1) has an area under the ROC curve of 0.5. ROC curves of tests with some ability to distinguish between those subjects with and those without a disease (B, C) lie between these two extremes. Test B with the higher area under the ROC curve has a better overall diagnostic performance than test C.

Fig. 3 Two ROC curves (A and B) with equal area under the ROC curve. However, these two ROC curves are not identical. In the high false positive rate range (or high sensitivity range) test B is better than test A, whereas in the low false positive rate range (or low sensitivity range) test A is better than test B.

Fig. 4 Schematic illustration of a comparison between the sensitivities of two ROC curves (A and B) at a particular false positive rate and comparison between two partial ROC areas. For this example, the false positive rate and partial range of false positive rate (e1 - e2) are arbitrarily chosen as 0.7 and 0.6 ~ 0.8, respectively.
Cited by 3 articles
-
Optimal Cut-Off Value of the Coracohumeral Ligament Area as a Morphological Parameter to Confirm Frozen Shoulder
Hyung Rae Cho, Byong Hyon Cho, Keum Nae Kang, Young Uk Kim
J Korean Med Sci. 2020;35(15):e99. doi: 10.3346/jkms.2020.35.e99.The effect of radiographic imaging modalities and the observer's experience on postoperative maxillary cyst assessment
Tae-In Gang, Kyung-Hoe Huh, Won-Jin Yi, Sam-Sun Lee, Min-Suk Heo, Soon-Chul Choi
Imaging Sci Dent. 2014;44(4):301-305. doi: 10.5624/isd.2014.44.4.301.Measurement of Pancreatic Fat Fraction by CT Histogram Analysis to Predict Pancreatic Fistula after Pancreaticoduodenectomy
Wonju Hong, Hong Il Ha, Jung Woo Lee, Sang Min Lee, Min-Jeong Kim
Korean J Radiol. 2019;20(4):599-608. doi: 10.3348/kjr.2018.0557.
Reference
-
1. Obuchowski NA. Receiver operating characteristic curves and their use in radiology. Radiology. 2003. 229:3–8.2. Zhou XH, Obuchowski NA, McClish DK. Statistical methods in diagnostic medicine. 2002. 1st ed. New York: John Wiley & Sons;15–164.3. Metz CE. ROC methodology in radiologic imaging. Invest Radiol. 1986. 21:720–733.4. Metz CE. Some practical issues of experimental design and data analysis in radiologic ROC studies. Invest Radiol. 1989. 24:234–245.5. Metz CE. Basic principles of ROC analysis. Semin Nucl Med. 1978. 8:283–298.6. Bamber D. The area above the ordinal dominance graph and the area below the receiver operating characteristic graph. J Math Psychol. 1975. 12:387–415.7. Hanley JA, McNeil BJ. The meaning and use of the area under a receiver operating characteristic (ROC) curve. Radiology. 1982. 143:29–36.8. DeLong ER, DeLong DM, Clarke-Pearson DL. Comparing the areas under two or more correlated receiver operating characteristic curves: a nonparametric approach. Biometrics. 1988. 44:837–844.9. Motulsky H. Intuitive biostatistics. 1995. 1st ed. New York: Oxford University Press;9–60.10. Metz CE. Quantification of failure to demonstrate statistical significance: the usefulness of confidence intervals. Invest Radiol. 1993. 28:59–63.11. McClish DK. Analyzing a portion of the ROC curve. Med Decis Making. 1989. 9:190–195.12. Jiang Y, Metz CE, Nishikawa RM. A receiver operating characteristic partial area index for highly sensitive diagnostic tests. Radiology. 1996. 201:745–750.13. Rockette HE, Gur D, Metz CE. The use of continuous and discrete confidence judgments in receiver operating characteristic studies of diagnostic imaging techniques. Invest Radiol. 1992. 27:169–172.14. Wagner RF, Beiden SV, Metz CE. Continuous versus categorical data for ROC analysis: some quantitative considerations. Acad Radiol. 2001. 8:328–334.15. Rockette HE, Gur D, Cooperstein LA, et al. Effect of two rating formats in multi-disease ROC study of chest images. Invest Radiol. 1990. 25:225–229.16. Hanley JA, McNeil BJ. A method comparing the areas under receiver operator characteristic curves derived from the same cases. Radiology. 1983. 148:839–843.
- Full Text Links
-
- Actions
-
Cited
- CITED
-
- Close
- Share
-
- Similar articles
-
- Drawing Guidelines for Receiver Operating Characteristic Curve in Preparation of Manuscripts
- Receiver operating characteristic curve: overview and practical use for clinicians
- Analysis of shoulder MR imaging using Receiver Operating Characteristic curve
- Using the Receiver Operating Characteristic (ROC) Curve to Measure Sensitivity and Specificity
- Interpretation of Receiver Operating Characteristics(ROC)
