J Korean Ophthalmol Soc.
2012 May;53(5):639-646.
Analysis of Factors Associated with Variability in Measures Obtained by Spectral Domain Optical Coherence Tomography
- Affiliations
-
- 1Department of Ophthalmology, Sorokdo National Hospital, Goheung, Korea. Sloveno0@naver.com
Abstract
- PURPOSE
To identify factors associated with variability in measures obtained by spectral domain optical coherence tomography (SD-OCT).
METHODS
One hundred ninety-six subjects (370 eyes) with no ophthalmic evidence of retinopathy and with corrected visual acuities better than 0.6 were included. Macular thickness and retinal nerve fiber layer (RNFL) thickness were measured using SD-OCT and were analyzed according to sex, laterality, age, spherical equivalent and signal strength.
RESULTS
The central subfield thickness was significantly lower in the female subjects (r = -0.260, p = 0.000). As age increased, average inner and outer macular thickness increased significantly (r = 0.153, p = 0.010; r = 0.193, p = 0.001). Spherical equivalent correlated negatively with central subfield thickness (r = -0.352, p = 0.000) but correlated positively with average inner macular thickness, average outer macular thickness, overall average thickness, overall macular volume, and average RNFL thickness (r = 0.181, p = 0.002; r = 0.287, p = 0.000; r = 0.346, p = 0.000; r = 0.341, p = 0.000; and r = 0.261, p = 0.000, respectively). Signal strength correlated negatively with average inner macular thickness (r = -0.136, p = 0.023).
CONCLUSIONS
SD-OCT shows that retinal thickness is related to age, sex, spherical equivalent and signal strength. Analysis of retinal thickness by SD-OCT should be interpreted in the context of these findings.
Keyword
MeSH Terms
Figure
-
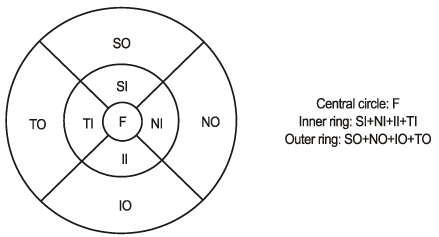
Figure 1 ETDRS subfields within standard 1-, 3-, and 6-mm-diameter concentric circles at the right used for reporting retinal thickness. ETDRS = Early Treatment of Diabetic Retinopathy Study. F = fovea; SI = superior inner; NI = nasal inner; II = inferior inner; TI = temporal inner; SO = superior outer; NO = nasal outer; IO = inferior outer; TO = temporal outer.
Reference
-
1. Nussenblatt RB, Kaufman SC, Palestine AG, et al. Macular thickening and visual acuity. Measurement in patients with cystoid macular edema. Ophthalmology. 1987. 94:1134–1139.2. Song WK, Lee SC, Lee ES, et al. Macular thickness variations with sex, age, and axial length in healthy subjects: a spectral domain-optical coherence tomography study. Invest Ophthalmol Vis Sci. 2010. 51:3913–3918.3. Moon SW, Kim ES, Kim YG, et al. The comparison of macular thickness measurements and repeatabilities between time domain and spectral domain OCT. J Korean Ophthalmol Soc. 2009. 50:1050–1059.4. Kang MS, Kyung SE, Chang MH. Mean macular volume in normal Korean eyes measured by spectral-domain optical coherence tomography. J Korean Ophthalmol Soc. 2010. 51:1077–1083.5. Kim SH, Choi KS, Lee SJ. Macular thickness changes with age and gender in emmetropia using spectral domain optical coherence tomography. J Korean Ophthalmol Soc. 2011. 52:299–307.6. Lim MC, Hoh ST, Foster PJ, et al. Use of optical coherence tomography to assess variations in macular retinal thickness in myopia. Invest Ophthalmol Vis Sci. 2005. 46:974–978.7. Asrani S, Zou S, d'Anna S, et al. Noninvasive mapping of the normal retinal thickness at the posterior pole. Ophthalmology. 1999. 106:269–273.8. Kim BK, Lee DW, Ahn M, Cho NC. Comparison of time domain OCT and spectrum domain OCT for retinal nerve fiber layer assessment. J Korean Ophthalmol Soc. 2009. 50:1539–1547.9. Lee YR, Sung KR, Hong JT, Na JH. Glaucoma diagnostic performance of macular and retinal nerve fiber layer by spectral-domain optical coherence tomography. J Korean Ophthalmol Soc. 2010. 51:1250–1257.10. Wong AC, Chan CW, Hui SP. Relationship of gender, body mass index, and axial length with central retinal thickness using optical coherence tomography. Eye (Lond). 2005. 19:292–297.11. Duan XR, Liang YB, Friedman DS, et al. Normal macular thickness measurements using optical coherence tomography in healthy eyes of adult Chinese persons: the Handan Eye Study. Ophthalmology. 2010. 117:1585–1594.12. Massin P, Erginay A, Haouchine B, et al. Retinal thickness in healthy and diabetic subjects measured using optical coherence tomography mapping software. Eur J Ophthalmol. 2002. 12:102–108.13. Evans JR, Schwartz SD, McHugh JD, et al. Systemic risk factors for idiopathic macular holes: a case-control study. Eye (Lond). 1998. 12(Pt 2):256–259.14. The Eye Disease Case-Control Study Group. Risk factors for idiopathic macular holes. Am J Ophthalmol. 1994. 118:754–761.15. Panda-Jonas S, Jonas JB, Jakobczyk-Zmija M. Retinal photoreceptor density decreases with age. Ophthalmology. 1995. 102:1853–1859.16. Landau D, Schneidman EM, Jacobovitz T, Rozenman Y. Quantitative in vivo retinal thickness measurements in healthy subjects. Ophthalmology. 1997. 104:639–642.17. Zou H, Zhang X, Xu X, Yu S. Quantitative in vivo retinal thickness measurement in Chinese healthy subjects with retinal thickness analyzer. Invest Ophthalmol Vis Sci. 2006. 47:341–347.18. Chan CM, Yu JH, Chen LJ, et al. Posterior pole retinal thickness measurements by the retinal thickness analyzer in healthy Chinese subjects. Retina. 2006. 26:176–181.19. Chan A, Duker JS, Ko TH, et al. Normal macular thickness measurements in healthy eyes using Stratus optical coherence tomography. Arch Ophthalmol. 2006. 124:193–198.20. Wakitani Y, Sasoh M, Sugimoto M, et al. Macular thickness measurements in healthy subjects with different axial lengths using optical coherence tomography. Retina. 2003. 23:177–182.21. Lam DS, Leung KS, Mohamed S, et al. Regional variations in the relationship between macular thickness measurements and myopia. Invest Ophthalmol Vis Sci. 2007. 48:376–382.22. Eriksson U, Alm A. Macular thickness decreases with age in normal eyes: a study on the macular thickness map protocol in the Stratus OCT. Br J Ophthalmol. 2009. 93:1448–1452.23. Varma R, Bazzaz S, Lai M. Optical tomography-measured retinal nerve fiber layer thickness in normal latinos. Invest Ophthalmol Vis Sci. 2003. 44:3369–3373.24. Budenz DL, Anderson DR, Varma R, et al. Determinants of normal retinal nerve fiber layer thickness measured by Stratus OCT. Ophthalmology. 2007. 114:1046–1052.25. Schuman JS, Hee MR, Puliafito CA, et al. Quantification of nerve fiber layer thickness in normal and glaucomatous eyes using optical coherence tomography. Arch Ophthalmol. 1995. 113:586–596.26. Apple DJ, Rabb MF. Clinicopathologic Correlation of Ocular Disease : A Text and Stereoscopic Atlas. 1978. St. Louis: Mosby;39–44.27. Yanoff M, Fine BS. Ocular Pathology, A Text and Atlas. 1982. Philadelphia: Haper & Row;513–514.28. Wu Z, Vazeen M, Varma R, et al. Factors associated with variability in retinal nerve fiber layer thickness measurements obtained by optical coherence tomography. Ophthalmology. 2007. 114:1505–1512.29. Samarawickrama C, Pai A, Huynh SC, et al. Influence of OCT signal strength on macular, optic nerve head, and retinal nerve fiber layer parameters. Invest Ophthalmol Vis Sci. 2010. 51:4471–4475.
- Full Text Links
-
- Actions
-
Cited
- CITED
-
- Close
- Share
-
- Similar articles
-
- Analysis of Factors Associated with Variability in Measures Obtained by Spectral Domain Optical Coherence Tomography
- A Case of Ocular Toxoplasmosis Imaged with Spectral Domain Optical Coherence Tomography
- Fundus Autofluorescence, Fluorescein Angiography and Spectral Domain Optical Coherence Tomography Findings of Retinal Astrocytic Hamartomas in Tuberous Sclerosis
- Comparison of the Efficacy between Time and Spectral Domain Optical Coherence Tomography for the Identification of Vitreomacular Interface
- Choroidal Thickness at the Outside of Fovea in Diabetic Retinopathy Using Spectral-Domain Optical Coherence Tomography
